Physical Activity and Respiratory Function:
Corporal Composition and Spirometric
Values Analysis
Atividade Física e Função Respiratória: Análise da Composição Corporal e
dos Valores Espirométricos
1. Escola Superior de Educação. Instituto Politécnico de Castelo Branco. Castelo Branco. Portugal. 2. Departamento de Ciências do Desporto. Universidade da Beira Interior. Covilhã. Portugal.
3. CIAFEL - Centro de Investigação em Actividade Física, Saúde e Lazer. Faculdade de Desporto. Universidade do Porto. Portugal. Recebido: 21 de Setembro de 2012 - Aceite: 15 de Abril de 2013 | Copyright © Ordem dos Médicos 2013
Rui PAULO1, João PETRICA1, Júlio MARTINS2,3
Acta Med Port 2013 May-Jun;26(3):258-264
RESUMO
Objetivo: A presente investigação tem como principal objetivo verificar os efeitos da atividade física na composição corporal (índice de massa corporal e perímetro da cintura), nos valores espirométricos e relacionar esses indicadores com a função respiratória.
Material e Métodos: A amostra, constituída por 86 indivíduos, alunos do ensino superior, com média de idade de 21,3 ± 2,4 anos, foi dividida em dois grupos: grupo de controlo constituído por 28 sujeitos sedentários (20,9 ± 1,3 anos), e grupo experimental constituído por 58 sujeitos (21,5 ± 2,8 anos) praticantes de exercício supervisionado. Para caraterizar a amostra quanto ao tipo de atividade física, aplicámos uma adaptação do questionário de Telama et al. Avaliaram-se os valores de espirometria (DEMI, VEF1 e CVF) com o
es-pirómetro Microquark da Cosmed e os valores de índice de massa corporal e perímetro da cintura. Os dados obtidos foram tratados no S.P.S.S. 19.0, através do t-test, do teste de Levene, do teste Mann-Whitney e do teste de correlação de Spearman, adotando-se um nível de significância de 5%.
Resultados: O grupo experimental obteve resultados significativamente melhores (p ≤ 0,05) nos valores de índice de massa corpo-ral, do perímetro da cintura e em todos os valores avaliados pela espirometria (DEMI, VEF1 e CVF), comparativamente ao grupo de
controlo. Verificámos também que há uma tendência para correlação negativa entre os valores da composição corporal e os valores espirométricos, apenas observável em algumas variáveis (DEMI, VEF1), ou seja, quanto maiores os valores da composição corporal,
menores os valores espirométricos.
Conclusão: Os alunos com prática de exercício supervisionado, apresentaram melhores índices de composição corporal e de função respiratória. Valores de índice de massa corporal e de perímetro da cintura desajustados poderão provocar disfunção respiratória, ao nível da ventilação e respetivos volumes pulmonares, limitando a prática de atividade física e aumentando a apetência para patologias respiratórias.
Palavras-chave: Actividade Motora; Estudantes; Espirometria; Exercício Físico; Função Respiratória.
ABSTRACT
Objective: The main aim of this research project was to measure the effects of physical activity on corporal composition (BMI and waist circumference) on spirometric values and relate these indicators to the respiratory/ventilator function.
Material and Methods: The sample consisted of 86 individuals, higher education students, with an average age of 21.3 ± 2.4 years, who were divided into two groups: the control group consisted of 28 sedentary subjects (20.9 ± 1.3 years), and the experimental group consisting of 58 subjects (21.5 ± 2.8 years) who undertook supervised exercise. To characterize the sample of the type of physical activity, we used an adaptation of the questionnaire Telama et al.19 We assessed the value of spirometry (PEF, FVC and FEV1) with a
Microquark Cosmed spirometer and the BMI and waist circumference. The figures obtained were processed with the S.P.S.S. 19.0, the t-test, the Levene test, the Mann-Whitney test and the Spearman correlation test, adopting a significance level of 5%.
Results: The experimental group achieved significantly better BMI and waist circumference results (p ≤ 0.05) and in all of the values assessed by spirometry (PEF, FVC and FEV1) compared to the control group. We also found that there is a tendency for a negative
correlation between the values of body composition and spirometric values, only observable in some variables (PEF, FEV1), i.e., the
higher the values of body composition, the lower the spirometric values.
Conclusion: The students that performed supervised exercise had higher levels of body composition and lung function. Poor BMI and waist circumference values may lead to respiratory dysfunction in terms of ventilation and the respective lung volumes, limiting the practice of physical activity and increasing the probability of respiratory pathologies.
Keywords: Exercise; Exercise Test; Motor Activity; Respiration; Spirometry; Students; Vital Capacity.
INTRODUCTION
Regular physical activity (PA) has positive effects on hu-man health;1 on the other hand, physical inactivity and or a
sedentary lifestyle adversely influences body weight and is associated with obesity,2 which in turn may cause a
restric-tive syndrome, reducing lung volumes due to the accumula-tion of perithoracic and abdominal fat.3
Although Body Mass Index (BMI) is considered a poor predictor of body fat, its usefulness lies in its direct
connection with mortality, i.e. as BMI increases through a moderate or severe overweight, there is also an increase in the risk of cardiovascular problems, some cancers, diabetes mellitus, osteoarthritis and kidney disease, factors which contribute to its epidemiological importance.4 In contrast, waist circumference (WC) allows for the assessment of central distribution of body fat; this measurement having received great attention in cardiovascular risk assessment
as it has been demonstrated to be a strong predictor of visceral fat, considered responsible for metabolic disorders and cardiovascular disease.5,6 Obesity and overweight are also related with an increase of the risk of respiratory distress. The prevalence of symptoms increases as BMI or WC increase.7
Spirometry is the study of air volume and flow rate, using standardized respiratory exercises, comparing these with reference patterns regarding the height, gender and age of the patient.8 It identifies the presence of airflow
obstruction, distinguishing the presence of airway disorders from a normal air volume.
Several studies correlating lung performance and overweight/obesity prevalence9,10 have identified the presence of respiratory disorders, mainly affecting lung volume and capacity: the expiratory reserve volume, forced expiratory volume in first second (FEV1), forced vital
capacity (FCV) and expiratory flow rates.
Respiratory disorders as asthma, sleep apnoea and exercise intolerance are common in young obese patients, leading to scarce physical activity and sports, adversely affecting weight loss.11,12 With the ever increasing fat deposition covering the thoracic cavity, present within and covering the abdominal cavity, the respiratory function is progressively more affected.13 These functional
modifications are more frequent in central obesity, in which the adipose tissue accumulation is located mainly around the waist.14,15 Divergences between body fat distribution patterns also affect lung volumes. Fat accumulation in abdominal cavity, called gynoid obesity, has probably a direct mechanic effect on the thorax and diaphragm, by a compression mechanism which, in turn, prevents lung expansibility, causing lung volume reduction.15 In this
context, obesity and body fat distribution patterns may influence respiratory function results.16
Therefore, spirometry is fundamental for the assessment, representing the major instrument in lung pathology diagnosis. FCV is the volume expelled in forced expiration from total lung capacity until residual volume. It
is an important test because, during expiration, a patient may attain the maximum flow limit but, as the curve defines the limit for the flow, it is very reproducible and, more importantly, maximum flow is very sensitive in most lung pathologies.17 Another important assessed volume is FEV1,
which is the volume of air that can be forcibly blown out in one second, after a full inspiration. PEF (peak expiratory flow) is also an important indicator.
The present work aimed to study the effects of PA on body composition (BMI and WC) as well as on spirometry values, and to study the possible correlation between body composition values and lung volumes in our group of patients.
MATERIAL AND METHODS
Our group of participants included 86 volunteers of both genders, apparently healthy, with ages between 18 and 31, with a mean age of 21.3 ± 2.4. All individuals were state university students.
In this cross-sectional study, the group was divided in two: 1) an experimental group of students practising supervised exercise, mainly acyclic exercise (aerobic/ anaerobic) aiming for physical fitness and with planned intensity, n = 58 (mean ± SD, age 21.5 ± 2.8); 2) a control group: sedentary students, n = 28 (mean ± SD, age 20.9 ± 1.3) not undertaking supervised PA (Table 1).
Regarding the training protocol, all exercise sessions were supervised by accredited professionals in physical activity promotion; the duration of each session ranged between 60 and 90 minutes. The protocol ran for 30 weeks and each participant attended at least two weekly sessions. A perceived exertion scale using an oral survey was used to assess exercise intensity, in order to evaluate the degree of difficulty of the exercise and to ensure moderate to high intensity.
Instruments and measurements
This study has been approved by the Ethics Committee of the Faculty of Medicine of Beira Interior, Covilhã, Portugal.
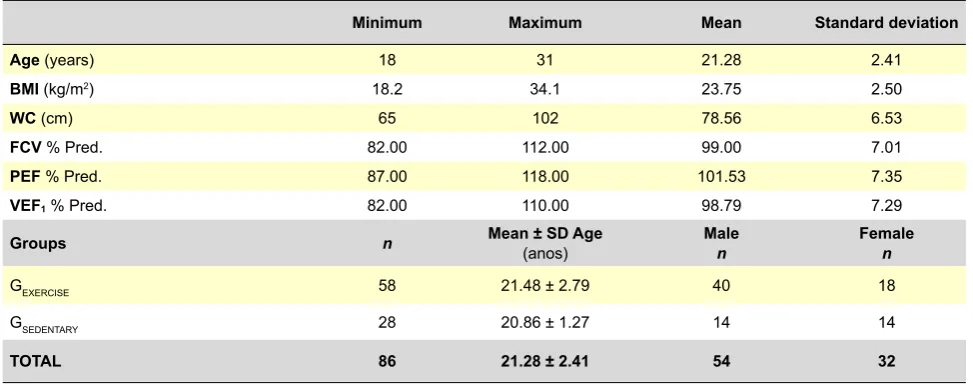
Table 1 - Participants characterisation (n = 86) and groups
Minimum Maximum Mean Standard deviation
Age (years) 18 31 21.28 2.41
BMI (kg/m2) 18.2 34.1 23.75 2.50
WC (cm) 65 102 78.56 6.53
FCV % Pred. 82.00 112.00 99.00 7.01
PEF % Pred. 87.00 118.00 101.53 7.35
VEF1 % Pred. 82.00 110.00 98.79 7.29
Groups n Mean ± SD Age (anos) Malen Femalen
GEXERCISE 58 21.48 ± 2.79 40 18
GSEDENTARY 28 20.86 ± 1.27 14 14
TOTAL 86 21.28 ± 2.41 54 32
A written authorization was obtained from the participants, using an informed and free consent form, and participants were previously informed about the scope and the objectives of the study, as well as regarding personal data confidentiality. All written instructions about the procedures were presented, so that each participant would get the same indications. The study met the compliance requirements of international standards on human experimentation.18
The underlying criteria regarding participant’s selection in both groups were comparable in their major socioeconomic and biological variables (confirmed by the survey application); the tests were applied using the same technique and the same testers.
PA questionnaire
An adaptation of a validated questionnaire19 with a published adaptation to the Portuguese population20,21 was applied, in order to characterise the participants regarding PA practice and allowing for the differentiation of the two groups of participants in the study.
Height measurement
Height values were measured in meters, quoted to the nearest millimetre, utilizing a SECA (Germany, Hamburg) stadiometer, using the ground and the vertex as reference planes, according with the technique proposed by the Council of Europe.22 Two evaluations were made, and the
arithmetic mean was calculated. In the event of a difference of over 2 mm, a third measurement was performed.
Body mass measurement
Body mass was measured in Kg, using a SECA 708 (Germany, Hamburg) digital scale, quoted to the nearest hundred mark,22 with the participants barefoot and wearing
light clothes. Two evaluations were made and the arithmetic mean was calculated. In the event of a difference of over 0.2
Kg, a third measurement was performed.
World Health Organization BMI (kg/m2) classifications
were used.23
Waist circumference measurement
Regarding WC, values were measured with a Rosscraft two-meter, 1mm-resolution fibreglass measuring tape, according with recommended procedures.24
Spirometry values
A Cosmed Microquark spirometer was used to measure spirometry values (PEF, FEV1 and FCV). Spirometry is a
test used in the diagnosis, prevention and quantification of ventilatory disorders, and is measured during a forced expiratory technique. Due to its complexity, it requires the understanding and collaboration of the patient, the use of calibrated equipment and standardized techniques carried out by specialized personnel. The obtained values must be compared with the estimated values for a certain population, and its interpretation must be made according to clinical and epidemiological data. The spirometer measures the expired air volume, especially useful in the analysis of data related with the forced expiratory technique, according to current recommendations.17
Statistical processing of data
Regarding statistical procedures, using SPSS 19.0 Software, the Kolmogorov-Smirnov test was used to verify sample normality, confirming it for only two of the studied variables (FCV and PEF). Independent samples t-Test were used for these two variables and the Levene test verified for the equality of variances. For the remaining variables (Age, BMI, WC and FEV1), which did not show normality, we used
the Mann-Whitney test. A significance level of 5% has been adopted. We used the non-parametric Spearman test for the correlation analysis.
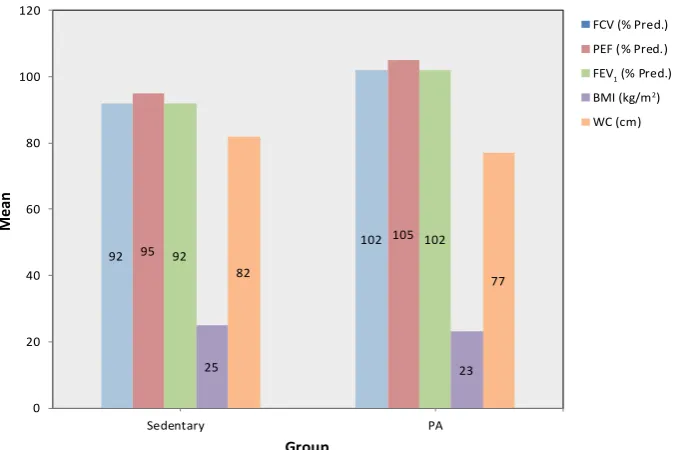
92 95 102
105
92 102
25 23
82
77
0 20 40 60 80 100 120
Sedentary PA
Mean
Group
FCV (% Pred.) PEF (% Pred.) FEV1 (% Pred.) BMI (kg/m2) WC (cm)
Figure 1 – Mean of the assessed variables in both groups
RESULTS
Results are presented as mean and standard deviation for the categorical variables. In a first analysis, presented in Table 2, group GEXERCISE presents higher average values in all assessed indicators, comparing with the group GSEDENTARY (Figure 1).
In order to verify the presence of significant differences in evaluated variables and in ages between the groups, two independent sample t-Tests were used for two of the variables (FCV and PEF). Mann-Whitney test was used for the remaining measured variables (Age, BMI, WC and FEV1). A significance level of 5% was used for both tests.
The two groups were homogeneous as regards mean age, i.e. they did not present statistically significant differences (p ≥ 0.05). When comparing the BMI and WC values, we observed statistically very significant differences (p ≤ 0.01) between both groups. We found similar
differences for the FEV1 variable (Table 3) and statistically
very significant differences between both groups for the two last variables, FCV and PEF (p ≤ 0.01) (Table 4).
Correlation analysis
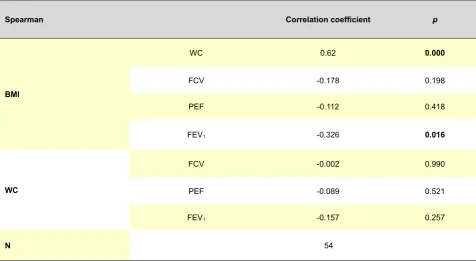
One of the objectives of this study aimed to verify the correlation between the study’s variables. In a first analysis, we found that the gender variable influenced correlations between the remaining variables. Therefore, we decided to analyse correlations, separating the gender variable. As shown in Table 5, for male participants, we found a very statistically significant positive correlation (p ≤ 0.01) between BMI and WC. Therefore, as BMI increases, WC also increases.
Regarding the remaining variables, we only found a negative correlation, statistically significant
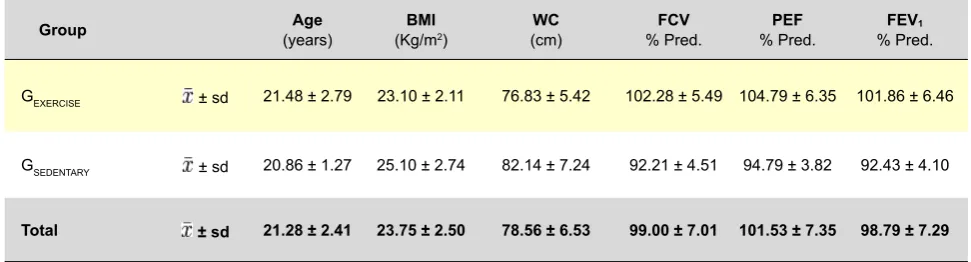
Table 2 - Mean and standard deviation of the results of assessed variables divided by the two groups
Group (years)Age (Kg/mBMI2) (cm)WC % Pred.FCV % Pred.PEF % Pred.FEV1
GEXERCISE ± sd 21.48 ± 2.79 23.10 ± 2.11 76.83 ± 5.42 102.28 ± 5.49 104.79 ± 6.35 101.86 ± 6.46
GSEDENTARY ± sd 20.86 ± 1.27 25.10 ± 2.74 82.14 ± 7.24 92.21 ± 4.51 94.79 ± 3.82 92.43 ± 4.10
Total ± sd 21.28 ± 2.41 23.75 ± 2.50 78.56 ± 6.53 99.00 ± 7.01 101.53 ± 7.35 98.79 ± 7.29
Table 3 - Significance level of comparisons between groups for age, BMI, WC and FEV1 variables
Age BMI WC FEV1
Mann-Whitney U 744.00 420.00 442.00 206.00
Wilcoxon W 1150.00 2131.00 2153.00 612.00
Z -0.,64 -3.62 -3.42 -5.60
p 0.523 0.000 0.001 0.000
Table 4 - Level of significance of comparisons between groups for FCV and PEF variables
Levene Test t-test
F Sig. t Df p Difference of means standard errorsDifference of
FCV Equal variances assumed 2.11 0.150 -8.421 84 0.000 -10.06 1.19
Unequal variances assumed -9.018 63.93 0.000 -10.06 1.12
PEF Equal variances assumed 5.16 0.026 -7.679 84 0.000 -10.01 1.30
Unequal variances assumed -9.077 79.89 0.000 -10.01 1.10
(p ≤ 0.05), between BMI and FEV1. Therefore, as BMI increases, FEV1 values decrease. We also demonstrate
a trend towards negative correlations between body composition variables (BMI and WC) and spirometry values (FCV, PEF and FEV1), although at statistically not acceptable significance level (p ≥ 0.05), as shown in Table 5.
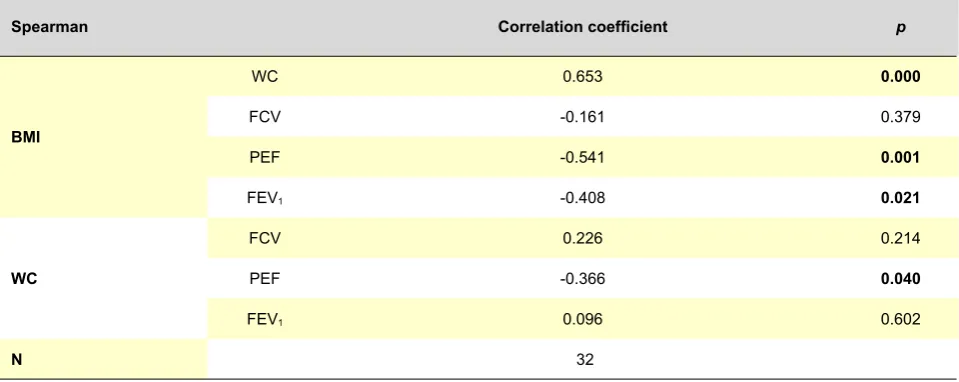
Regarding female participants described in Table 6, there is also a very positive statistically significant correlation (p
≤ 0.01) between BMI and WC, similar to what we observed in male participants: as BMI increases, female WC also increases.
Regarding the remaining variables, we found statistically significant negative correlations (p ≤ 0.05) between BMI and FEV1 and between WC and PEF. We also found a very statistically significant negative correlation (p ≤ 0.01) between BMI and PEF. Therefore, we can conclude regarding these variables that as body composition values (BMI and WC) increase, spirometry values decrease.
DISCUSSION
One of the objectives of the present work aimed to verify if supervised and planned PA had any impact on the university students body composition (BMI and WC) and spirometry value (FCV, PEF and FEV1) improvement. The
results obtained in the present study are in keeping with the described importance of oriented and supervised physical exercise, regarding its volume and intensity, in maintaining and improving spirometry and body composition values, when compared to a sedentary activity and lifestyle.1-3,11,12 Regarding body composition, we sought to check if regularly active individuals present lower and more adjusted
values comparing with a sedentary counterpart, and we found significant differences regarding this variable in both groups of participants. Higher energy consumption in the group of planned exercise practice would be a reasonable explanation for this fact. Despite the fact that diet was not a controlled parameter nor prescribed to study participants, we know that this is a factor that may influence some assessed indicators although, according to Slentz et al.,25 a
balanced diet combined with regular PA represent the most effective way to achieve body weight control.25
Regarding the assessed spirometry values (FCV, PEF and FEV1), we also found statistically significant differences
between both groups. Therefore, it seems that a supervised exercise practice translates in keeping adequate spirometry values, therefore reducing the risk of respiratory pathology.15
We also found a very significant positive correlation between body composition variables (between BMI and WC). Therefore, our results indicate that as BMI increases, WC also trends towards an increase, which may indicate a higher possibility of fat abdominal accumulation, predicting an increase in visceral fat, the major responsible factor for cardiovascular pathology emergence.5,6
Our study does not show that the increase of BMI and WC are clearly relevant contributors for the reduction of all assessed spirometry values, because unlike other studies13,26,27, we did not find any negative correlation between some of the parameters. Nevertheless, some variables showed a negative correlation, thereby demonstrating, as in other studies,28,29 that an increase in body composition values (BMI and WC) may induce a decrease in respiratory function. Overweight and obesity are also related with an increase in the risk of respiratory symptoms,30 i.e. the higher
Table 5 - Level of significance of correlations and correlation coefficient between BMI, WC, FCV, PEF and FEV1 variables in male participants
Spearman Correlation coefficient p
BMI
WC 0.62 0.000
FCV -0.178 0.198
PEF -0.112 0.418
FEV1 -0.326 0.016
WC
FCV -0.002 0.990
PEF -0.089 0.521
FEV1 -0.157 0.257
N 54
the symptom prevalence, the higher the BMI or the waist circumference.
Several mechanisms have been proposed for the possible effects of obesity on respiratory function. The most frequently referred changes include functional residual capacity and expiratory reserve volume reduction, due to a decrease in thoracic wall volume, in lung compliance and an increase in airway resistance.31
CONCLUSIONS
We conclude that the group of students practising supervised and planned intensity exercise present more favourable, statistically significant indicators of a good state of health, in comparison with the group of sedentary students. These differences pertain to body composition and spirometry values.
Regularly and continuously practised physical activity supervised and with objectives of intensity and specified
types of exercise, is responsible for an improvement in body composition and spirometry values of the students, when compared with sedentary students with low activity lifestyles.
On the other hand, there are some indicators that the higher the BMI and the WC, the worse the spirometry values, i.e. the more inadequate the body composition values and the more reduced are the lung volumes, reflecting a change of respiratory function, restricting daily function and eventually also physical activity practice.
CONFLICT OF INTERESTS
The authors declare that there is no conflict of interests in writing the present manuscript.
FUNDING SOURCES
There were no external funding sources in the writing of this manuscript.
Table 6 - Level of significance of correlations and correlation coefficient between BMI, WC, FCV, PEF and FEV1 variables in female participants
Spearman Correlation coefficient p
BMI
WC 0.653 0.000
FCV -0.161 0.379
PEF -0.541 0.001
FEV1 -0.408 0.021
WC
FCV 0.226 0.214
PEF -0.366 0.040
FEV1 0.096 0.602
N 32
ARTIGO ORIGINAL
REFERENCES
1. Dias DF, Reis ICB, Reis DA, Cyrino ES, Ohara D, Carvalho F, et al. Com-paração da aptidão física relacionada à saúde de adultos de diferentes faixas etárias. Rev Bras Cineantropom Desemp Hum. 2008;10:123-8. 2. Padez C, Fernandes T, Mourão I, Moreira P, Rosado V. Prevalence of
overweight and obesity in 7-9-year-old portuguese children: trends in body mass index from 1970-2002. Am J Hum Biol. 2004;16:670-8. 3. Silva AM, Boin IF, Pareja JC, Magna LA. Análise da função respiratória
em pacientes obesos submetidos à operação fobi-capella. Rev Col Bras Cir. 2007;34:314-20.
4. McArdle W, Katch F, Katch V. Fisiologia do exercício: energia, nutrição e desempenho humano. Rio de Janeiro: Guanabara Koogan; 2003. 5. Pereira RA, Sichieri R, Marins VM. Razão cintura/quadril como preditor
de hipertensão arterial. Cad Saude Pública. 1999;15:333-44.
6. Lean MEJ, Han TS, Morrison CE. Waist circumference as a measure for indicating need for weight management. Braz Med J. 1995; 311:158-61. 7. Sahenjami H. Dyspnea in Obese Healthy Men. Chest. 1998;114:373-7. 8. Rodrigues JC. Provas de função pulmonar em crianças e adolescentes.
J Pneumol. 2002;28:207-21.
9. Luce JM. Respiratory Complication of Obesity. Chest. 1980;78:626-31. 10. Rubinstein I, Zamel N, Dubarry L, Hoffstein V. Airflow limitation in
morbi-dly obese subjects nonsmoking men. Ann Intern Med. 1990;112:828-32. 11. Chinn S. Obesity and asthma in children. Thorax. 2006;56:845-50.
12. de Sá Pinto AL, de Barros Holanda PM, Radu AS, Villares SM, Lima FR. Musculoskeletal findings in obese children. J Pediatr Child Healt. 2006;42:341-4.
13. Fung KP. Effects of overweight on lung function. Arch Dis Child. 1990;65:512-5.
14. Collins LC, Hoberty PD, Walker JF, Fletcher EC, Peiris AN. The effect of body fat distribution on pulmonary function tests. Chest. 1995;107:1298-302.
15. Sue DY. Obesity and pulmonary function: more or less? Chest. 1997;111:844-5.
16. Lazarus R, Sparrow D, Weiss ST. Effects of obesity and fat distribution on ventilatory function: the normative aging study. Chest. 1997;111:891-8.
17. Salas T, Rubies C, Gallego C, Muñoz P, Burgos F, Escarrabill J. Tech-nical requirements of spirometers in the strategy for guaranteeing the access to quality spirometry. Arch Bronconeumol. 2011;20;47:466-9. 18. Declaração de Helsínquia. Princípios éticos para pesquisa clínica
en-volvendo seres humanos. Helsínquia: Assembleia Geral da Associação Médica Mundial; 1975.
ARTIGO ORIGINAL
20. Ledent M, Cloes M, Telama R, Diniz J, Piéron M. Participation des jeu-nes Européens aux activités physique et sportives. ADEPS. 1997;159-160:61-71.
21. Mota J, Esculcas C. Leisure time physical activity behavior structured and unstructured choices according gender, age and level of physical activity. Int J Behav Med. 2002;9:111-21.
22. Council of Europe. Convention for the Protection of Human Rights and Dignity of the Human Being with regard to the Application of Biology and Medicine: Convention on Human Rights and Biomedicine. Geneve: CE; 1988.
23. World Health Organization. Obesity Status: preventing and managing the global epidemic. Report of a WHO Consultation on Obesity. Geneve: WHO; 1998.
24. Callaway CW, Chumlea WC, Bouchard C. Circunferences. In: Lohman TG, Roche AF, Martorel R, editors. Anthropometric Standardization Re-ference Manual. Champaign: Human Kinetics Books; 1988.
25. Slentz CA, Duscha BD, Johnson JL, Ketchum K, Aiken LB, Samsa GP,
et al. Effects of the amount of exercise on body weight, body composi-tion, and measures of central obesity: STRRIDE-a randomized control-led study. Arch Intern Med. 2004;164:31-9.
26. Dockery DW, Berkey CS, Ware JH, Speizer FE, Ferris BG Jr. Distri-bution of forced vital capacity and expiratory volume in one second in children 6 to 11 years of age. Am Rev Respir Dis. 1983;128:405-12. 27. Bosisio E, Sergi M, di Natale B, Chiumello G. Ventilatory volume flow
rates, transfer factor and its components (membrane component, capi-llary volume) in obese adults and children. Respiration. 1984;45:321-6. 28. Chen Y, Horne SL, Dosman JA. Body weight and weigth gain related to
pulmonary function decline in adults: a six year follow up study. Thorax. 1993;48:375-80.
29. Inselman LS, Milanese A. Effects of obesity on pulmonary function in children. Pediatr Pulm. 1993;16:130-7.
30. Sahenjami H. Dyspnea in Obese Healthy Men. Chest. 1998;114:1373-7. 31. Zerah F, Harf A, Perlemuter L, Lorino H, Lorino AM, Atlan G. ffects of