Asian J Pharmaceut Res Health Care Volume 5 Issue2 72-79
AJPRHC
Research Article
ESTIMATION OF TIANEPTINE IN ITS TABLET FORM USING VISIBLE SPECTROPHOTOMETRIC METHODS
KALYANA RAMU BURIDI*
Department of Chemistry, Maharajah’s College (Aided & Autonomous), Vizianagaram-535002, AP (India).
*Corresponding author
E-mail: [email protected]
ABSTRACT
Two simple and sensitive visible spectrophotometric methods are described for the determination of tianeptine in bulk and pharmaceutical preparations based on the formation of colored species with SA- NaNO2- - NA (M1) or SNP-acetaldehyde reagent (M2) under specified experimental conditions and exhibiting max at 479 nm or 555nm respectively. The Regression analysis of Beer’s Law plot showed good correlation in a general concentration range of 10-30µg/ml or 8.0-24µg/ml with correlation coefficient (r2=0.999) for methods M1 and M2 respectively. The proposed methods are applied to commercial available stablon tablets and the results are statistically compared with those obtained by the UV reference method and validated with respect to accuracy, precision, linearity, limit of detection, percentage of recovery, repeatability and recovery studies. The results are found satisfactory and reproducible. These methods are applied successfully for the estimation of tianeptine in tablet form without the interference of excipients.
Key words: Assay;Acetaldehyde; Coupling; Diazotization;Regression equation; Sodium nitroprusside.
INTRODUCTION
Asian J Pharmaceut Res Health Care Volume 5 Issue2 72-79
N
S
Cl
CH
3O
O
H
COONa
N
Figure 1: Chemical structure of Tianeptine sodium
In the literature, several analytical techniques like HPLC3-7, PIF methods including Flow Injection analysis8, Spectrofluorometric9, Voltametric10, GC11, UV12 and visible spectrophotometric 13 methods have been reported for its determination in biological fluids and formulations. The main purpose of the present study was to establish a relatively simple, sensitive and validated visible spectrophotometric methods for the determination of TIA in pure form and in pharmaceutical dosage forms, since most of the previous methods involve sophisticated equipments which are costly and pose problems of maintenance. Hence they are not in the reach of most laboratories and small scale industries. So the authors have made some attempts in this direction and succeeded in developing two methods using SA- NaNO2- - NA14 or SNP-ACD15 reagents based on the formation of colored species. These methods can be extended for the routine quality control analysis of pharmaceutical products containing TIA.
MATERIALS & METHODS (EXPERIMENTAL)
Apparatus and chemicals
A Milton Roy UV/Visible spectrophotometer model-1201 with 10mm matched quartz cells was used for all
spectral measurements. Systronics model-362 pH meter was used for all the pH measurements. STABLON Tablets purchased from local market. All the chemicals used were of analytical grade. Sulphanilamide (SD-fine, 0.5%,
7.25x10⁻²M prepared by dissolving 500mg of SA in 25ml of acetone), NaNO2 (E.Merck,2%, 0.29M prepared by
dissolving 2.0g of sodium nitrite in 100ml distilled water), -Naphthyl Amine (BDH, 0.2% 1.40x10⁻²M prepared by dissolving 200mg of -NA in 100ml methanol), Aqueous solutions of sodium nitroprusside (SNP, E. Merck, 1.0%,
3.35x10⁻²M), acetaldehyde (10%), phosphate buffer of pH 8.0(prepared by mixing 30ml of 0.067M potassium
hydrogen phosphate and 970ml of 0.067Mdisodium hydrogen phosphate and pH adjusted to 8.0) were prepared for method M1 and M2.
Preparation ofStandard stock solution:
The standard stock solution (1mg/ml) of TIA was prepared by dissolving 100mg of TIA initially in 10ml of 0.1M NaOH and followed by dilution to 100 ml with distilled water. The working standard solution of TIA 100 µgml-1 (M1) or 200µgml-1 (M2) was obtained by appropriately diluting the standard stock solution with the same solvent. The prepared stock solution was stored at 4 C protected from light. From this stock solution, a series of standards were freshly prepared during the analysis day.
Asian J Pharmaceut Res Health Care Volume 5 Issue2 72-79
Analytical procedures:
Preparation of calibration graphs:
Method M1: Aliquots (1.0ml-3.0ml, 100µgml-1) of the standard TIA solution were transferred into a series of 10ml
calibrated tubes. To this 0.1ml each of sulphanilamide, sodium nitrite, -napthyl amine solutions were added successively. Then total volume was brought to 5ml with distilled water and heated for 5 min at 70ºc. After immersing the tube in water bath at 20ºc for 2 min, 2ml of ethanol was added and the volume in the calibrated tube was made up to the mark with distilled water. The absorbance of the colored azo dye solutions were measured after 5 min at 479nm against a reagent blank prepared similarly. The content of the drug was computed from the calibration graph (Figure 2).
Figure 2: Beer’s Law plot of TIA-SA-NaNO2-NA system
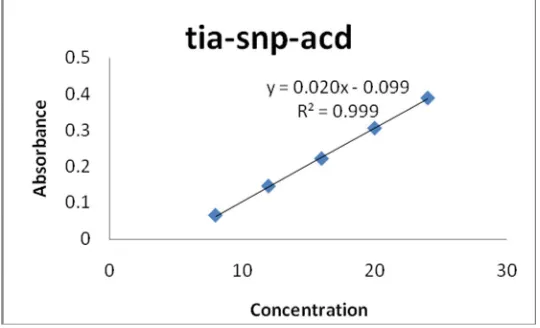
Method M2: Aliquots of working standard TIA drug solution (200µgml-1) such as 1.0, 1.5, 2.0 2.5 and 3.0 ml were
taken separately in a series of 25ml calibrated tubes containing 15ml of buffer pH 8.0. Then 1.0ml each of SNP solution and acetaldehyde were added successively and shaken for 2 minutes and kept aside for 5 minutes at room temperature and made up to the mark with distilled water and sonicated for 1 min for complete color development. The purple colored species was obtained and it was stable for 1 hour. The absorbance of the colored species was measured at 555 nm against the reagent blank. The calibration graph was constructed by plotting the drug concentration versus absorbance. The amount of drug was computed from its calibration curve (Figure 3).
Asian J Pharmaceut Res Health Care Volume 5 Issue2 72-79
RESULTS AND DISCUSSION
In developing these methods, systematic studies of the effects of various parameters were undertaken by varying one parameter at a time and controlling all others fixed (OVAT method). The effect of various parameters such as time, temperature, nature and concentration of reagents, volume and strength of reagents and order of addition of reagents on color development and solvent for final dilution on the intensity and stability of the colored species were studied and the optimum conditions were established. Other water miscible solvents like methanol, ethanol, propan-2-ol and acetonitrile were found to provide no additional advantage. So distilled water is selected as a solvent for final dilution of the colored species for both methods. The optical characteristics such as Beer’s law limit, Sandell‘s sensitivity, molar absorptivity, percent relative standard deviation (calculated from the six measurements containing 3/4th of the amount of the upper Beer’s law limits), Regression characteristics like standard deviation of slope (Sb), standard deviation of intercept (Sa), standard error of estimation (Se) and % range of error (0.05 and 0.01 confidence limits) were calculated using MS Excel software-2007and are shown in TABLE 1.
Commercial formulations containing TIA were successfully analyzed by the proposed method. The values obtained by the proposed and reference method (reported UV method in methanol, max 220nm) for formulations were compared statistically by the t-and F-test and found not to differ significantly. As an additional demonstration of accuracy, recovery experiments were performed by adding a fixed amount of the drug to the pre analyzed formulations at three different concentration levels. These results are summarized in TABLE 2. Chemistry of colored species:
Method M1: Alkanols are generally determined by converting them into alkyl nitrites. The latter upon hydrolysis
liberates nitrous acid stoichiometrically. The liberated nitrous acid is used for diazotizing a primary aryl amine (SA). The diazo compound so produced is coupled to an amine (NA) in the usual manner to yield a dye. In the present investigation, the free carboxyl group present in the drug is involved for the release of nitrous acid from NaNO2. The former diazotizes SA, which is turn coupled with -napthylamine to give a colored azo dye (Figure 4 showing Scheme).
R C O2H
N a N O2
H N O2
N H2- C6H4- S O2N H2 S O 2N H2
C l
N H2
N A
N H2
N = N S O2N H2 S N
N H O
C H3 O
D ru g a n a ly te S A
N N +
A Z O D Y E (c o l o r s p e c ie s ) R =
Asian J Pharmaceut Res Health Care Volume 5 Issue2 72-79
Figure 4: Probable Scheme for method M1
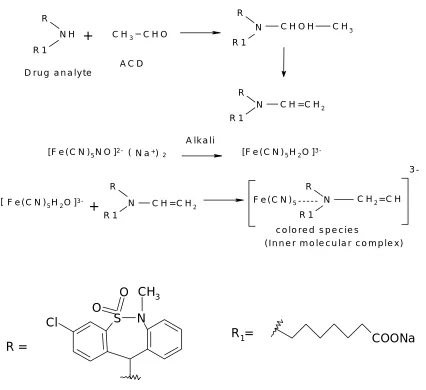
Method M2: Cullies and Waddington 16 found that many secondary but not primary or tertiary amines react with
sodium nitroprusside and acetaldehyde under mild alkaline conditions. Wolfe and Swine hart 17 have reported the formation of [Fe (CN) 5 H2O] 3- in aqueous solution of sodium nitroprusside. The proposed method M2 exploits structural features aliphatic secondary amine of the TIA molecule. The nature of colored species formation with sodium nitroprusside-acetaldehyde reagent is initial N-alkyl vinyl amine formation with acetaldehyde then followed by formation of colored inner molecular complex with sodium nitroprusside has been assumed in the scheme. Based on the analogy, the probable sequence of reactions is presented in scheme (Figure 5).
R
R 1
C H O
R
R 1
C H O H C H3
R
R 1
C H = C H2
R
R 1
C H = C H2
R
R 1
C H2= C H N H
+
C H3A C D
N
N
[ F e ( C N )5N O ]2 - ( N a+) 2
A l k a l i
[ F e ( C N )5H2O ]3
-F e ( C N )5H2O ]3
-[
+
N F e ( C N )5- - - N3 -D r u g a n a l y t e
c o l o r e d s p e c i e s
( I n n e r m o l e c u l a r c o m p l e x )
N
S
Cl
CH
3O
O
COONa
R
1=
R =
Asian J Pharmaceut Res Health Care Volume 5 Issue2 72-79
TABLE 1: optical characteristics, precision and accuracy of proposed methods
Parameter Method M1 Method M2
max 479 555
Beer’s law limit(µg/ml)
10-30 8-24
Sandell’s sensitivity
(µg/cm2/0.001 abs. unit 0.008888889 0.002895928
Molar absorptivity
(Litre/mole/cm) 51744.7125 158827.5203
Correlation coefficient
Regression equation (Y)*
0.999 0.999
Intercept (a) -0.091 -0.099
Slope(b) 0.016 0.020
%RSD 1.82 1.92
% Range of errors (95% Confidence limits)
0.05 significance level
0.01 significance level 1.91 2.0
Asian J Pharmaceut Res Health Care Volume 5 Issue2 72-79
*Y = a + b x, where Y is the absorbance and x is the concentration of TIA in µg/ml
TABLE 2: Analysis of tianeptine sodium in pharmaceutical formulations by proposed and reference methods.
Method *Formulations Labeled
Amount (mg)
Found by Proposed Methods Found by
Reference Method ± SD
#% Recovery by Proposed Method ± SD
**Amount found ± SD
t F
M1 STABLON
TABLETS
12.5 12.15±
0.30
0.86 3.3 12.03±
0.17
97.22 ± 2.43
M2 STABLON
TABLETS
12.5 12.13 ±
0.35
0.58 4.3 12.03±
0.17
97.07 ± 2.79
* Stablon tablets of Serdia Pharmaceuticals (India) Pvt. Ltd.
**Average ± Standard deviation of six determinations, the t- and f-values refer to comparison of the proposed method with reference method. (UV). Theoretical values at 95% confidence limits t =2.57 and f = 5.05.
# Recovery of 10mg added to the pre-analyzed sample (average of three determinations).
Reference method (UV method) using methanol ( max=220 nm).
CONCLUSIONS
Asian J Pharmaceut Res Health Care Volume 5 Issue2 72-79
ACKNOWLEDGEMENTS
The author is thanks to the University Grants Commission, New Delhi, India for providing financial assistance under Minor Research Project (Ref.no.F.MRP-3981/11).
REFERENCES
1. O’neil M.J., Smith A., Heckelman P.E, Obenchain JR., Gallipeau JAR, D’Arecca MA., “Merck Index” 13 th ed., Merck Co., Inc., 2001, 1679.
2. “European Pharmacopeia”, vol. 2, 5th ed. Strasbourg, Council of Europe, 2005, 2575-2576.
3. Ulu S.T. Determination of tianeptine in tablets by HPLC with fluorescence detection. Journal of AOAC International 2007; 90(3): 720-724.
4. Nicot G, Lachatre G, Gonnet C, Mallon J, Mocaer E. Ion pair extraction and HPLC determination of tianeptine and its metabolites in human plasma, urine and tissues. J. Chromatogr. 1986; 381(1): 115-126.
5. Ulu S.T. Determination of tianeptine in human plasma using HPLC with fluorescence detection. Journal of Chromatography B, 2006; 834(1-2): 62-67.
6. Khedr A. High performance liquid chromatographic stability indicating assay method of tianeptine sodium with simultaneous fluorescence and UV detection. J Chromatogr Sci. 2007; 45(6): 305-310.
7. Gaulier JM, Marquet P, Lacassie E, Desroches R, Lachatre G. RP-HPLC method with UV detection for determination of tianeptine in biological fluids. J. Chromatogr. B, 2000; 748: 407-414.
8. Bulaceanu-Mac-Nair M, Aaron JJ, Prognon P, Mahuuzier G. Photochemically induced fluorimetric detection of tianeptine and some of its metabolites. Application to pharmaceutical preparation. Analyst, 1998; 123: 2267-2270.
9. Dikici E, Deo SK, Daunert S. Spectrofluorometric determination of tianeptine in biological fluids. Anal. Chem. Acta, 2003; 500:237-245.
10. Gazy AA, Mahgoub H, Khamis EF, Youssef RM, El-Sayed MA. Differential pulse, square wave and adsorption stripping Voltammetric quantification of tianeptine in tablets. J. Pharm. Biomed. Anal., 2006; 41(4): 1157-1163.
11. Nicot G, Lachatre G, Gonnet C, Valette JP, Merle L, Nouaille Y, Bromet N.GC method for determination of tianeptine in biological fluids. J. Chromatogr. Biomed. Appl., 1984; 31: 279-290.
12. Badjatya JK, Bodla RB, Prashant Soni, Mradula Sachan, Sumita Shukla. A method for spectrophotometric determination of tianeptine in bulk and capsule dosage form. Asian Journal of Pharmacy and Medical Science 2012; 2(5): 83-85.
13. Ulu ST, Aydogmua Z. A new spectrophotometric method for the determination of tianeptine in tablets using Ion-Pair reagents. Chem. Pharm. Bull. 2008; 56(12): 1635-1638.
14 W Nileeb and M.G Boltz. Mettal (Berlin), 1954, 8, 374.
15 CSN Sarma, C.Kamala sastri and CSP Sastry, Asian J. Chem., 2002, Vol.14 (2), 691-698.