INCREASING OF LIPID PRODUCTIVITY IN MICROALGAE
CULTURES VIA DYNAMIC ANALYSIS AND CLOSED-LOOP
OPERATION
P. A. López Pérez,
[a]*V. Peña Caballero,
[b]B. Ruiz Camacho
[c]and R.
Aguilar López
[d]**Keywords: Biodiesel; nonlinear controller; bifurcation analysis; heterotrophic culture.
Good process control has often been criticized for the economic viability of large-scale production of several commercial products. In this work, the production of biodiesel from microalgae is investigated. Successful implementation of a model-based control strategy requires the identification of a model that properly captures the biochemical dynamics of microalgae, yet is simple enough to allow its implementation for controller design. This paper explores the biodiesel production in a class of continuous culture under heterotrophic conditions via closed-loop operation. A mathematical model adapted from Surisetty et al. (2010) that describe the growth of microalgae in a heterotrophic culture is studied via dynamic analysis. This model is extended to the continuous operation where bifurcation analysis was carried out for the determinate the qualitative model behavior and to analyze feasible operating conditions. This project is focused on the on the use of a mixture of two substrates that are continuously fed into the reactor chamber, and the continuous fermentation process is described by an unstructured mathematical model with a product inhibition on cell growth. In addition, we present the design of a nonlinear control law contains a class of bounded type feedback of the named control error in order to regulate the substrate concentration at maximum value to lead the lipids-diesel concentration indirectly. Lipid productivity in continuous culture was 0.276 g L-1 d-1 via a closed loop (increase of
31.5 %) over that of the continuous mode in open loop. Finally, numerical experiments proved the satisfactory performance of the proposed methodology in comparison with a linear PI controller.
*Corresponding Author
Telephone: (52-771) 71-720-00 (P. A. Lopez-Perez), +55 01 4747 3800 (R. Aguilar-Lopez)
E-Mail: [email protected] (P. A. Lopez-Perez), [email protected] (R. Aguilar-Lopez)
[a] Escuela Superior de Apan, Universidad Autónoma del Estado de Hidalgo, Carretera Apan-Calpulalpan, Km.8., Chimalpa Tlalayote s/n, 43900, Colonia Chimalpa, Apan, Hgo. México [b] Departamento de Ingeniería Agroindustrial, División de
Ciencias de la Salud e Ingenierías. Campus Celaya-Salvatierra, Universidad de Guanajuato, Ave. Ing. Barros Sierra No. 201, 38140, Guanajuato, México
[c] Universidad de Guanajuato, División de Ciencias Naturales y Exactas, noria alta s/n, Col. Noria alta,Guanajuato,
Guanajuato México
[d] Departamento de Biotecnología y Bioingeniería,
CINVESTAV-IPN, Av. Instituto Politécnico Nacional, No. 2508, San Pedro Zacatenco, D.F. México, C.P. 07360.
Introduction
Biodiesel fuels are relatively new alternatives and environmentally sustainable sources comparing to traditional fossil fuels due to reducing greenhouse gas emission. Biodiesels are made from renewable biological sources such as vegetable oils, animal fats, and microalgal cultures and are prepared from lipid type acylglycerols by transesterification with short chain alcohols.1,2
Microalgae have recently received more and more attention in the frameworks of CO2 fixation and renewable
energy. Microalgae culture begins to emerge as a better option to obtain biodiesel since could accumulate much higher oil content than those of agricultural oleaginous crops. They do not require the use of crop area, can be grown in
deserts or intensively in bioreactors; moreover, some cultures require only water (less than land crops for irrigation) and atmospheric CO2 coupled with sunlight.
Indeed, microalgae appear as a strong candidate to satisfy the existing demand for fuel, in addition, some investigations about the employed microalgae for wastewater treatment coupled with biodiesel production are carried out.3
Many research groups have attempted to produce biodiesel using different reactor types. It was observed in microalgae cultures that nitrogen starvation increases the cell lipid content but at the same time strongly reduces the growth rate nitrogen-limited continuous cultures.4 Raceway
ponds can typically achieve 0.5 - 1.0 g L-1 dry cell weight
while tubular photobioreactors will reach a maximum of 4 g L-1 value.5 High cell density cultures are usually those with
dry cell weight values from 10 g L-1 up to more than 100 g
L-1, 6,7 however, for microalgae, in recent literature, the term
has been used for microalgae concentrations as high as 20 g L-1.8
The simplest model for describing the growth of a microalgae culture limited by nitrogen is the Droop model.9
This model assumes that the growth rate depends on the intracellular concentration of nitrogen. More precise models have been development including the nitrogen and carbon assimilation interactions as well.10 Two forms of the models
developed to explore the key variables of the biological process system, the bifurcation and sensitivity analyses, allow the improvement of photobioreactor lipid productivity through the study of the different culture operation conditions and the effect of parameters state values.11 The
bioreactor productivity performance is hard due to perturbations cause low productivity or in severe cases the collapse of the reactor,12 but it is desirable to control the
processes due to high variability.
The use of advanced process control (APC) strategies became common practice to extract the economic potential of the processes,13 and over the maximizing of products
yield as the primary objective, it is clear that these projects also improve the process safety and operational continuity as well.14 Only several studies have been published for
controlling biodiesel production,15 therefore, we have been
studied a dynamical model to predict the neutral lipid concentration changes and proposed a kinetic model extended for continuous operation to analyze the bifurcation properties considering nitrogen stress.
Materials and Methods
Bioreactor model development
The most widespread model to reproduce growth of microalgae under substrate limitation is the so-called Droop model.14,15 It is widely used since it reproduces the ability
of microalgae to uncouple substrate absorption and growth. Its simple structure made it possible to study and mathematically characterize its behavior.16
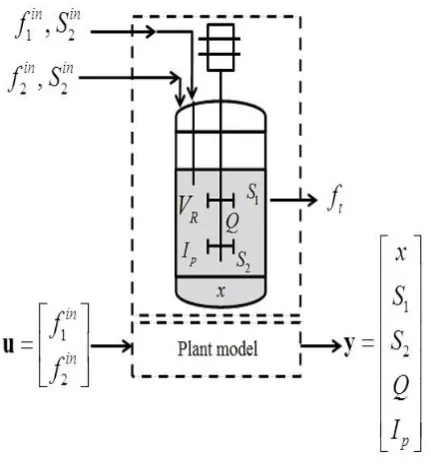
The biodiesel production in the continuous process is described in Fig. 1.
Figure 1. Biodiesel production model for a microalgae culture
Our model developed on the basis of experiments carried out in various nitrogen conditions can predict the neutral lipid production under nitrogen stress and carbon assimilation. For the mathematical expression of the specific growth rate, the Droop model was chosen.13
Biomass (x) concentration mass balance:
(1)
where
x -functionally active biomass concentration (g mL-1)
ft -nitrogen and carbon mix feed (mL h-1) (where
in in
t 1 2
f f f
f1in -nitrogen-rich feed (mL h-1)
f2in -carbon-rich feed (mL h-1)
1- specific velocity of biomass growth
vR- total reaction volume (mL)
Nitrogen source (S1) concentration mass balance:
(2)
where
2- specific velocity of nitrogen consumption
S1in -nitrogen source feed (mL h-1)
Carbon source (S2) concentration mass balance:
(3)
where
3- specific velocity of microalgae oil production
Yx/S-biomass to substrate yield
Yp/S-product to substrate yield
S2in -carbon source feed (mL h-1)
km-Half saturation constant for oil production (g mL-1)
Total nitrogen source (Q) concentration mass balance:
(4)
where
Yq/x-biomass to substrate quota yield
t
1
R
f
d
x
x
x
dt
v
1in in t
1 2 1 1
R R
f
f
d
S
x
S
S
dt
v
v
q x
t
2 1
R
1
f
d
Q
x
x
Q
dt
Y
v
x S
p S in
in 2
2 1 2
R
t
2 m 3
R
1
1
f
d
S
x
S
dt
Y
v
f
S
k x
x
v
Y
Total algal oil stored in cells (Ip) concentration mass
balance:
(5)
where
Ip- total algal oil stored in cells (g mL-1)
The specific velocities of biomass growth (1), nitrogen
consumption (2) and microalgae oil production (3) can be
expressed as:
(6)
(7)
(8)
where:
S0: - Threshold substrate concentration (g mL-1)
q- nitrogen quota (g g-1)
qm-minimum cell quota (g g-1)
KS-half saturation constant of carbon source for
growth(g mL-1)
Kq-Half saturation constant of nitrogen quota for
growth(g mL-1)
KHalf saturation constant for oil production (g mL-1)
m-Maximum growth rate (h-1)
m-Maximum uptake rate (h-1)
m-Maximum oil production rate (h-1)
Bifurcation theory
The objective of Bifurcation analysis is to characterize changes in the behavior of a mathematical model defined by ODE´s and/or PDE´s by varying key parameters. In the case of bioreactor operation, this key parameter is the dilution rate. Many important features are hard to find with simple simulations such as limitations and optimal operating conditions to avoid hazardous conditions are covered through this analysis.13
The bifurcation occurs when one of the eigenvalues is close to the axis of imaginary numbers in the complex plane. The simplest bifurcations are associated when one of the eigenvalues takes the value zero (Fold bifurcation) as is the case of the branching point (BP) and limit point (LP) or
when a pair of conjugate eigenvalues cross the imaginary axis (Hopf bifurcation, H). The Fold bifurcations are usual causes of multiplicity of steady states and hysteresis. Hopf bifurcations are responsible for the appearance and disappearance of periodic solutions.14
Since bioreactors are not free of perturbations, it is important to have information about the response of fermentor toward disturbances to prevent the collapse of the bioprocess. The bifurcation diagrams were obtained using the package Matcont 4.2 for MATLAB v7.0. This software can accomplish both steady state and dynamic bifurcation analyses including the determination of entire periodic solution branches using continuation techniques.
Proposed Control Law
Our main objective is to achieve the desired level of lipid production by microalgae in a variable system in spite of perturbations in the carbon source concentration (e.g. S0).
The feedback control starts with the measurement of the carbon source and comparing it with its desired value (set point value). The difference between the two values, the so-called tracking error (e(t) ), is used in the control algorithm. This controller changes the control input, i.e. in our case the value of carbon-rich feed f2in(t) which reduces the value of
the tracking error. The relation between e(t) and the control input f2in(t) in this work is given by the following controller:
(9)
where
g0 - is the control gain, ,
S
2,sp=
sp is the carbon concentration at set pointconditions (g mL-1).
u- is control action
u0- nominal value of the input control (mL h-1)
-carbon source concentration
Results and Discussions
The bifurcation analysis was carried out for f1 and f2
(parameters) as it can be seen in the (Fig. 2a and 2b). Fig. 2a shows that the equilibrium branch forms a cycle, a singular dynamic behavior of the continuous bioreactor. It cannot predict the carbon feed flow where the bioreactor collapse (microalgae oil production zero) noted as BP, it is a failure of the model. The analysis also reveals two equilibrium points for the same feed flow of carbon (multiplicity of steady states), one of those identified as the stable node (solid line) or stable oscillations (round markers) and the unstable node (dashed line).
It is noteworthy that the stability of the equilibrium points was calculated by obtaining the numerical eigenvalues. In order to avoid an unstable node that may lead us to wash out
tp 3 p
R
f
d
I
x
I
dt
v
m 2
1 m
q s 2
q
q
S
K
q
K
S
1 0
2 m
1
1
S
S
p
2
1
m
3
2
I
S
x
K
S
0 0 2
1
1
u
u
g
e
sp
the bioreactor, a high concentration of inoculated biomass is required together with absence of disturbances, which is very difficult to achieve due to the nature of the system. Increasing the carbon feed flow increases the lipid production as it was expected. Adjusting the feed nitrogen flow set to 3 mL h-1, the maximum microalgae oil concentration reached was about 0.02 g mL-1 at a carbon
feed flow of 4.2 mL h-1.
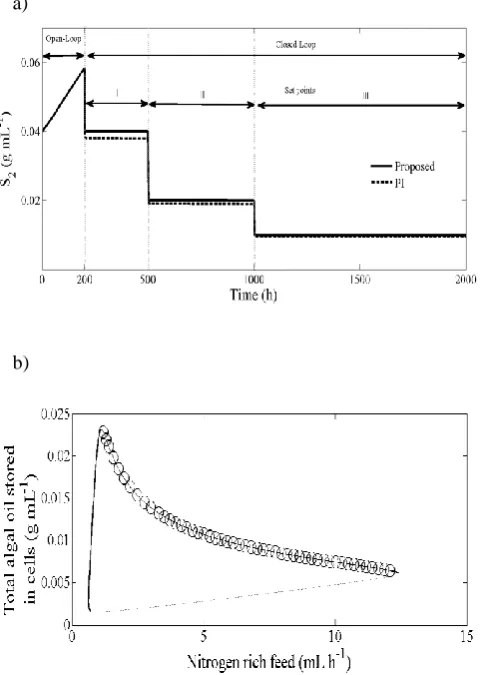
Figure 2b shows the dynamics of the model by varying the nitrogen feed flow, where the equilibrium branch also forms a cycle, with the same disadvantages mentioned above. We note that it shows multiple steady states with stable and unstable equilibrium points in the same way as in Fig. 2a but with the difference that lipid production is greater at low nitrogen feed concentrations, due to the well-known fact that under nitrogen limitation, the microalgae produce more lipids. Thus, under a carbon feed flow constant (3 mL h-1) the maximum production of microalgae oil is 0.023 mL h-1 at a feed flow of nitrogen of 1.6 mL h-1
a)
b)
Figure 2. Bifurcation diagram for nitrogen input= 3 mL h-1 with
carbon feed as the bifurcation parameter (a) and for carbon input= 3 mL h-1 with nitrogen feed as the bifurcation parameter (b), ________stable steady state branch, --- unstable steady state branch,
-o-o-o- stable oscillation branch
The system operation conditions were fixed by the following set of values: x0=0.003 g mL-1, S1,0=0.0005 g mL-1,
S2,0=0.04 g mL-1, Q0=0.000025 g mL-1, IP,0=0.003 g mL-1,
S0=[0]T, f1in=1.6 ml h-1, f2in=3 ml h-1 (i.e. without control),
u(t)=f2in (i.e. with control), V0=200 mL, um=0.3241 h-1,
qm=0.000167 g L-1, Kq=0.250 g L-1, rm=0.012191 h-1,
KS=0.00010 g L-1, , S0=0.0000074 g L-1, km=0.013851 h-1,
m=0.01640 h-1, K=0.001792 g L-1, =0.50, 1/YXS=1.50,
1/YpS=2.2802, 1/YXq=0.7370, k=0.1313, g0=0.5 and f20=3 ml
h-1.
Based on the bifurcation analysis phase portrait it was found that the maximum algal oil concentration could be reached at a constant carbon feed flow of 3 mL h-1. The
bioreactor operation was simulated at zero time in an open-loop regime for 200 h, after 200 h the controllers are turned on. For comparison purposes, the proposed controller and a linear PI were employed. For the linear PI controller, the corresponding proportional gain was kp= 1, and the integral
gain was given by kp/τI=0.5 (i=2); whereas the controller
gain for the proposed controller was g0=1.5. The PI
controller was tuned by Internal Model Control (IMC) guidelines,36 the corresponding tuning is done via a step
disturbance of 5 % in the nominal value of the control input. The proposed controller acts immediately, leading the carbon source trajectory to the corresponding set points (S2=0.04, S2=0.02, S2=0.021) (Fig. 3a).
Fig. 3b shows the corresponding control answers, where a sudden change at the set-point was observed at 200 h of the closed-loop regime. The control is much smoother, and a satisfactory performance can be expected; moreover, the control answer of the PI controller is not as satisfactory.
a)
b)
Figure 4. Closed-loop phase portrait.
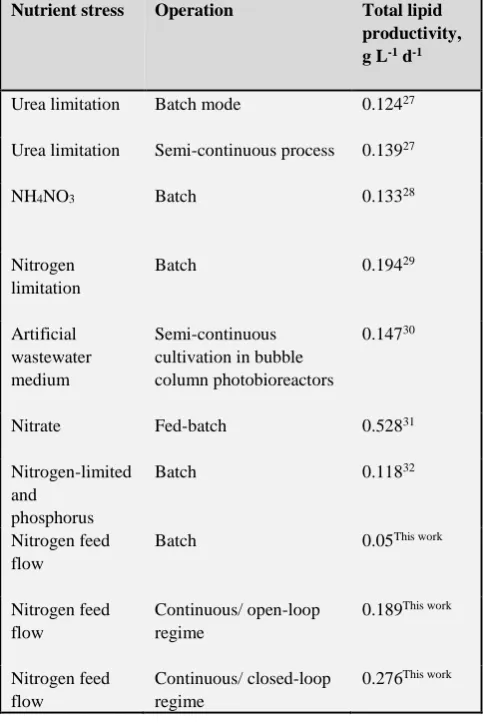
Table 1. Summary of total lipid productivity reported in the literature.
Nutrient stress Operation Total lipid productivity, g L-1 d-1
Urea limitation Batch mode 0.12427
Urea limitation Semi-continuous process 0.13927
NH4NO3 Batch 0.13328
Nitrogen limitation
Batch 0.19429
Artificial wastewater medium
Semi-continuous cultivation in bubble column photobioreactors
0.14730
Nitrate Fed-batch 0.52831
Nitrogen-limited and
phosphorus
Batch 0.11832
Nitrogen feed flow
Batch 0.05This work
Nitrogen feed flow
Continuous/ open-loop regime
0.189This work
Nitrogen feed flow
Continuous/ closed-loop regime
0.276This work
The maximum values of total lipid productivity are higher than most of the reported in the literature (Table 1), and the trend in increasing lipid productivity under nitrogen limitation confirms the trends observed previously.33-35 Lipid
productivity in continuous culture was 0.276 g L-1 d-1 via a
closed loop (increase of 31.5 %) over that of the continuous mode in open loop and 81.1 % in batch mode (Fig. 4). Fig. 4 is a 3D phase-portrait, including nitrogen source (S1), carbon
source (S2) and total algal oil stored in cells (Ip) trajectories.
The result clearly indicates that the continuous process with the strategy of the carbon source kept at 0.01 g mL-1 can
effectively produce microalgal lipids.
Conclusions
A bifurcation analysis of continuous microalgae model for biodiesel production was performed which revealed the multiplicity of steady states with stable and unstable fixed points moreover a strong fault in the prediction of the bioreactor washed conditions. We have shown that the proposed controller can provide adequate performance for regulation and tracking purposes for carbon source besides a higher production of total algal oil stored (lipid productivity) in cells comparing it with the uncontrolled processes.
Acknowledgment
The author P. A. L. P. gratefully acknowledged the financial support to PRODEP (F-PROMEP-38/Rev-03; SEP-23-005).
References
1Ma, F., Hanna, M., Bioresour. Technol. 1999, 70, 1-15.
http://dx.doi.org/10.1016/S0960-8524(99)00025-5
2Sharma, Y. C., Singh, B., Upadhyay, S., Fuel. 2008, 87,
2355-2373. http://dx.doi.org/10.1016/j.fuel.2008.01.014
3Surisetty, K., Siegler, H. D. l. H., McCaffrey, W.C., Ben-Zvi, A.,
Chem. Eng. Sci., 2010, 65, 5402–5410.
http://doi.org/10.1016/j.ces.2010.04.024
4Tabernero, A., del Valle., E., M. M., Galan, M. A., Biochem. Eng.
J.,2012, 63, 104-115.
http://dx.doi.org/10.1016/j.bej.2011.11.006
5Shojaosadati, S. A., Seyedeh, M. V. K., Valiollah, B., Farnoud, A.
M., Iran J Biotech., 2008, 6(2) 63-84. https://www.researchgate.net/publication/242776458
6Bumbak, F., Cook, S., Zachleder, V., Hauser, S., Kovar, K., Appl.
Microbiol. Biotechnol., 2011, 91, 31-46. DOI: 10.1007/s00253-011-3311-6.
7Renato, S., Vidotti, C. A. D. S., Reis, E. M., Franco, T. T., Chem
Eng Trans., 2014,38, 313-317. DOI: 10.1002/bit.20417
8Droop, M. R., J. Mar. Biol.Assoc. U. K.,2009, 48, 689-733. DOI:
https://doi.org/10.1017/S0025315400019238
9Malcata, X. F., Trends Biotechnol. 2011, 29, 542-549.
http://dx.doi.org/10.1016/j.tibtech.2011.05.005
10 Quinn, J., De Winter, L., Bradley, T., Bioresour. Technol., 2011,
102, 5083-5092.
http://dx.doi.org/10.1016/j.biortech.2011.01.019
11Chisti, Y., Biotechnol. Adv., 2007, 25, 294-306.
DOI:10.1016/j.biotechadv.2007.02.001
12Christenson, L., Sims, R., Biotechnol. Adv.,2011, 29, 686-702.
http://dx.doi.org/10.1016/j.biotechadv.2011.05.015
13Plšek, S., Vašek, V., Int. J. Circ. Sys. Sig. Process., 2012, 5(6),
342-349.
http://www.naun.org/main/NAUN/circuitssystemssignal/16-570.pdf
14Bourrel, S., Dochain, D., Babary, J. P., Queinnec, I., J. Process
Control., 2000, 10, 73-91. http://dx.doi.org/10.1016/S0959-1524(99)00015-3
15Garhyan, P., Elnashaie, S. S. H. E., Al-Haddad, S. M. M.,
16Namjoshi, A., Kienle, A., Ramkrishna, D., Chem. Eng. Sci.,2003,
58, 793-800.
http://dx.doi.org/10.1016/S0009-2509(02)00609-7
17MATLAB: http://www.mathworks.com/
18Saltelli, A., Ratto, M., Andres, T., Campolongo, F., Cariboni, J.,
Gatelli, D., The primer. 1st. ed. Wiley-Interscience; 2008. DOI: 10.1002/9780470725184
19Ingalls, B., Essays Biochem., 2008, 45, 177-193. DOI:
10.1042/BSE0450177
20Bentele, M., Lavrik, I., Ulrich, M., Stösser, S., Heermann, D. W.,
Kalthoff, H., J. Cell Biol., 2004, 166, 839-851. DOI: 10.1083/jcb.200404158
21Raue, A., Kreutz, C., Maiwald, T., Klingmuller, U., Timmer, J.,
IET Syst. Biol., 2011, 5, 120-130. DOI: 10.1049/iet-syb.2010.0061
22Rabitz, H., Kramer, M., Dacol, D., Ann. Rev. Phys. Chem.,1983,
34, 419-461. DOI: 10.1146/annurev.pc.34.100183.002223
23Khalil, H. K., Advanced Topics in Control Systems Theory, 1st ed.
Macmillan Publishing Co. New York; 1992.
https://books.google.com.mx/books?isbn=1846283132
24López-Pérez, P. A., Maya-Yescas, R., Peña-Caballero, V.,
Gomez-Acata, R. V., Aguilar-López, R., Fuel, 2013, 110, 219–226. http://dx.doi.org/10.1016/j.fuel.2012.11.020
25Ogunnaike, B. A., Ray, W. H., Process dynamics, modelling, and
control. edited by Oxford University Press New York, 1994. DOI: 10.1002/aic.690440523
26Marjanovic, V., Stamenkovic O. S., Todorovic, Z. B., Lazic M.
L., Veljkovic, V. B., Fuel, 2010. 89(3), 665-671.
http://dx.doi.org/10.1016/j.fuel.2009.09.025
27Hsieh, C.-H., Wu, W.-T., Bioresour. Technol., 2009, 100, 3921–
3926. http://dx.doi.org/10.1016/j.biortech.2009.03.019
28Li, Y., Horsman, M., Wang, B., Wu, N., Lan, C., Appl. Microbiol.
Biotechnol., 2008, 81, 629–636. DOI: 10.1007/s00253-008-1681-1
29 Robles-Heredia, J.C., Sacramento-Rivero, J.C., Canedo-López Y.
Ruiz-Marín, A., Vilchiz-Bravo, L. E., Braz. J. Chem. Eng., 2015, 32, 335 - 345. http://dx.doi.org/10.1590/0104-6632.20150322s00003304
30 Feng, Y., Li, C., Zhang, D., Bioresource Technol., 2011, 102,
101-105. http://dx.doi.org/10.1016/j.biortech.2010.06.016
31 Morales-Sánchez, D., Tinoco-Valencia, R., Kyndt, J., Martinez,
A., Biotechn. Biofuels, 2013, 6, 1-12. DOI: 10.1186/1754-6834-6-100
32Belotti, G., Bravi, M., Caprariis, B. Filippis, P., Scarsella M., Am
J. Plant Sci., 2013, 4-12B, 44-51. DOI: 10.4236/ajps.2013.412A2006
33Widjaja, A., Chien, C., Ju, Y., J Taiwan Inst. Chem. Eng., 2009
40, 13-20. http://dx.doi.org/10.1016/j.jtice.2008.07.007
34Griffiths, M. J., Hille, R. P., Harrison, S. T. L., J. Appl. Phycol.
2011, 24(5), 989–1001. DOI: 10.1007/s10811-011-9723-y
35 Robles-Heredia J. C., Sacramento-Rivero, J. C., Canedo-López,
Y., Ruiz-Marín, A., Vilchiz-Bravo, L. E. A., Braz. J. Chem. Eng., 2015, 32(2), 335–345. dx.doi.org/10.1590/0104-6632.20150322s00003304
36 Rivera, D. E., Skogestad, S. Morari. M., Ind. Eng. Chem. Proc.
Des. Dev,. 1986, 25, 252–265.
https://asu.pure.elsevier.com/en/publications/internal-model-control-4-pid-controller-design