ISSN: 2339-076X (p); 2502-2458 (e)
,
Volume 4, Number 4 (July 2017): 853-861
DOI:10.15243/jdmlm.2017.044.853
Research Article
Water and sediment yields from two catchments with different land
cover areas
Tyas Mutiara Basuki*
Watershed Management Technology Center, Jl. A. Yani- PO BOX 295, Pabelan, Surakarta, Indonesia
* tmbasuki@yahoo.com
Received 28 April 2017, Accepted 23 May 2017
Abstract :
Land cover and human activities affect water yield and soil erosion-sedimentation in a catchment. Therefore, a study to obtain information of water and sediment yields from two catchments covered by different land cover areas has been conducted in Tanjung and Bakar catchments. The catchments are located in Tanah Laut Regency, South Kalimantan Province. The area of secondary forest inTanjung and Bakar catchments are 31 and 10%. The water yield was obtained by measuring Stream Water Level (SWL) and converted the data into stream water discharge using a stream water discharge rating curve. Sediment samples were taken for every increament of SWL. The sediment concentration in water samples were converted to sediment discharge (kg/second) using a sediment discharge rating curve. The results showed that water and sediment yields in 2016 of Tanjung cacthment were higher than Bakar catchment. The water and sediment yields of Tanjung were 2994 mm and 15.7 t/ha. Bakar catchment produces water yield 2750 mm and sediment yield 7.4 t/ha. Based on the study, it shows that the suspended sediment in stream water is not only affected by the percentage of forest cover, but it is also influenced by the activities within the catchment such as traditional mining.Keywords: forest area, sediment yield, water yield
To cite this article:Basuki, T.M.2017.Water and sediment yields from two catchments with different land cover areas. J. Degrade. Min. Land Manage. 4(4): 853-861, DOI: 10.15243/jdmlm.2017.044.853.
Introduction
Land cover has an essential role in the global water balance or water cycle (Beck et al. 2013; Sterling et al. 2013; Liu et al. 2015) and soil erosion– sedimentation (Feng et al. 2010; Defersha and Melesse 2012). Different forest cover areas lead to different soil-water response relationships of a catchment. Generally, high percentage of forest cover area in a watershed or catchment will produce a stable hydrological condition in term of quantity, quality, and continuity. However, high population growth accompanied by rapid economic and infrastructure developments have caused the increase in the need of land. Consequently, land cover or land use conversion cannot be avoided. In that case, forest degradation or deforestation due to land cover conversion from forest to minings, agricultural areas, mono species of
estates, and settlements will alter the natural condition of a catchment. Those problems are commonly faced by tropical developing countries (Aksoy and Kavvaz, 2005). These situations are also found in Indonesia, such as in Kalimantan which is one of the big islands in Indonesia.
et al. 2013). Further impact of the antropogenic activities is not only alter water yield, but the activities also change landform through erosion and sedimentation processes in a watershed or a catchment (Cai et al. 2012; Zhou et al. 2015). According to (Baker and Miller, 2013), this hydrological shifting is caused by the differences in the rate of evapotranspiration, interception, infiltration, ground water recharge as well as surface runoff in relation to soil erosion.
Regarding to the impacts of land cover changes on water and soil erosion-sediment yields, most of the previous studies were conducted by hydrological modelling (Notebaert et al. 2011; De Girolamo and Lo Porto 2012; Isik et al. 2013; Wang et al. 2014; Awotwi et al. 2015). In addition, most of those studies focussed only on the impact of clear cutting in forest harvesting on water yield and soil erosion-sedimentation. Based on review literatures, it is hard to find a scientific published paper about the effect of land cover on water and sediment yields in natural forest in Indonesia. In our study, we
have conducted direct measurement of water and sediment yields using catchments approach. The selection of the catchments was based on the similarity of the catchment morphometries, but with different land cover areas, especially forest areas. The purpose of the resaerch is to study the effect of land cover areas on water and sediment yields.
Materials and Methods
Description of the study area
Two catchments with different secondary forest covers were choosen as the study sites. The first was Tanjung catchment with an area of 31.9 km2 and 30% of the areas was secondary forest. The second catchment was Bakar catchment with its area was 18.4 km2 which consisted of 10% secondary forest areas. The form of these two catchments was circular. The study areas were located in Tanah Laut Regency, South Kalimantan Province. Figure 1 shows the location of the study areas.
Figure 1. Situation map of the study areas. Source: BPKH Banjarbaru
Data collection
The map of land cover classification was obtained from Balai Pemangkuan Kawasan Hutan (BPKH) of South Kalimantan Regency in Banjarbaru. This land cover map was derived from Landsat 7
ombrometer or conventional rain gauge for every rainy day at 7.00 am. The first rainfall gauge was installed in the Tanjung catchment and the second one was located near the outlet of the Bakar catchment. Stream water level was monitored in each outlet of the catchments using a tide-gauge three times a day at 7.00 am, 12.00 am, and 17.00 pm. Water samples for suspended sediment analysis was taken when there is an increase in stream water level. The water samples were analyzed in laboratory to measure sediment concentration.
Data analysis
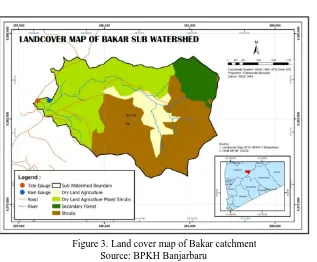
Using Arcmap software, the land cover map was cropped according to boundaries of Tanjung and Bakar catchmens. Afterwards, the areas of each cover type was calculated. The land cover map of Tanjung and Bakar catchment are presented in Figure 2 and 3. The image of DEM SRTM was used to derived slope steepnes. The water samples were analyzed in a laboratory to obtain concentration of suspended sediment.
Figure 2. Land cover map of Tanjung catchment Source: BPKH Banjarbaru
Data of stream water level from the three time measurements a day were averaged and were converted into stream water discharge using the equations below. In this paper, water yield is expressed as stream water discharge.
Tanjung catchment:
Q = 4,3H^2,47...(1)
Note :
Q = Water discharge (m3/second)
H = The average of stream water level (m)
Bakar catchment:
Q = 3.693H^1,78...(2)
Note:
Q = Water discharge (m3/second)
H = The average of stream water level (m)
For comparison of water yield between the two catchments, the stream water discharge in m3/second was converted into mm by dividing the Q with the area of each catchment.
To obtain the amount of suspended sediment, a sediment rating curve was develop based on a regression equation between sediment concentration for every stream water level and discharge at the coresponding stream water level. The regression for each catchment is as follow,
Tanjung catchment:
Qs = 0,505Q^1,021...(3)
Note:
Qs = Sediment discharge (kg/second) Q = Water discharge (m3/second)
Bakar catchment:
Qs =0,257Q^1,242...(4)
Note:
Qs = Sediment discharge (kg/second) Q = Water discharge (m3/second)
For comparison of water yield between the two catchments, the sediment discharge in kg/second was converted into ton/ha by dividing the Qs with the area of each catchment.
Results and Discussion
Land cover and slope steepness of the catchments
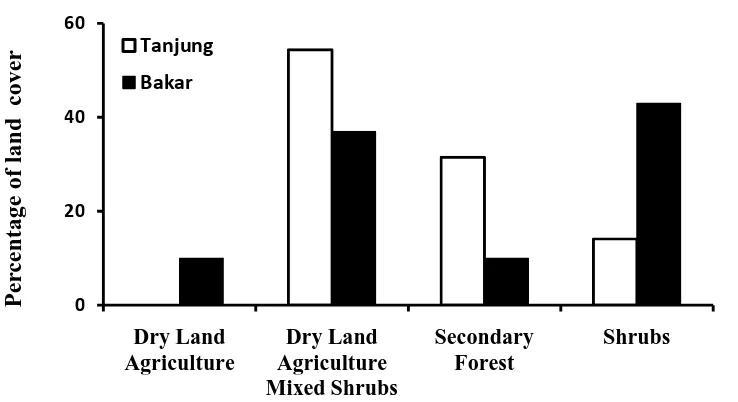
Based on the analysis, it shows that Tanjung catchment has 3 types of land cover, while Bakar catchment has 4 types of land cover. As illustrated in Figure 4, the area of secondary forest is wider in Tanjung (31%) than in Bakar catchment (10%). Slope steepness was divided into five classess and the result is provided in Table 1. The flat, undulating, and very steep slope classess are similar between Tanjung and Bakar catchments. However, for 8-15% slope steepness, Tanjung catchment has double perecentage area than Bakar catchment, conversely at 25-45% gradient, Bakar catchment has wider area than Tanjung catchment.
Figure 4. The percentage of land cover at each catchment
Table 1. Slope classes of the study areas Slope classes Tanjung catchment Bakar catchment (%) Area (ha) % Area (ha) %
0 - 8 1036.9 32.5 590.2 32.1
8 - 15 557.6 17.5 157 8.5
15-25 503.6 15.8 270.8 14.7
25 - 45 746.9 23.4 573.6 31.2
>45 344.6 10.8 249.2 13.5
Total 3189.6 100 1840.8 100
Rainfall and stream water discharge
Mean monthly rainfall in 2016 of Bakar catchment was higher than Tanjung catchment which were 338 and 264 mm/month. The highest monthly rainfall for the both catchments occurs in December. The total amount of rainfall in 2016 for Bakar catchment was 4052 mm and for Tanjung catchment was 2971 mm. The comparison of the monthly rainfall is graphed in Figure 5.
Rainfall is the input for a water balance system in a catchment and the output is the water yield or the stream water discharge. The relationship between monthly rainfall and monthly discharge are presented in Figures 6 and 7 for Tanjung and Bakar catchments, respectively. The coefficient of determination between monthly rainfall and mean monthly discharge is higher in Bakar (0.60) than in Tanjung (0.54). The scatter plot of Tanjung and bakar catchments are illustrated in Figures 6 and 7. Although monthly rainfall at Bakar catchment was higher than in
Tanjung catchment, mean monthly water yield in Bakar cacthment was not always higher than in Tanjung catchment as shown in Figure 8. During March to June and in December the stream water discharge in Tanjung catchment was higher than in Bakar catchment, for the rest of the months the stream water discharge was higher in Bakar catchment. Based on Paired T-test between monthly stream water discharge of Tanjung and Bakar catchments, it reveals that statistically there is no significant differences between monthly stream discharge between Tanjung and Bakar catchments. At 95% confidence interval, the p value is 0.54 In total, the stream water discharge of Tanjung catchment in 2016 was 2994 mm and Bakar catchment was 2750 mm.
The higher annual water yield in Tanjung catchment could be caused by wider size of Tanjung catchment as compared to Bakar. The area of Tanjung catchment (31.9 km2) is almost double compared to Bakar catchment (18.4 km2). This finding is in line with a research finding conducted by Basuki et al. (2017) in teak catchments. Basuki et al. (2017) found that annual water yield from teak catchment with area 13.5 km2 was higher than that from teak cacthment with area of 3.4 km2. In addition, Gallo et al. (2015) found that the size of catchment has more influence on water yield than land cover and rainfall in their research using 78 catchments with various sizes from small (0.1 ha) to very large (>10,000 km2). However, according to Blöschl et al. (2007), hydrologycal response of a small catchment is more affected by land cover condition and for a large cacthment or watershed, it is more influenced by climate.
Figure 6. Scatter plot of monthly rainfall vs mean monthly stream water discharge at Tanjung catchment
Figure 7. Scatter plot of monthly rainfall vs mean monthly stream water discharge at Bakar catchment
Sediment of the studied catchments
The relationship between rainfall and suspended sediment of the catchments are presented in Figures 9 and 10. The coeficient of determination between rainfall and sediment for Tanjung catchment is lower than Bakar catchment.
However, the slope of the equation is higher for Tanjung catchment, it means that the equation for Tanjung catchment is more sensitive than Bakar catchment. In other words, the increase in rainfall will cause higher increase in sediment at Tanjung catchment than in Bakar catchment.
Figure 9. Scatter plot of monthly rainfall vs monthly sediment discharge of Tanjung catchment
Figure 10. Scatter plot of monthly rainfall vs sediment discharge of Bakar catchment
To compare sediment between the catchments, the unit of sediment (kg/second) was converted into ton/ha by dividing the area of each catchment. The comparison of sediment between the two catchments is shown in Figure 11. This figure shows that alhtough Bakar catchment had higher rainfall and lower forest cover area than Tanjung cacthment, however its sediment yield was lower than Tanjung catchment. In 2016, the total sediment yield from Tanjung catchments was 15.7
Figure 11. The comparison of rainfall and sediment between Tanjung and Bakar catcmenths
The other possible reason for low sediment concentration in Bakar catchment is the high shrub cover. Although Bakar catchment has low forest cover (10%), however, it is dominated by shrub which occupies 43% of its area. In this regards, shrub also has a role to protect soil from mechanic energy of raindrops and prevent dispersion of soil agregate. Therefore less soil erosion and sediment concentration in the river. A research conducted in Loess Plateau in China has concluded that the best soil protection from erosion has been found under forest, shrub, and dense grass covers (Sun et al., 2014).
Conclusion
Total water and sediment yields in 2016 from Tanjung catchment with 32% secondary forest area were higher than from Bakar cacthment covered by 10% secondary forest. Sediment yield of a catchment is not only affected by the percentage of forest cover area, but it is also influenced by other land uses or activities such as mining in the catchment. Furher studies related to water yield from catchments with various forest cover areas will be useful to determine the optimal percentage of forest cover areas to produce an optimal water yield.
Acknowledgements
I would like to appreciate and thanks to the reviewers for their constructive comments. This research is funded by Watershed Managemnet Technology Center.
References
Aksoy, H. and Kavvas, M.L. 2005. A review of hillslope and watershed scale erosion and sediment transport models.Catena64(2-3): 247-271. Awotwi, A., Yeboah, F. and Kumi, M. 2015. Assessing
the impact of land cover changes on water balance components of White Volta Basin in West Africa. Water and Environment Journal29(2): 259-267. Baker, T.J. and Miller, S.N. 2013. Using the Soil and
Water Assessment Tool (SWAT) to assess land use impact on water resources in an East African watershed.Journal of Hydrology486:100-111. Basuki, T.M., Adi, R.N., and Sulasmiko, E. 2017. Hasil
air hutan jati dari dua sub daerah aliran sungai dengan luas berbeda.Jurnal Penelitian Pengelolaan Daerah Aliran Sungai1(1): 1-14.
Beck, H.E., Bruijnzeel, L.A., van Dijk, A.I.J.M., McVicar, T.R., Scatena, F.N. and J. Schellekens, J.2013. The impact of forest regeneration on streamflow in 12 mesoscale humid tropical catchments.Hydrology and Earth System Sciences 17(7): 2613-2635.
Blöschl, G., Ardoin-Bardin, S., Bonell, M., Dorninger, M., Goodrich, D., Gutknecht, D., Matamoros, D., Merz, B., Shand, P. and Szolgay, J. 2007. At what scales do climate variability and land cover change impact on flooding and low flows? Hydrological Processes21(9): 1241-1247.
Cai, T., Li, Q., Yu, M., Lu, G., Cheng, L. and Wei, X. 2012. Investigation into the impacts of land-use change on sediment yield characteristics in the upper Huaihe River basin, China. Physics and Chemistry of the Earth,Parts AB/C53-54: 1-9. Defersha, M.B. and Melesse, A.M. 2012. Field-scale
Feng, X.M., Wang, Y., Chen L. and Bai, G. 2010. Modeling soil erosion and its response to land-use change in hilly catchments of the Chinese Loess Plateau.Geomorphology118(3-4): 239-248. Gallo, E.L. Meixner, T., Aoubid, H., Lohse, K.A. and
Brooks, P.D. 2015. Combined impact of catchment size, land cover, and precipitation on streamflow and total dissolved nitrogen: A global comparative analysis.Global Biogeochemical Cycles29: 1109-1121.
De Girolamo, A.M. and Lo Porto, A. 2012. Land use scenario development as a tool for watershed management within the Rio Mannu Basin. Land Use Policy29(3): 691-701.
Isik, S., Kalin, L., Schoonover, J.E., Srivastava, P. and Lockaby, B.G. 2013. Modeling effects of changing land use/cover on daily streamflow: An Artificial Neural Network and curve number based hybrid approach.Journal of Hydrology485: 103-112. Liu, W., Wei, X., Liu, S., Liu, Y., Fan, H., Zhang, M.,
Yin, J. and Zhan, M. 2015. How do climate and forest changes affect long-term stream flow dynamics: A case study in the upper reach of Poyang River basin.Ecohydrology8(1): 46-57. Notebaert, B., Verstraeten, G., Ward, P.J. and Van
Rompaey, L.A. 2011. Modeling the sensitivity of sediment and water runoff dynamics to Holocene climate and land use changes at the catchment scale.Geomorphology126(1-2):18-31.
Sharma, A., Tiwari, K.N. and Bhadoria, P.B.S. 2011. Effect of land use land cover change on soil erosion potential in an agricultural watershed. Environmental Monitoring and Assessment 173(1-4): 789-801.
Shi, Z.H., Ai, L., Li, X., Huang, X.D., Wu, G.L. and Liao, W. 2013. Partial least-squares regression for linking land-cover patterns to soil erosion and sediment yield in watersheds.Journal of Hydrology 498:165-176.
Sterling, S.M., Ducharne, A. and Polcher, J. 2013. The impact of global land-cover change on the terrestrial water cycle.Nature Climate Change3(4): 385-390.
Sun, W., Shao, Q., Liu, J. and Zhai, J. 2014. Assessing the effects of land use and topography on soil erosion on the Loess Plateau in China.Catena121: 151-163.
Tang, L., Yang, D., Hu, H. and Gao, B. 2011. Detecting the effect of land-use change on streamflow, sediment and nutrient losses by distributed hydrological simulation. Journal of Hydrology 409(1-2): 172-182.
Thothong, W., Huon, S., Janeau, J.L., Boonsaner, A., de Rouw, A., Planchon, O., Bardoux, G. and Parkpian, P. 2011. Impact of land use change and rainfall on sediment and carbon accumulation in a water reservoir of North Thailand. Agriculture, Ecosystems and Environment140(3-4): 521-533. Wang, G., Yang, H,, Wang, L., Xu, Z. and Xue, B.
2014. Using the SWAT model to assess impacts of land use changes on runoff generation in headwaters. Hydrological Processes 28(3): 1032-1042.