Research Article
a
December
2017
Computer Science and Software Engineering
ISSN: 2277-128X (Volume-7, Issue-12)
Twitter Sentiment Analysis
Harshil Shah*Computer Science & California State University, Sacramento, United States
Abstract: With the increasing popularity of social media, people have begun to express their opinions on a variety of topics on Twitter and other similar services.Sentiment Analysis on tweets has gained much attention for gathering public opinions on a wide variety of topics. In this paper, we aim to tackle the one of the fundamental problems of sentiment analysis, sentiment polarity categorization. We present a hybrid approach for identifying sentiments from a given piece of text.
Keywords: Sentiment Analysis, Text Mining, Twitter, Feature Selection, Social Networks
I. INTRODUCTION
Twitter is currently the most used microblogging site where users can express their views in 140-characters messages known as “Tweets”. These tweets almost every time carries the user’s views and sentiment about the topics on which he is tweeting. In this article, the proposed method helpsto extracts these sentiments from tweets. Twitter has more than 250 billion active users every day who tweets their opinion on almost every topic daily. These topics include but not limited to product reviews, movie reviews, political affairs, daily life events and many more. Twitter provides these tweet data using REST API free of cost.This is very helpful as it helps to mine the opinion of the users without any human intervention. With help of sentiment analysis, customers can get to know what other customers think about the product they are willing to buy. Companies can use this tool to check their customers’ feedback on their product. Organization and governments can check what are people’s thoughts about them.
A lot of research work has been done in this field. Traditionally the research was focused on the only lexicon approach where the data was classified based on the occurrence of the sentiment showing words in the data. Earlier researches were focused on the large chunks of text like Product Reviews. But Tweets are more abstract and less expressive than a movie or product reviews. As the tweet contains only 140 words, the tweets may or may not express direct emotions. This makes Sentiment Analysis(SA) on tweets make it different from other types of text mining.
This paper is focused on Sentiment Analysis(SA) on Twitter data using the hybrid approach. The proposed system uses machine learning to identify the patterns of the tweets which helps to identify the sentiments shown in the tweets and using lexical approach for preprocessing of the tweets and to calculate the sentiment score which is further used by machine learning algorithms for better predictions.
II. RELATED WORKS
Recently, sentiment analysis has been studied by many researchers. To determine sentiment two approaches commonly used: the learning based approach and the lexicon-based approach. References[1],[2] and[3] proposed lexicon approach for sentiment analysis. In this approach, the polarity is determined based on thepresence of positive words or negative words in the given piece of text. However, this approach gives low recall and high precision for entity-level opinion mining.
In machine learning approach, there are various unsupervised learning approaches and supervised learning approaches to mine opinions. Supervised learning approach uses pre-labeled datasets to train classifiers. To train classifiers different methods are used such as Naïve Bayes, Support vector machines, etc.[4] compared various supervised learning algorithms for classification of movie reviews which are trained on bag-of-words features. Also, they gain good accuracy with some of those algorithms. However, according to some researchers [5], sentiment mining which is solely based on datasets suffers when datasets of different domains are introduced.
ISSN(E): 2277-128X, ISSN(P): 2277-6451, pp. 15-21
III. APPROACH OR RESEARCH AND METHODOLOGY
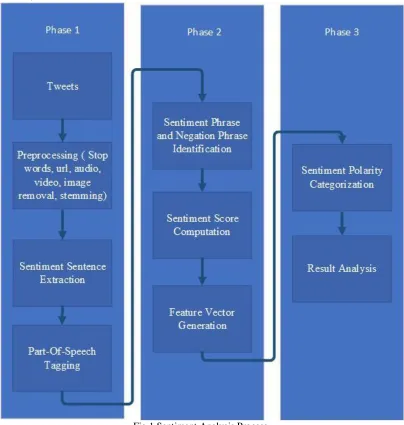
In this section, the proposed approach is described in detail. Given figure 1 represents an architectural overview of the proposed method for sentiment analysis. Before we dive into details of itlet’s take look at Twitter datasets which I have used in this system.
Fig.1 Sentiment Analysis Process
A. Datasets
I have utilized two public datasets for this research: STS-Gold [8]and Sanders Corpus [9].
Sanders Corpus
Sanders Corpus includes 5513 manually classified tweets. In this dataset only positive and negative labeled tweets are used, all tweets with neutral labeled where removed because they were irrelevant to my study. As a result, the total number of data used to analyze positive and negative sentiment was reduced to 3320.
ISSN(E): 2277-128X, ISSN(P): 2277-6451, pp. 15-21
STS_Gold
This dataset contains 2034 hand labeled tweets according to their sentiment, either positive label or negative label. Based on how negative (0) or positive (4) the tweet is They are assigned sentiment values of either 0 or 4.
Table II STS_Gold Dataset
B. Pre-Processing
Tweets contain some additional information (e.g. “RT” for a retweet, additional links, username, hashtags, etc.) rather than a simple statement.
Before starting opinion mining, I need to do some data cleansing. I removed retweets whose text starts with “RT" to avoid duplicate tweets. I also restored commonly used abbreviations to their original forms using a dataset of abbreviations (e.g. “2moro” to “tomorrow") and also removed links and usernames. However, emojis and special characters are kept since people often express the sentiment with them.
After cleaning, tweet’s tokenization except for negation phrases (e.g. “not good”, “not bad”) have been performed. Afterwards, part of speech tagging (POS) for each sentence is done.
C. Sentiment sentences extraction and POS Tagging
As suggested by Pang and Lee[4], for sentiment analysis all objective content should be removed. However, in this study, instead of removing objective content, all subjective content was extracted for future analysis. Subjective sentences contain sentiment which is either positive or negative sentiment. First of all, all data were tokenized into separated words.
Every sentence has its part of speech role which defines how it is used. The English language has 8 types of part of speech: the interjection, the noun, the verb, the adjective, the preposition, the adverb, the conjunction and the pronoun.
To classify words based on their part of speech, part of speech tagger built for the Penn Treebank Project [10] has been used in this research. This tagging is useful because usually, words like pronouns and nouns do not have any sentiment or opinion and verbs, adverbs and adjectives are words that mainly contain sentiments.
D. Negation phrases identification
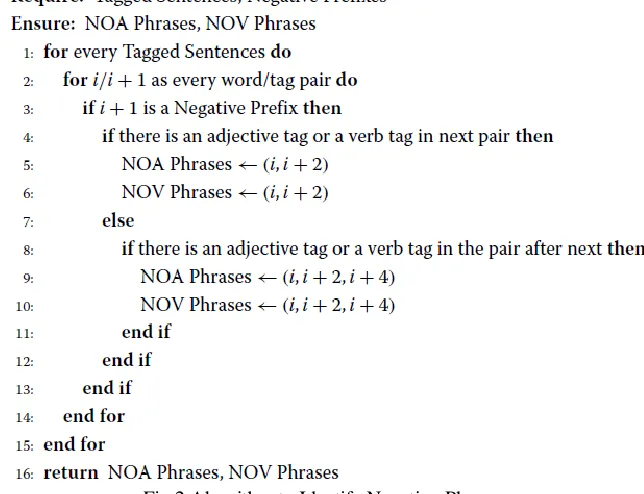
In English language, words can convey opposite sentiment with negation prefixes. For example, “nothing good”, “Not bad” changes opinion orientation.So, we need to look for negation phrases which areaffectingthe sentiment. Given algorithm helps to find two types of negation phrases, a negation of verbs (NOV) and negation of adjectives (NOA).
ISSN(E): 2277-128X, ISSN(P): 2277-6451, pp. 15-21 Table III Frequent Negation Phrases
Phrase Type
don’t recommend NOV
didn't work NOV
not good NOA
not bad NOA
not revolutionary NOA
not worth NOA
After identification of negation phrases in the sentence whole phrase is considered as a token which conveys a true opinion.
E. Sentiment Score Computation and Feature Vector Generation
In sentiment classification, the tokens that include sentiment needed to be identified first before the categorization. From original datasets, sentiment tokens are extracted. Based on those tokens sentiment score of every tweet is calculated. Xing Fang and Justin Zhan’s [11] approach has been used for sentiment score calculation.To train the classifier training data needs to be transformed into vector aka feature vector. In sentence level categorization, we need to offer feature vector for every sentence. One of the major challenges is to control the size of a feature vector. It should not contain abundant features. Moreover, every feature vector size should be same. To overcome these challenges, one binary string is used which hasthe appearance of a token, one bit for the presence of negation phrase and sentiment score. Suppose if we have total 11,000 sentiment tokens in a provided dictionary then 11,000 bits of the binary string will be used to represent token appearance. If ith sentiment token appears in a sentence then ith location bit will be set to “1” while others will be set to “0”. Sentiment Score and a bit to indicatethe presence of negation phrases will be appended to those bits. A hash values of these bit strings are saved.
F. Result analysis
Results of classified tweets gained through Naïve Bayes, Random Forest, andSupport Vector Machine and compared with their relative performance into four parameters, recall, precision, accuracy, F- measure.
Accuracy = 𝑇𝑝 +𝑇𝑛
𝑇𝑝+𝑇𝑛 +𝐹𝑝+𝐹𝑛
F = 2 * Precision ∗ Recall Precision + Recall
Precision = 𝑇𝑝
𝑇𝑝 +𝐹𝑝
Recall = 𝑇𝑝
Tp + Fn
Tn = True negative Tp = True positive Fn = False negative Fp = False positive
IV. CONCLUSION
Opinion mining is a field of study that analyzes people’s opinion. This article tackles thefundamental problem of sentiment analysis. Theprocess of sentiment analysis (Figure 1) has been proposed along with details of each step. Improvingfeature vector, data sets of prelabeled sentences and sentimental words will give more accurate results.
V. METHODS
ISSN(E): 2277-128X, ISSN(P): 2277-6451, pp. 15-21
i) Naïve Bayes Classifier
Naïve Bayes Classifier is based on Bayesian theorem and convenient when the range of the inputs is high. In spite of its simplicity, Naïve Bayes Classifier performs better than other classification methods [14].
Figure 3 Demonstration of Naïve Bayes Classifier
As shown in Figure 3, objects can be classified as either RED or GREEN. The main task is the identification of a class of new objects. This decision can be taken on the basis of existing objects. Since there are double the numbers of GREEN objects than RED as shown Figure 3. So, it can be thought that new objects will more likely belong to GREEN class. This faith is known as the prior probability in the Bayesian analysis. Prior probabilities work on the basis of previous experience. In this case, prior probabilities are the percentage of GREEN and RED objects. Suppose, there are 60 objects, 40 of which are GREEN and 20 are RED. Thus, prior probabilities for GREEN and RED objects will be as given in (1.1) and (1.2) [14].
Prior probability for GREEN ∝ (No. of GREEN objects/Total no. of objects)∝(40/60) … (1.1)
Prior probability for RED ∝ (No. of RED objects/Total no. of objects)∝(20/60) … (1.2)
Now, the new object (X) shown as a WHITE circle in Figure 3, can be classified using prior probability. Since all the objects are well clustered, it is logical to infer that there are more GREEN (or RED) objects in the area of X. So, there are more chances that new object will belong to GREEN class.
Figure 4 Classification of New Object in NBCs
To measure this likelihood, a circle is drawn around X which encloses a number of points rather than their class labels. Then the number of points in the circle is calculated to compute the likelihood as given in (1.3) and (1.4) [14].
Likelihood of X given GREEN ∝(No. of GREEN in the area of X/ Total no. of GREEN cases)
∝(1/40) … (1.3)
Likelihood of X given RED ∝(No. of RED in the area of X/ Total no. of RED cases)
∝(3/40) … (1.4)
Although prior probabilities have shown that new object (X) will belong to GREEN class likelihood has shown that it will belong to the RED class. But, in the Bayesian analysis, the final classification is done by calculating a posterior probability using the Bayes' rule. A posterior probability can be calculated by combining both the prior probability and thelikelihood as given in (1.5) and (1.6) [14].
Posterior probability of X being GREEN ∝Prior probability of GREEN * Likelihood of X given GREEN
= (4/6) * (1/40) = (1/60) … (1.5)
Prior probability of RED * Likelihood of X given RED
= (2/6) * (3/20) = (1/20) … (1.6)
ISSN(E): 2277-128X, ISSN(P): 2277-6451, pp. 15-21
ii) Support Vector Machines
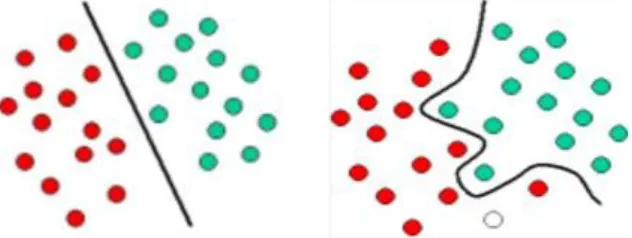
Support Vector Machines work on the idea of decision planes that specify decision boundaries. A set of objects belonging to different class memberships are separated by decision planes [14]. An example to illustrate the concept of linear SVMs is shown in Figure 5(a). In this example, the objects either belong to GREEN class (or RED class). The separating line specifies the decision boundary. On the right-hand side of the boundary, all objects are GREEN and to the left-hand side of the boundary, all objects are RED. A new object (white circle) will be classified as GREEN if it falls to the right side of the boundary or classified as RED if it falls to the left side of the boundary.
Figure 5 (a) Example of linear SVM, (b) Example of hyperplane SVM
A classifier that partitions a set of objects into their respective domains with a line is called linear classifier and partitioning with a curve is known as hyperplane classifier [14]. An example of hyperplane classifier is shown in Figure 5(b).
Figure 6 Mapping of objects in SVMs
Figure 6 shows the basic concept behind Support Vector Machines. In this figure, original objects are mapped applying a set of mathematical functions known as kernels. This process of reorganizing the objects is known as mapping or transformation. The figure shows that the mapped objects are linearly separable [14]. Thus, find an optimal line rather than constructingthe complex curve that can divide the GREEN and the RED objects.
REFERENCES
[1] Hu, M and Liu, B., "Mining and summarizing customer reviews," KDD'04, 2004. [2] Kim, S and Hovy, E., "Determining the Sentiment of Opinions.," COLING'04, 2004.
[3] Taboada, M., Brooke, J., Tofiloski, M., Voll, K., and Stede, M., "Lexicon-based Methods for Sentiment Analysis," Journal of Computational Linguists, 2010.
[4] B. Pang, L. Lee, and S. Vaithyanathan. , "Thumbs up?: sentiment classification using machine learning techniques.," EMNLP ’02, 2002.
[5] J. Read., "Using emoticons to reduce dependency in machine learning techniques for sentiment classification.," Association for Computational Linguistics., 2005.
[6] Wiebe, J. and Riloff, E., "Creating Subjective and Objective Sentence Classifiers from Unannotated Texts," CICLing, 2005.
[7] Lei Zhang, Riddhiman Ghosh, Mohamed Dekhil, Meichun Hsu, Bing Liu, "Combining Lexicon-based and
Learning-based Methods for Twitter Sentiment Analysis," HP Laboratories, 2011.
[8] H. Saif, "Tweenator," [Online]. Available: http://www.tweenator.com/index.php?page_id=13.
[9] "Sanders, Niek. Twitter Sentiment Corpus. Sanders Analytics.," [Online]. Available:
http://www.sananalytics.com/lab/twitter-sentiment/.
[10] M. M, "Upenn part of speech tagger," 1996. [Online]. Available:
ISSN(E): 2277-128X, ISSN(P): 2277-6451, pp. 15-21 [11] Xing Fang and Justin Zhan, "Sentiment analysis using product review data," Journal of Big Data, 2015.
[12] "Scikit-learn," 2014. [Online]. Available: http://scikit-learn.org/stable/.
[13] Han J, Kamber M, Pei J, "Data Mining: Concepts and Techniques, Second Edition (The Morgan Kaufmann Series in Data Management Systems)," 2nd ed. Morgan Kaufmann, 2006.