Using conjoint analysis to assess pediatric
gastroenterologists' preferences regarding the
management of pediatric Crohn's Disease
By
Shilpa Saxena McManus
A Master's Paper submitted to the faculty of the University of North Carolina at Chapel Hill
in partial fulfillment of the requirements for the degree of Master of Public Health in
the Public Health Leadership Program.
Chapel Hill
Abstract
Background: Difficulties in diagnosis, treatment, and chronic management of Crohn's Disease (CD) may explain the variation in diagnostic evaluation and
treatment therapies seen among providers. Our systematic literature review shows
that published guidelines do not fully address management of pediatric CD.
Therefore, using the Quality hnprovement Model, we can systematically gather
data from experts on the best way to change current CD management.
Objective: To determine if conjoint analysis can summarize current beliefs among pediatric gastroenterologists on the relative importance of implementing
evidence-based changes to improve outcomes of children with CD.
Methods: We administered an online survey, Physicians Beliefs on Crohn's Management, to a convenience sample of 12 members of the Pediatric
Inflammatory Bowel Disease (PillD) Network. We asked participants to rank 16
different clinic scenarios based on which ones were most likely to improve patient
outcomes and analyzed the ranking through conjoint analysis.
Results: One physician completed the survey for a response rate of 8.3%. Results suggest that decreasing steroid use is most likely to improve outcomes while
planned care and optimizing nutrition are least likely to improve outcomes. We
found the largest effect of interaction to be between standardizing diagnostic
evaluation and planned care.
Conclusion: Conjoint analysis has the potential to summarize current beliefs among pediatric gastroenterologists regarding CD management, but before it can
Shilpa McManus 2
Introduction
Pediatric inflammatory bowel disease (IBD) is a chronic, destructive
inflammatory disease of tbe gastrointestinal tract.1 Children with IBD can be
further described as having either Crohn's disease (CD) or ulcerative colitis (UC).
CD is characterized by ulcerations and scarring of the terminal ileum and
proximal colon, but can affect any part of the gastrointestinal tract. 2 Patients
typically complain of abdominal pain, diarrhea and weight loss, but can also
present with blood or mucus in stools, fatigue, growth failure, delayed puberty, or
extraintestinal symptoms (erythema nodosum, aphthous ulcers, arthritis, ocular
disease, etc.). The estimated incidence of pediatric CD in the United States is 4.56
cases per I 00,000 children for all racial and etbnic groups.1 Approximately 80%
of cases are diagnosed after age 10, with an average age of diagnosis of 13.5 years.
Only 12% of cases are in children with a positive family history of CD.
Managing children with CD can be difficult. Although characteristics of
CD and UC are very different in adults, they are not as distinct in children? For
example, adults with CD typically present witb diarrhea while those with UC
present with rectal bleeding. However, children with either CD or UC present
with abdominal pain. This suggests that clinical symptoms may not be helpful in
diagnosing children with CD. Secondly, our understanding of the etiology of CD
is limited. Development of this disease depends only partially on genetic factors.4
Potential nongenetic factors include smoking, use of nonsteroidal
explain how these environmental factors lead to the development of CD, making
it difficult to find effective treatments. Finally, CD is a chronic disease, affecting
individuals throughout their childhood and adulthood. To manage such
individuals, it is important to provide self-management support, coordinate proper
interdisciplinary care, and follow evidence based clinical practice guidelines. 5
Together, difficulties in diagnosis, treatment, and chronic management
may explain the variation that Colletti eta!. found in diagnostic evaluation and
treatment therapies for pediatric CD patients at 30 different IBD clinics.6 For
example, only 75% of pediatric gastroenterologists completed stool cultures to
rule out an infectious process, 6 despite the fact that this is recommended for all
patients3. Similarly, 63% used mesalamine for treatment, 6 but this drug is
considered first line treatment for all patients with mild CD.7 Although variation
in care often exists because we do not know the best way to care for a disease,
variation may also exist because we know the best way to manage the disease, but
not all practices have implemented it. For this second reason, consensus based and
evidence based guidelines can improve quality of care by assisting all physicians
in providing the best care to patients. 8
To address this variation in care, we completed a two part study. We first
conducted a systematic review on current recommendations for diagnosing,
treating, and managing pediatric CD. We then surveyed pediatric
gastroenterologists and, using conjoint analysis, summarized their current beliefs
Shilpa McManus 4
Quality Improvement
Definition of Quality Improvement
Quality Improvement (QI) is a set of methods designed to improve the
performance of systems. 9 A system is "A network of interdependent components
that work together to accomplish a shared aim".1
°
For example, the network ofactivities performed in a CD outpatient clinic is a system that creates a particular
set of outcomes. To meaningfully improve these outcomes, we cannot make
changes such as hiring more nurses for each clinic or asking doctors to work
longer hours because these are merely ways of adding resources. Instead, QI
involves changing the way components of a system work together.
In order to conduct QI, we need to understand the following theoretical
and methodological principles of QI.11 The four principles are: I) appreciation of
the system; 2) learning from variation; 3) building knowledge through testing; and
4) human reaction.
Appreciation of the System
This first principle means that to improve outcomes, you must first
understand that they are the result of a system or a set of care processes.11
Therefore, to improve the result you need to identify the system. One way to
describe a system that is applicable to CD patients is to use Wagner's chronic
illness care model.5 In this model, community resources and policies interact with
the health care system, which is defined as family and self management, delivery
system design, decision support, and clinical information systems. As the name
manage their chronic illness. Delivery system design describes the roles and
activities of staff within CD clinics. Decision support refers to processes that
support the use of evidence based care by the provider. Finally, a clinical
information system aids providers in monitoring the overall care of each patient as
well as all the patients in the practice.
Learningfrom Variation
If all systems are not standardized then we will observe 2 types of
variation in the results.11' 12 The first type of variation is variation due to chance,
which typically falls within± 3 standard deviations of the mean. The second type
of variation is due to differences in systems and is defined as > 3 standard
deviations from the mean. For example, not all outpatient CD clinics have the
exact same infrastructure. Depending on location or funding, the clinics may have
different services or referral resources. This variation between systems may lead
to significant variation in outcomes for CD patients. By studying the second type
of variation, we can learn which changes to a system may lead to improvement in
. 12
pat1ent outcomes.
Building Knowledge through Testing
QI methods represent a means of applying the scientific method to learn
rapidly in a complex organizational system. An example of such a tool is the
model for improvement created by Langley et al.11 The two component model is
designed to help individuals apply the scientific method to the improvement of
systems. The first component is the planning component, which is comprised of
Shilpa McManus 6
that a change is an improvement? and 3) What changes can we make that will
result in improvement? The second component, the action component, was first
developed by WE Deming for quality management and is comprised of
continuous Plan-Do-Study-Act cycles. During the Plan phase, we identify the
problem and the changes we would like to make. In the Do phase, we implement
a change, often on a small scale, and then during the Study phase we evaluate the
effects of the change in comparison to our aim. Finally, during the Act phase, we
formalize the change and consider implementing it on a larger scale. QI should be
a continuous process because our enviromnent is constantly changing. Therefore,
after the Act phase, we return to the Plan phase to decide what other changes
should be made.
Human Reaction
The last principle of QI is anticipating how individuals will react to the
changes.11 For example, providers may react positively to a new standardized
diagnostic protocol because they feel that it simplifies diagnostic evaluation and
leads to proper diagnoses of all their patients. On the other hand, they may react
negatively because the new protocol may influence long established habits.
Applying Quality Improvement Models to Pediatric CD Management
Significance of QI
In 2001, the Institute ofMedicine (IOM) concluded that a large chasm
exists between the health care we have and the health care we could have.13 This
services.14 The root of these three problems are the increase in prevalence of
chronic diseases, the growing complexity of science and technology, and our
poorly organized health care delivery system.15 To address the health care chasm,
the IOM created 10 "rules" that would redesign our current health care system.13
Rule number 5 encouraged the use of evidence based care because systematic
reviews and clinical guidelines along with reminder systems can improve patient
care. To provide consistent, high-quality care to patients with CD, we can use QI
methods to identifY and develop clinical guidelines.
Idealized Design
To identify the best way to manage pediatric CD, we need to first develop
a theory or hypothesis for which changes in management of pediatric CD will
improve outcomes. As the systematic literature review below will show, we have
very few published guidelines on CD management that we can follow. Since we
cannot use the literature to define our recommended changes in management, we
must systematically gather data from experts in the field. The protocol that we
will follow is based on the Idealized Design Process described by Ronald Moen in
"A Guide for Idealized Design".16 This explicit process for design improvement is
based on prior strategies used in industry. Moen describes 6 phases, starting from
Phase 0 and ending with Phase 5. During Phase 0, which is the focus ofthis study,
we generate new ideas for restructuring the current system in such a way that we
improve the quality of care patients receive. During Phases I through 4, the new
Shilpa McManus 8
The first Idealized Design project was led by the Institute for Healthcare
Improvement (IHI) in January 1999.16 The IHI wanted to redesign the health care
system by starting with the clinical office practice. 17 The Idealized Design of
Clinical Office Practice (IDCOP) initiative involved 42 practices that tried to
improve patient satisfaction, access to care, and the quality of outpatient care. One
practice increased their overall percentage of high patient satisfaction from 72%
to 95%.18 They increased access to care by decreasing their waiting time for an
appointment from 59 days to 1 day. Finally, they improved clinical outcomes by
increasing the percent of diabetic patients who monitor their blood glucose at
home from 54.3% to 72.4%.
Change Concepts
Using the steps in Phase 0 of the Idealized Design Process outlined in
Appendix A, experts in quality improvement and pediatric gastroenterology
identified 5 changes to CD management that they hypothesize will improve
outcomes.16 As the first step, our sponsors, the North American Society for
Pediatric Gastroenterology, Hepatology, and Nutrition (NASPGHAN) and the
American Board of Pediatrics, selected pediatric CD as the topic of interest and
provided funding. Next, 2 experts in quality improvement and 3 experts in
pediatric gastroenterology formed a team to address this topic. Using questions
from the planning component of the model for improvement, the team developed
a charter with the goal of improving outcomes for children with CD. For the 5'h
step, the 5 experts reviewed both research based evidence and anecdotal evidence
Wagner as a framework to organize the evidence.5• 19 Next, the team selected a
large hospital in the northeastern US and observed how patients were managed at
the CD clinic. They then held a meeting to brainstorm ideas for improvement
based on their observations. Next (step 9), they held a meeting of 20 pediatric
gastroenterologists who are recognized experts in CD to narrow down the ideas.
At the meeting, experts identified 5 changes to CD management and 5
outcomes to measure improvement in care. The 5 change concepts were the
following: 1) standardize diagnostic evaluation; 2) optimize nutritional
assessment and management; 3) planned care; 4) promote patient and family self
management; and 5) decrease use and duration of steroids. For details on the
definitions of each change concept, please refer to Appendix B. The outcomes
were reducing overall disease activity, increasing quality oflife, achieving normal
growth, decreasing complications ofiDD, and decreasing medication side effects.
Quality oflife would be measured using IMP ACT 35, which is a validated 35
question survey designed for children and adolescents that determines the effect
ofiDD on health.20 To determine what pediatric gastroenterologists hypothesize is
the effectiveness of each of the 5 change concepts for improving patient outcomes,
we will conduct a conjoint analysis, as recommended in Phase 0 (Appendix A).
Conjoint Analysis
Conjoint analysis has been used traditionally in marketing research to
determine consumer preferences by assessing the relative importance of groups of
attributes. 21 This allows us to calculate which attribute is the most important and
Shilpa McManus I 0
important attribute. 22 We can then predict which trade-offs consumers will make
when purchasing a product. This indirect method is more effective than directly
asking the consumer because, similar to real life, it forces the consumer to make
trade-offs.23
In clinical trials, interventions are done one at a time. This allows us to
compare one single intervention to placebo or standard care and determine which
is better. However, in clinical practice, many interventions are made at once,
making it difficult to identify which change had the largest effect. Sometimes two
interventions interact synergistically such that the effect of both changes is greater
than the effect of each on its own. Similar to real clinical settings, a conjoint
analysis allows us to hypothesize which intervention has the largest effect and
which two changes work synergistically when many changes are made at once.
Three types of conjoint analysis exist and depending on the type of
research, one is usually more appropriate than the others.Z4 Choice-Based
Conjoint (CBC) uses interview questions that mimic the process for purchasing
competing products. CBC is appropriate for predicting product choices and for
measuring interactions between attributes that have more than 3 levels. For
example, 5 different sedans may be described by 4 attributes: price, gas mileage,
safety rating and color. Each attribute can then have different levels. An attribute
with more than 3 levels could be car color because the sedan may come in blue,
green, red and gray. Rather than rank the 5 cars, respondents are asked to choose
importance of attributes rather than predicting product choices. Therefore we
decided that CBC was not appropriate for this study.
The second type of conjoint analysis is Adaptive Conjoint Analysis (ACA),
which asks respondents to first rank all of the attributes and then compare pairs of
products with different levels for each attribute.24 ACA is computer administered
because interview questions are adapted to the respondents' previous answers.
This allows respondents to evaluate 8-15 attributes without being overloaded by
seeing all attributes at once. ACA also allows the researcher to have a smaller
sample size because the estimates of the respondent's preferences are more
accurate. Since this study only has 5 change concepts or attributes, we felt that the
complexity of ACA was unnecessary.
Traditional Full-Profile Conjoint Analysis (CV A) is the third type of
conjoint analysis and is the most appropriate type of analysis for this study. 24
Respondents are asked to rank products with different levels for each attribute.
CV A can only be used to evaluate up to 6 attributes because respondents must see
all the products and their attributes at once. If respondents are asked to evaluate
more than 6 attributes, they cannot process them effectively. Similar to CBC,
CV A can measure interactions between attributes, but the attributes must have
less than 3 levels. For this study, we chose CV A because we have 5 attributes and
each attribute has 2 levels. There are only two levels because each change concept
is either implemented or is not implemented.
At the end of the conjoint analysis, we will determine ifCVA is an
Shilpa McManus 12
gastroenterologists hypothesize will most improve outcomes for CD patients.
With this expert generated hypothesis, NASPGHAN and the American Board of
Pediatrics will enter the Plan phase of the PDSA cycle, where they will develop
an intervention to test the hypothesis. After several PDSA cycles, they can
provide evidence either supporting or refuting the hypothesis from our conjoint
analysis.
Systematic Review of Clinical Recommendations for Crohn's Management To identify standard practices for CD management, we conducted a
systematic review of the literature regarding current guidelines on the diagnosis,
treatment and management of pediatric CD. Only some of the articles provided
guidelines on our 5 concept changes (Appendix B). We critically appraised the
selected articles using the 25 item questionnaire developed by Shaneyfelt,
Mayo-Smith, and Rothwangl.25
Article Selection
We searched Pubmed, Ovid and Clearinghouse Guidelines databases for
relevant articles using different combinations of the following search string:
pediatric, IBD or Crohn's disease, and recommendations or guidelines. Articles
were limited to those published in English before March 2006 and included a list
of guidelines or recommendations for pediatric Crohn's disease. As Figure 1
shows, our online search resulted in 73 articles, 9 of which had potentially
relevant titles. Of the 9 abstracts, only 7 were relevant to this topic. This author
The hand search of bibliographies from relevant articles and consultation with
experts in the field of pediatric gastroenterology led to acceptance of one other
article for the systematic review.
Literature Appraisal Methods
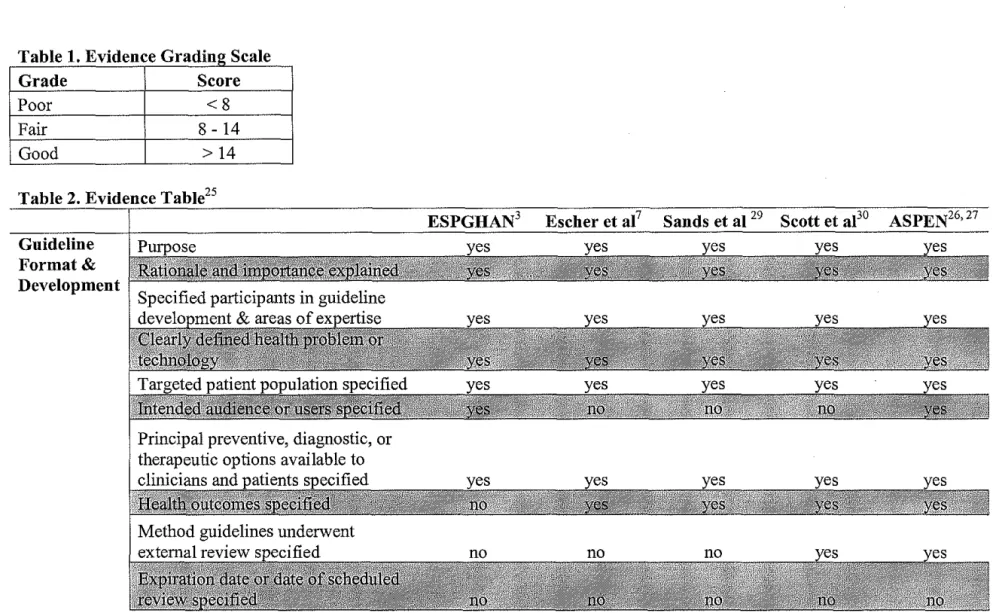
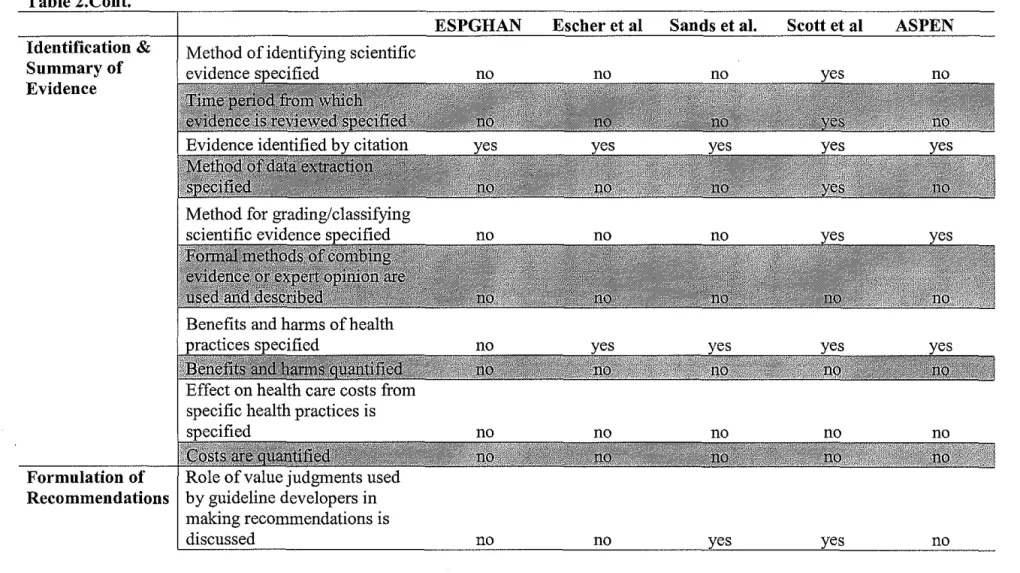
The 25 item questionnaire for guidelines uses a yes or no format to
measure how well published guidelines follow standards on guideline format and
development (1 0 questions), on identification and summary of evidence (1 0
questions), and on formulation of recommendations (5 questions).25 Each question
is worth 1 point, such that the ideal guidelines would have all 25 items and would
receive 25 points. Shaneyfelt, Mayo-Smith, and Rothwangl reviewed 279
guidelines which had a mean score of 10.77 with a standard deviation of3.7.
Using these results, we defmed a set of guidelines as good if they were more than
1 standard deviation above the mean, fair if they were
±
1 standard deviation fromthe mean, and poor if they were more than 1 standard deviation below the mean.
Therefore, poor guidelines would have a score less than 8, fair guidelines would
have a score between 8 and 14 and good guidelines would have a score above 14
(see Table 1 ).
Standardized Diagnostic Evaluation
Of the five articles that met inclusion criteria, only one suggested
guidelines on how to diagnose children with Crohn's disease3 Published by the
IBD working group of the European Society for Paediatric Gastroenterology,
Hepatology, and Nutrition (ESPGHAN), this article describes a protocol
ShilpaMcManus 14
Crohn' s disease. The guidelines received a score of 7 for following standards on
guideline format and development, a score of 1 for identification and summary of
evidence, and a score of2 for formulation of recommendations (see Table 2).
Unlike the other articles, these guidelines did not discuss health
outcomes. 3 This may be because they were focused on appropriate diagnosis for
furthering epidemiological data on this disease. Indirectly, the authors are
suggesting that by gathering more data on this disease, we may be able to
understand it better and hence improve treatment and outcomes. However, the
authors did not suggest that, by standardizing the diagnostic evaluation, patients
will be appropriately diagnosed, which would improve health outcomes.
ESPGHAN' s recommendations for diagnosis did not describe their guideline
development or their procedure for identifying evidence, which explains their
poor score for the second section of the questionnaire. For the last section, the
recommendations were flexible and specific to the goals of the guidelines.
However ESPGHAN did not formally grade the recommendations, nor did they
discuss patient preference or the role of value judgments.
Based on the Porto criteria3 and the limited articles on diagnosing IBD,
there seems to be some controversy on how to differentiate children with CD and
UC. Since it is unclear in the literature on how to best diagnose CD in children,
pediatric gastroenterologists may disagree on the impact of a standardized
diagnostic evaluation.
Only one article addressed nutritional assessment and management. 26 The
American Society for Parenteral and Enteral Nutrition (ASPEN) recommended
nutrition screening for all children with IBD and provided guidelines for usage of
enteral or parenteral nutrition. For guideline format and development the ASPEN
guidelines received a score of 9, for identification and summary of evidence they
received a score of3, and for formulation of recommendations they received a
score of 3 (see Table 2).
For the first section of the questionnaire, the ASPEN guidelines discussed
everything except an expiration date.27 Authors did report that ASPEN would
continue to review the guidelines and update them on a certain schedule, but then
they did not publish this schedule. For the second section, the guidelines cited and
graded evidence and discussed harms and benefits, but did not define their
methods for data extraction and consolidation. Finally, for the third section,
ASPEN did not describe the role of value judgments and patient preference.
The guidelines on nutritional assessment and management, although
sparse, seem very clear. Most pediatric gastroenterologists should agree that all
physicians should optimize nutrition for pediatric CD patients. However, the
feasibility of optimizing nutrition may be limited and may decrease its impact for
. . 28
1mprovmg outcomes.
Planned Care
Planned care is when an interdisciplinary team meets regularly to review a
patient's chart and any other patient information and plans what to do next.
Shilpa McManus 16
activity, and the medication list. Then, the team identifies problems in one or
more of these areas and creates a plan for patient interaction. No published
guidelines addressed the issue of planned care in the management of CD. There
are no recommendations on who should be involved in the meetings, what areas
of disease management should be discussed, and even if planned care should be
implemented in all practices. Since there are no recommendations, it is difficult to
predict what most pediatric gastroenterologists believe is the impact of planned
care.
Promote Patient and Family Self Management
We found no guidelines that encouraged or discouraged the promotion of
patient and family self management. Similar to planned care, it is difficult to
predict what pediatric gastroenterologists believe is the impact of self
management.
Decrease Use and Duration of Steroids
Only one article reviewed the evidence for various medical therapies,
described side effects, and suggested usage and dosage for each medical therapy.7
These recommendations received a score of 7 for following standards on
guideline format and development, a score of 2 for identification and summary of
evidence, and a score of3 for formulation of recommendations (see Table 2).
For the first section of the questionnaire, Escher et aL did not mention
their intended audience or users, their external review process, or an expiration
date for their guidelines. 7 Similar to the diagnostic recommendations, the
their procedure for identifYing evidence. Escher et a!. did summarize the potential
side effects of each treatment in detail. They did not, however, describe how they
identified the evidence, what time period it came from, how it was extracted and
combined, or if the evidence was of high quality. While we know the benefits and
harms ofthe treatments, we are not told how much they cost. Although the
authors of this article gave recommendations for treatment, they may describe this
article as a review rather than a set of guidelines. If this is true, then they may not
have felt it was necessary to grade their recommendations or explain how they
combined their evidence. This does not explain why they did not describe their
methods for data extraction. Finally, Escher et a!. described how they created their
recommendations, but they did not mention patient preference or the role of value
judgments.
Besides this one article on recommendations for CD treatment/ there are
many reviews in the literature discussing treatment options.4' 28 There seems to be
some consensus on which class of drugs is best for CD treatment and the
importance oflimiting steroids. Therefore, pediatric gastroenterologists are likely
to agree on the impact of steroid reduction on patient outcomes.
Other Aspects of CD Management
The remaining two articles did not address any of our 5 change concepts,
but they did address other important management issues. One article addressed
whether routine childhood vaccinations are safe for children with Crohn's
Shilpa McManus 18
of 7, for identification and summary of evidence they received a score of 2, and
for formulation of recommendations they received a score of3 (see Table 2).
Similar to the treatment recommendations by Escher et al., the vaccination
guidelines did not mention their intended audience or users, their external review
process, or an expiration date for their guidelines.Z9 Authors cited their evidence
and discussed the harms and benefits of vaccination in depth. However, the
authors did not explain in detail how they identified their evidence or how they
developed their guidelines. Lastly, the guidelines were flexible and specific to
guideline goals, but did not discuss patient preference or grade the immunization
guidelines.
L
The other article not addressing any change concepts described strategies
for preventing and treating osteoporosis in
mD?
0 The guidelines received a scoreof 8 for following standards on guideline format and development, a score of 6 for
identification and summary of evidence, and a score of 5 for formulation of
recommendations (see Table 2).
For the first section of the questionnaire, Scott et al. explained their
external review process but did not give an expiration date for their guidelines. 30
For the second part, they described how they identified, extracted and graded their
evidence and discussed the harms and benefits of treatment. For the last part,
these guidelines met all the criteria.
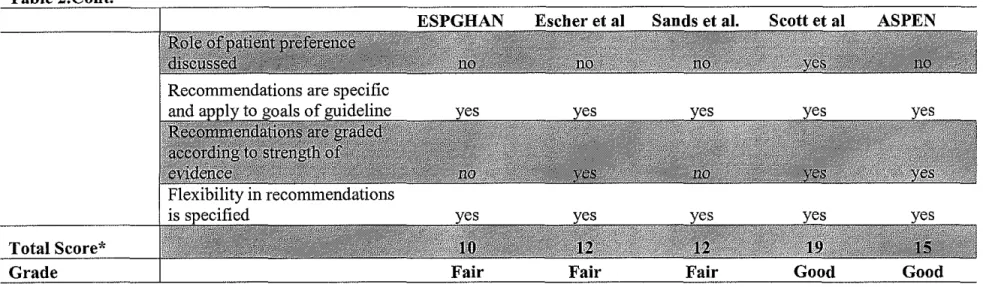
Overall Findings of Systematic Review
The diagnostic recommendations byESPGHAN met 10 of the guideline
guidelines each met 12 of the standards. The ASPEN guidelines met 15 of the
standards and the osteoporosis guidelines met 19 of the standards. Based on these
results, the ESPGHAN, medical treatment, and immunization guidelines were fair
while the osteoporosis and ASPEN guidelines were good (see Table 2).
For guidelines to be useful, they need to be up to date. On the other hand,
determining how long they will be accurate can be difficult because we cannot
often predict when medicine will change. This may explain why none of the
articles published an expiration date for their recommendations. Another
explanation may be that the group that publishes the guidelines must constantly
review the literature and make changes to guidelines on a regular basis. Except for
ASPEN, none of the other groups were willing to make such a commitment.
None of the 5 articles attempted to quantify benefits and harms or health
care costs. These results are similar to findings by Shaneyfelt, Mayo-Smith, and
Rothwangl, who reported that only 14.3% of279 guidelines quantified health care
costs.Z5 We believe practice guidelines can play a role in decreasing health care
costs because they have the potential to decrease mistakes and decrease misuse,
overuse, and underuse of medical care. However, very few guideline developers
attempt to prove or disprove this belief. This may be because most guideline
developers are physicians who have minimal expertise in running cost benefit
analyses. Costs may be overlooked because physicians are more focused on
providing patients with proper medical care. Finally, authors may not quantify
Shilpa McManus 20
All five articles describe flexible guidelines that allow the health care
provider to use his or her judgment before finalizing a plan of action. However,
only one article suggests that the provider should consider their patient's
judgment when deciding appropriate medical care. Guidelines developers may not
discuss patient preferences because they believe that by giving health care
providers flexibility, providers can then take into account patient preferences. On
the other hand, guideline developers may believe that patient preferences should
not influence care decisions.
Significance ofthis Study
Currently, published guidelines do not fully address management of
pediatric CD. The systematic review shows that guidelines for the diagnosis and
treatment of CD are ofliruited quality, and the good guidelines that do exist only
address osteoporosis and nutrition. We do not have any recommendations
discussing patient education or interdisciplinary care, which play a large role in
managing chronic diseases. 5 Since current literature on CD management is limited,
we would like to begin an improvement collaborative that develops information
about what combination of the 5 change concepts improves outcomes for CD
patients the most. This will be a 2'5•1 factorial, time series study where each
practices adopts one or more of the 5 change concepts and then measures each
patient outcome for improvement. Before we conduct the study, however, we
would like to formally determine which change concept( s) pediatric
To determine if conjoint analysis can summarize pediatric
gastroenterologists' beliefs on the relative importance and feasibility of
implementing evidence-based changes to improve outcomes of children with CD,
we administered a survey and conducted a conjoint analysis according to the
methods of QI. Based on the literature review, we would expect there to be
variation in providers' beliefs on diagnosing children with CD, but not for
optimizing nutrition or decreasing steroid use. For planned care and patient and
family self management, it is difficult to predict provider beliefs.
Study Methods
Study Population
The Pediatric Inflammatory Bowel Disease (PIBD) Network for Research
and hnprovement is a collaborative network that allows all physicians in North
America who are board certified in pediatrics and gastroenterology to work
together to improve the health care of children with IBD.31 This network provides
a secure online system that stores and analyzes data. As of March 2006, there
were a total of72 pediatric gastroenterologists who had entered patient data into
the PIBD database. There were 58 males and 14 females ranging in age from
approximately 30 years to 70 years old. Race and ethnicity of providers was not
reported in the PIBD database. Physicians that played a role in designing and
testing the survey were not included in our study.
Rather than contacting all 72 members to volunteer for our study, we
Shilpa McManus 22
academic practice and one small private practice if they would be willing to join
our study. Although a random sample of volunteers would have been ideal, we
felt we could increase our response rate by asking groups that were more likely to
respond.
Survey Development
To determine which of the 5 change concepts pediatric gastroenterologists
view as most important for improving outcomes of children with CD, we used
CV A to develop a survey for PIBD network members. The first question in the
Physicians Beliefs on Crohu's Management Survey asked physicians to rank
clinic scenarios from 1 to 16, based on most likely to improve outcomes for
children with CD. Scenarios that were ranked closer to 1 had a higher ranking and
were more likely to improve outcomes, while scenarios that were ranked closer to
16 had a lower ranking and were less likely to improve outcomes. Each clinic
scenario either did or did not implement each of the 5 change concepts. For
example, in one scenario the physician may evaluate a patient using a
standardized diagnostic tool and may promote patient and family self
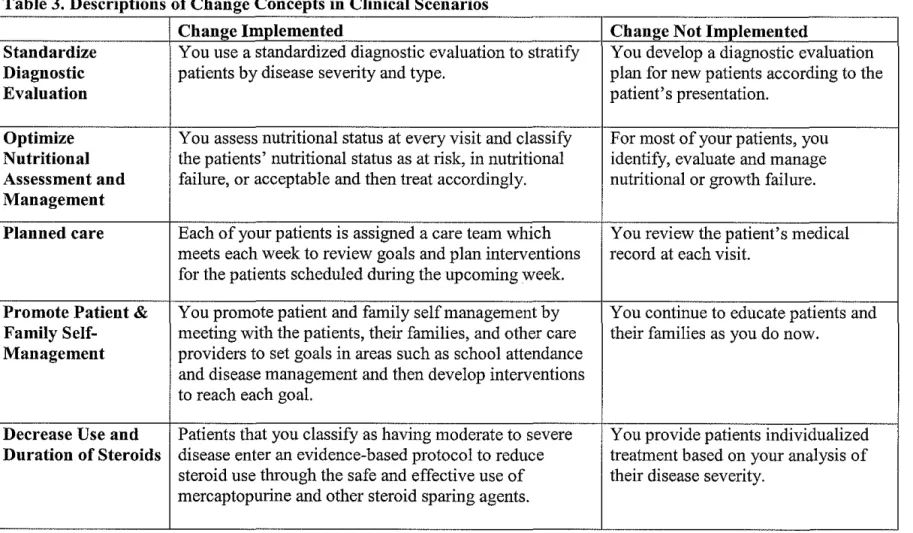
management but may not implement the other three change concepts. Table 3
summarizes the descriptors for each change concept used in the clinic scenarios.
The second question in the survey asked physicians to rate the feasibility of each
scenario with 1 being the most feasible and 5 being the least.
There are 5 change concepts and each change concept has two levels
because either the change is implemented or it is not implemented. Therefore,
managing CD, investigators decided to do a screening study to evaluate the
impact of the changes and how they interact. 32 They determined that the survey
needed to incorporate only 2'5•1 or 16 different clinic scenarios to give a
preliminary sense of which combination of change concepts is most important.
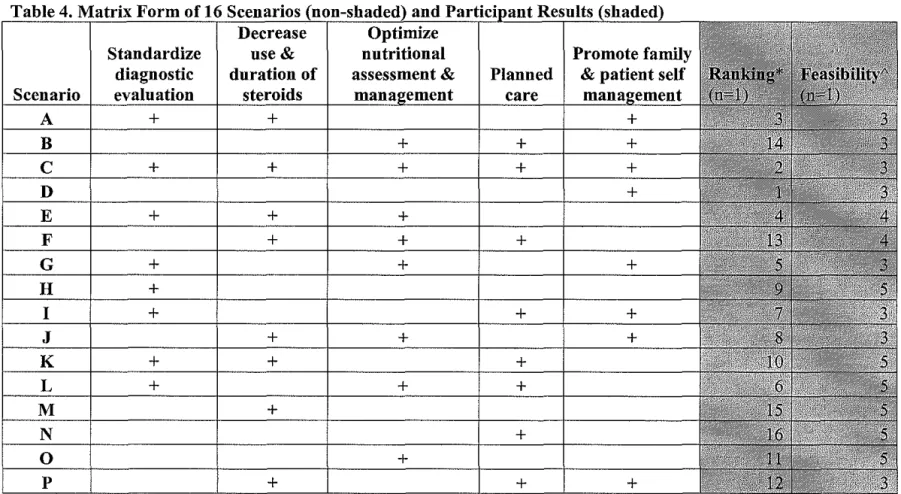
The non-shaded columns of Table 4 summarize the 16 clinic scenarios in matrix
form and Appendix C shows the 16 scenarios in paragraph form. Therefore, to
interpret scenario A in row I of Table 4, please refer to "Scenario A" in Appendix
C. In the survey, the 16 scenarios were presented in a random order, and within
each scenario the change concepts were also presented in random order.
Before administering the survey, we piloted the survey twice. The first
time, we provided 17 physicians and nurse practitioners with 16 scenarios in
matrix form and in paragraph form. The matrix form quickly summarizes all of
the scenarios in one table, but it may not be clear what it means to implement a
change concept. Therefore, we developed a paragraph form for each scenario to
describe only the changes that were to be implemented. We provided participants
with both forms of the scenarios to ensure that each participant understood the
scenarios. Pilot participants were then asked to rank the scenarios according to
most likely to improve outcomes and to rate the feasibility of each scenario.
In general, people reported that they were able to understand and rank the
scenarios. Some of the participants reported that the survey only took 15 minutes
because they looked at the matrix and based on the number of changes
Shilpa McManus 24
preferred the paragraphs, but then to rank the scenarios they would extract how
many changes were implemented in each scenario.
The results showed that the survey had good face validity, because the
scenarios we expected to improve outcomes were given a ranking between 1 and
5 rather than 11 and 16. Figure 2 shows a dot diagram of the effect size of each
change concept and the effect size of the interaction for each pair of change
concepts. According to the dot diagram, decreasing steroid use (RX) is the change
concept with the largest effect size because it is the furthest away from zero.
When looking at the effect size of each pair, all of the pairs are around zero,
suggesting no interaction between change concepts. In other words, no 2 change
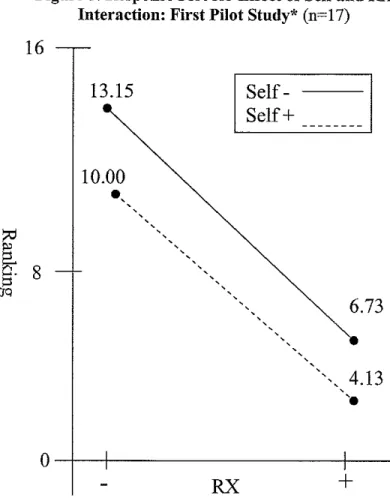
concepts seemed to work synergistically. The response plot in Figure 3 shows this
lack of interaction graphically because the two lines are ahnost parallel. When
decreasing use and duration of steroids is added to a scenario, the average ranking
of the scenario is 6 points higher. Then, if patient and family self management is
added to the scenario, the average ranking is about 3 points higher, independent of
the presence of steroid use.
Although we had no hypothesis for which two change concepts would
have an interaction, we expected to find at least one interaction. We believe we
saw no interaction because by ranking scenarios based on number of changes
implemented, participants are not focusing on the scenario as a whole. They are
not thinking that 2 specific changes, such as self management and reducing
steroids, are more effective at improving outcomes than standard diagnostic
To address the lack of interaction, we piloted the survey a second time on
2 different providers (1 physician and 1 nurse practitioner). We provided this
group with the 16 scenarios in paragraph form only. This time, the scenarios
described both change concepts that were implemented and not implemented. We
felt that by only providing the paragraph form and by describing both the
implemented and not implemented change concepts, providers would have a
harder time determining how many changes were implemented. Providers would
be forced to look at the scenarios as a gestalt and give a ranking rather than
systematically comparing the changes in each scenario. To discourage participants
from taking the paragraph form of the scenarios and creating their own matrix, we
asked them to spend no more than 30 minutes on the survey.
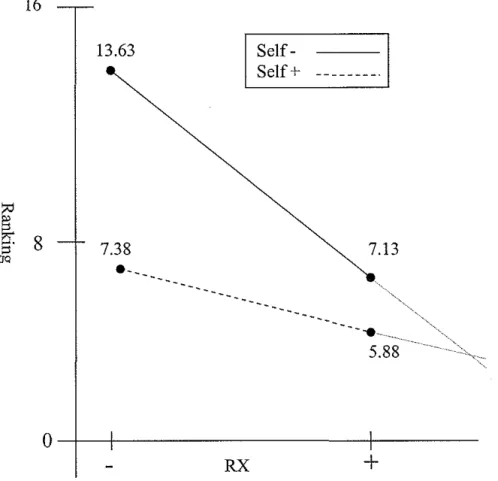
The conjoint analysis showed that the survey had good face validity and,
as expected, showed an interaction between 2 change concepts. Figure 4 shows a
dot diagram of the results from the 2 providers. Similar to the first pilot study, the
change concept with the largest effect size is reducing steroid use (RX) because it
is the furthest away from zero. The largest interaction is between decreasing
steroid use and self management because this effect size is furthest away from
zero. This interaction can be seen visually by the intersecting lines in Figure 5.
The response plot shows that the effect of decreasing steroid use is dependent on
patient and self management and vice versa. Therefore, adding decreasing steroid
use to a scenario increases ranking by 6.5 points if self management is absent but
Shilpa McManus 26
management to a scenario increases ranking by 6.25 points if decreasing steroid
use is absent but only by 1.25 if decreasing steroid use is present.
Although both participants in the second pilot study recommended that the
scenarios be shortened or provided in bullet format, we believed that the long
scenarios accurately measured which change concepts were most important and
had the ability to detect an interaction between 2 change concepts. Therefore, the
survey format for this study is the same as the survey in our second pilot study.
The University of North Carolina at Chapel Hill Institutional Review Board
approved this final version of our survey.
Data Collection
Participants were emailed a cover letter which explained the purpose of
this study, a copy of the questionnaire, and the definitions of the change concepts
(Appendix B). If participants chose to enter the study then they consented to the
study and filled out the survey anonymously at www.zoomerang.com. At the end
of one week, each potential participant received an email reminding them to
complete the Physicians Beliefs on Crohn' s Management Survey if they have not
already done so and thanking those that had already responded. At the end of 3
weeks, participants completed the study and were no longer contacted.
Participants did not receive any incentive to complete the survey. Data was
collected by www.zoomerang.com and then exported to Microsoft Excel.
From the first two questions, we gathered data on the rank order and
feasibility of the scenarios. The next two questions collected data on participant
practicing pediatric gastroenterology. The last 3 questions gathered the following
data on the practice: I) practice location; 2) practice setting; and 3) number of
new patients with CD the practice sees in a year.
Data Analysis
To analyze the rankings, we used Study It software 33, which is a statistical
package for running conjoint analysis. We first calculated the average ranking and
average feasibility rating for each scenario. Then we determined the effect
measurement of each change concept, and the effect measurement of the
interaction between change concepts.
L
Results
Participant Characteristics
Of the 12 physicians that were contacted, 1 physician completed the
survey for a response rate of 8.3%. The participant is a white male who has been
practicing pediatric gastroenterology for 15 years. He currently works for an
urban group practice that sees about 20 new patients with Crohn's disease every
year.
Conjoint Analysis Data
The reported rankings and feasibility for each scenario are summarized in
the 2 shaded colunms of Table 4. The participant ranked scenario D, which
promoted family and patient self management, as the most likely to improve
outcomes for patients with Crohn's disease. Scenario C, which implemented al15
Shilpa McManus 28
use and duration of steroids, and scenario N, which implemented planned care, as
least likely to improve outcomes. The participant reported that no scenarios were
very feasible (rating of 1 or 2). Scenarios Hand K-0 were all rated as being the
least feasible.
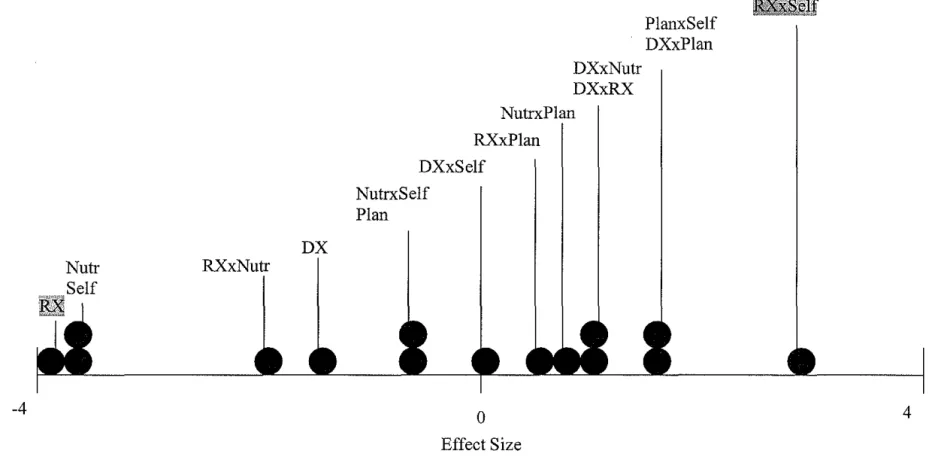
The effect of each change concept on ranking is summarized in Table 5.
These results are also shown graphically in the dot diagram in Figure 6. The
change concept most likely to improve outcomes is decreasing steroid use and
duration (RX) because this concept has the largest effect size to the left of zero.
On average, adding decreasing use and duration of steroids to a scenario increased
ranking by 3 points. On the other hand, optimizing nutritional assessment and
management (Nutr) and planned care (Plan) are the change concepts with the
largest effect size to the right of zero. Adding one of those two concepts to a
clinical scenario decreased its ranking by 4.25. Therefore, in the view of this
respondent, these two change concepts are not likely to improve outcomes.
The effect of interaction between two change concepts on ranking is
shown in Figure 6. The pair of concepts that is furthest away from zero, and
therefore has the largest effect size, is standardized diagnostic evaluation and
planned care. This interaction is shown in Figure 7 by the two intersecting lines.
The response plot shows that the effect of standardized diagnostic evaluation is
dependent on planned care and vice versa. Therefore, adding standardized
diagnostic evaluation to a scenario decreases ranking by 5.75 points if planned
care is absent but only by 0.25 if planned care is present. Similarly, adding
diagnostic evaluation is absent but only by 1.25 if standardized diagnostic
evaluation is present.
Discussion
The goal of this study was to determine if conjoint analysis can be used to
summarize current beliefs among pediatric gastroenterologists regarding the best
way to change current CD management. Our results suggest that, according to one
expert in the field, the change concept most likely to improve outcomes in
pediatric CD patients is decreasing use and duration of steroids while the change
concepts least likely to improve outcomes are planned care and optimizing
nutritional assessment and management. The conjoint analysis shows that
standardized diagnostic evaluation and planned care have the largest interaction
effect.
Although no studies have used conjoint analysis to determine which
attributes of disease management physicians believe are most important, many
studies have used conjoint analysis to determine patient preferences for
treatment.21'23'34 For example, using conjoint analysis, Johansson et al.
determined that most asthma patients prefer using a combination inhaler for both
acute asthma attacks and maintenance therapy.21 They also concluded that
patients were willing to pay more for their preferred medications. Only one study,
by Brown, Swinyard, and Ogle, used conjoint analysis to determine physician
Shilpa McManus 30
preferences for their patients, they surveyed physicians on the value of different
attributes regarding potential job offers.
The conjoint method used in this analysis was a traditional full profile
conjoint analysis. Stanek eta!. used this method to study individual preferences
for congestive heart failure treatment outcomes?4 Each study participant was
given 16 different health state scenarios and were asked to rate them from 0 (least
desirable) to 10 (most desirable). Each scenario was written as bulleted points
rather than paragraph form. In this study, we chose not to write our scenarios as
bulleted points because we were worried that participants would dissect each
scenario as they ranked them rather than looking at the scenario as a whole. This
could lead to an analysis with no interaction effects. On the other hand, the
paragraph form may be so overwhelming for participants that they can no longer
differentiate between them, making the results unreliable.
Based on our literature review7 and reviews on steroid use for CD,4•28
consensus exists in the literature about the importance of decreasing use and
duration of steroids. Aminosalicylates are considered first-line treatment, but for
patients who are steroid dependent, the thiopurine agents should be used to reduce
steroid use? This consensus in the literature supports our result of decreasing
steroid use as the change concept most likely to improve outcomes.
Guidelines for optimizing nutrition from our literature review clearly state
the importance of nutrition screening for all children with IBD and the use of
enteral or parenteral nutrition for children with growth retardation. 27 Therefore,
concept that is unlikely to improve outcomes is unexpected. This may be because
the respondent felt that optimizing nutrition was not feasible and therefore would
be ineffective. On the other hand, his past experiences may have shown him that
optimizing nutrition does not improve outcomes.
Finally, our results also suggest that, in the view of one gastroenterologist,
introducing planned care to CD management would not be likely to improve
outcomes. Since the literature regarding this change concept is limited, this belief
maybe based on the physician's own experiences with planned care. Planned care
requires the interaction of professionals from different disciplines, which may
affect feasibility. Therefore, our participant may have felt that planned care at
most CD clinics would be minimal and play a small role in improving outcomes.
It is difficult to know if conjoint analysis can accurately summarize
current beliefs among pediatric gastroenterologists for CD management because
only one physician responded to our survey. The limited sample also makes it
difficult to draw any conclusions from the results, because our study sample may
not be representative of all the PIBD network members. To strengthen our results,
we will need to increase our sample size by administering the survey to more
PIBD network members. To improve our response rate, we may have to provide
physicians an incentive because the survey can take an hour of their time. Or,
rather than administer the survey online, it may be easier to administer in person
because we could place each scenario on an index card and ask participants to
Shilpa McManus 32
survey to all of the PIBD Network members who will be participating in the
improvement collaborative that will begin in the fall of2006.
Conclusion
Variation in diagnostic evaluation and treatment therapies for pediatric CD
exists and our systematic literature review shows limited consensus on the best
way to manage pediatric CD. Therefore, we must rely on data gathered from
experts in pediatric gastroenterology to identify the best way to manage CD.
Conjoint analysis, a tool used in quality improvement, has been used to
measure patient preferences for treatment, but our results suggest it can be used to
summarize current beliefs among physicians. However, the low response rate of
this study requires repeating this study with a larger sample before it can be used
reliably.
Acknowledgements
Figure 1. Flow Diagram of Systematic Review
Searching Ovid, Pubmed, and Clearinghouse guidelines, found 73 potential articles
Searching references of relevant articles and talking to experts, found 4 relevant articles
•
9 articles assessed as relevantt
~
7 abstracts were relevant to guidelines for pediatric IBD
~
~
4 articles met
inclusion criteria
•
Total of 5 articles were accepted and critically appraised
2 abstracts did not meet outcome
criteria
3 articles did not
meet outcome
criteria
2 abstracts and 1
article did not
meet outcome
criteria
Inclusion Criteria •Published in English
~-~A- ~· E
. A-- --
G-
---
Seal-
--Grade Score
Poor <8
Fair 8- 14
Good > 14
Table 2. Evidence Table25
Guideline Format& Development
Table 2.Cont. Identification & Summary of Evidence
Method of identifying scientific evidence specified
Formulation of
I
Role of value judgments used Recommendations by guideline developers inmaking recommendations is discussed
ESPGHAN
no
Escher et al Sands et al. Scott et al ASPEN
Shilpa McManus 36
Table 2.Cont.
Total Score* Grade
Table 3. Descriptions of Change Concepts in Clinical Scenarios
Chan~:e Implemented Change Not Implemented
Standardize You use a standardized diagnostic evaluation to stratify You develop a diagnostic evaluation Diagnostic patients by disease severity and type. plan for new patients according to the
Evaluation patient's presentation.
Optimize You assess nutritional status at every visit and classify For most of your patients, you Nutritional the patients' nutritional status as at risk, in nutritional identify, evaluate and manage Assessment and failure, or acceptable and then treat accordingly. nutritional or growth failure. Management
Planned care Each of your patients is assigned a care team which You review the patient's medical meets each week to review goals and plan interventions record at each visit.
for the patients scheduled during the upcoming week.
Promote Patient & You promote patient and family self management by You continue to educate patients and Family Self- meeting with the patients, their families, and other care their families as you do now.
Management providers to set goals in areas such as school attendance and disease management and then develop interventions to reach each goal.
Decrease Use and Patients that you classify as having moderate to severe You provide patients individualized Duration of Steroids disease enter an evidence-based protocol to reduce treatment based on your analysis of
steroid use through the safe and effective use of their disease severity. mercaptopurine and other steroid sparing agents.
Shilpa McManus 38
Table 4. Matrix Form of 16 Scenanos (non-shaded) and Participant Results
Decrease Optimize
Standardize use& nutritional
I
Promote familydiagnostic duration of assessment & Planned & patient self
Scenario evaluation steroids management care
A
+
+
I+
B
+
+
c
+
+
-D
-E
+
+
+
F
+
+
I
+
G
+
+
l
I+
H
+
I
+
+
I
+
J
+
+
l
+
K
+
+
+
L
+
+
+
M
+
N
+
0
+
p
+
I
+
I
+
*Ranking is on a scale of I to 16 where I is most likely to improve outcomes and 16 is least likely to improve outcomes.
Figure 2. Dot Diagram Results: First Pilot Study (n=l7)
~
. .-6.15 -3.1
Plan DX
NutrxPlan DXxPlan
BBI
PlanxSelf NutrxSelf DXxNutrRXxPlan DXxSelf DXxRx
RXxNutr
0
Effect Size
RX =Decrease use and duration of steroids, Nutr = Optimize Nutritional Assessment and Management, Self= Promote patient & family self-management, Plan= Planned Care, DX =Standardize diagnostic evaluation, x =interaction (such that DXxNutr refers to the interaction of Standardize diagnostic evaluation and Optimize Nutritional Assessment and Management, etc.)
Figure 3. Response Plot for Effect of Self and RX Interaction: First Pilot Study* (n=17)
16
13.15
10.00
•,,
' '
' '
' '
' '
6.73
'' '
4.13
',•
0-+--~---~---RX
+
*Self= Promote patient & family self-management, RX = Decrease use and duration of steroids, ( +) means the change concept is implemented while (-) means the it is not implemented
-4
Figure 4. Dot Diagram Results: Second Pilot Study (n=2)
DX RXxNutr
DXxNutr DXxRX NutrxPlan
RXxP!an DXxSelf
NutrxSelf Plan
0
Effect Size
PlanxSelf DXxPlan
~!Ji
4
RX ~Decrease use and duration of steroids, Nutr ~ Optimize Nutritional Assessment and Management, Self= Promote patient & family
self-management, Plan~ Planned Care, DX ~Standardize diagnostic evaluation, x ~interaction (such that DXxNutr refers to the interaction of Standardize
diagnostic evaluation and Optimize Nutritional Assessment and Management, etc.)
Shilpa McManus 42
Figure 5. Response Plot for Effect of Self and RX Interaction:
16
8
Second Pilot Study* (n=2)
13.63
7.38
·-- Self-Self+
7.13
-
..
5.88
0-+--r---+---RX
+
*Self~ Promote patient & family self-management, RX ~Decrease use and duration of steroids, ( +) means the change concept is implemented while (-)
means the it is not implemented
Table 5. Effect of Change Concept on Ranking (n= 1 )*
Change Concept Effect on Ranking
Standardize Diagnostic Evaluation 2.75
Optimize Nutritional Assessment and
Management 4.25
Planned Care 4.25
Promote Patient & Family Self-Management -0.25
Decrease Use and Duration of Steroids
-3.00
*A negative effect means that ranking is increased and a positive effect means that ranking is decreased. A higher ranking is more likely to improve outcomes and a
Figure 6. Dot Diagram Results (n=l)
DXxSelf DXxRX
-4.25
RXxPlan
I
DXxNutr
RXxSelf RXxNutr Self
0
Effect Size
PlanxSelf NutrxSelf NutrxPlan
DX
4.25
RX =Decrease use aud duration of steroids, Nutr = Optimize Nutritional Assessment and Management, Self= Promote patient & family
Shilpa McManus 44
Figure 7. Response Plot for Effect of Plan and DX
16
8
10.75
Interaction*(n=l)
Plan-Plan+
10.50
.
---
-·
·--~'----9.25
3.50
0-+--+---+----DX
+
Appendix A. Steps for Phase 0 of the Idealized Design Process16 Step I: Select a topic
Step 2: Obtain funding
Step 3: Select a team
Step 4: Develop a charter- describe goals by answering the following 3
. 11
questions
• What are we trying to accomplish?
• How will we know that a change is an improvement?
• What changes can we make that will result in improvement?
Step 5: Capture what you know -review failures in current system and conduct a
literature review
Step 6: Select a high quality organization- select a clinic with good outcomes for
their patients
Step 7: Observe the clinic- determine the setting, how patients are behaving,
interview groups, review available documents
Step 8: Synthesize- brainstorm ideas using diagrams, mind mapping, post-its
Step 9*: Screen- determine if ideas are desirable, different, feasible, and better
than current practice; use conjoint analysis to narrow down the ideas
Step 10: Expert meeting - experts review ideas and provide new insights
Shilpa McManus 46
Appendix B. Definitions of Change Concepts
Standardize Diagnostic Evaluation. Standardize diagnostic evaluation and stratify patients by disease severity and type. Disease severity is determined by
evaluating signs and symptoms using a structured assessment tool (e.g., a
checklist).1 Disease type is determined using radiographic, endoscopic, and
pathologic findings and specific staging criteria (e.g., Vienna criteria).
Optimize Nutritional Assessment and Management. Stratify and manage patients according to their risk for nutritional or growth failure using BMI
percentiles and height for age percentile. Patients with height z-scores less than 1
below the mid-parental height z-score or patients in the 1 01h -25th BMI percentile
are categorized as "at risk" and are evaluated for nutritional failure. Patients with
height z-scores less than 2 below the mid-parental height z-score or patients in the
<1 01h BMI percentile are categorized as having nutritional failure and are
evaluated and treated.
Planned Care. A care team (e.g., nurse coordinator or advanced practice nurse, dietician, and MD) is assigned to each patient and meets each week to review
patients scheduled for the upcoming week. The review encompasses
determination of disease activity, assessment of nutritional status, assessment of
functional activity, and a review of the medication list. After identifying areas to
focus on, interventions are planned to address each focus area.
1
Diagnostic studies include complete blood count, serum albumin, ESR, C-reactive protein, liver profile, and
Promote Patient & Family Self-Management. To promote patient and family self management, patients, their families, and care providers set goals in areas
such as school attendance, extracurricular activities, disease control, emergency
action plan, medical management, and adherence to medical management and
then develop interventions to reach each goal. Health care providers also use
educational tools to teach patients how to care for their own disease.
Decrease Use and Duration of Steroids. Patients classified as having moderate to severe disease enter an evidence-based protocol to reduce steroid use through
the safe and effective use of mercaptopurine or other steroid sparing agents. For
example, patients who start treatment with mercaptopurine are treated, monitored
and assessed in a standard fashion. Deviations from the protocol are identified and
Shilpa McManus 48
Appendix C. Paragraph Form of 16 Clinic Scenarios Scenario A
You use a standardized diagnostic evaluation to stratify patients by disease severity and type. Patients that you classify as having moderate to severe disease enter an evidence-based protocol to reduce steroid use through the safe and effective use of mercaptopurine and other steroid sparing agents. You review the patient's medical record at each visit For most of your patients, you identify, evaluate and manage nutritional or growth failure. You promote patient and family self management by meeting with the patients, their families, and other care providers to set goals in areas such as school attendance and disease management and then develop interventions to reach each goaL
Scenario B
Each of your patients is assigned a care team which meets each week to review goals and plan interventions for the patients scheduled during the upcoming week. You develop a diagnostic evaluation plan for new patients according to the
patient's presentation. You provide patients individualized treatment based on your analysis of their disease severity. You assess nutritional status at every visit and classify the patients' nutritional status as at risk, in nutritional failure, or acceptable and then treat accordingly. You promote patient and family self management by meeting with the patients, their families, and other care providers to set goals in areas such as school attendance and disease management and then develop interventions to reach each goaL
Scenario C
You use a standardized diagnostic evaluation to stratify patients by disease severity and type. Patients that you classify as having moderate to severe disease enter an evidence-based protocol to reduce steroid use through the safe and effective use of mercaptopurine and other steroid sparing agents. You assess nutritional status at every visit and classify the patients' nutritional status as at risk, in nutritional failure, or acceptable and then treat accordingly. Each of your patients is assigned a care team which meets each week to review goals and plan interventions for the patients scheduled during the upcoming week. You promote patient and family self management by meeting with the patients, their families, and other care providers to set goals in areas such as school attendance and disease management and then develop interventions to reach each goaL
Scenario D
to set goals in areas such as school attendance and disease management and then develop interventions to reach each goaL
Scenario E
You review the patient's medical record at each visit. You use a standardized diagnostic evaluation to stratify patients by disease severity and type. Patients that you classify as having moderate to severe disease enter an evidence-based
protocol to reduce steroid use through the safe and effective use of
mercaptopurine and other steroid sparing agents. You assess nutritional status at every visit and classify the patients' nutritional status as at risk, in nutritional failure, or acceptable and then treat accordingly. You continue to educate patients and their families as you do now.
Scenario F
Each of your patients is assigned a care team which meets each week to review goals and plan interventions for the patients scheduled during the upcoming week. You continue to educate patients and their families as you do now. You develop a diagnostic evaluation plan for new patients according to the patient's presentation. Patients that you classify as having moderate to severe disease enter an evidence-based protocol to reduce steroid use through the safe and effective use of
mercaptopurine and other steroid sparing agents. You assess nutritional status at every visit and classify the patients' nutritional status as at risk, in nutritional failure, or acceptable and then treat accordingly.
Scenario G
You review the patient's medical record at each visit. You use a standardized diagnostic evaluation to stratify patients by disease severity and type. You provide patients individualized treatment based on your analysis of their disease severity. You promote patient and family self management by meeting with the patients, their families, and other care providers to set goals in areas such as school
attendance and disease management and then develop interventions to reach each goaL You assess nutritional status at every visit and classify the patients'
nutritional status as at risk, in nutritional failure, or acceptable and then treat accordingly.
Scenario H
You provide patients individualized treatment based on your analysis of their disease severity. For most of your patients, you identify, evaluate and manage nutritional or growth failure. You review the patient's medical record at each visit. You continue to educate patients and their families as you do now. You use a standardized diagnostic evaluation to stratify patients by disease severity and type.
Scenario I
You promote patient and family self management by meeting with the patients, their families, and other care providers to set goals in areas such as school