ROBERT J. EMERY. Retention and Subsequent Release of Radioactivity from the Incineration of Wastes Containing Microspheres. (Under the direction of Dr. James E. Watson, Jr. and Dr. Daniel D. Sprau.)
ABSTRACT
Incineration has been chosen as the preferred method for
disposing of animal carcasses containing radioactive microspheres at East Carolina University. Routine surveys of ash from successive non-radioactive burns have shown significant
contamination from previously incinerated microspheres. Past studies on microsphere incineration quantified the amount of
activity retained in ash, but did not address any subsequent
releases. This topic was not considered in earlier studies because, in most cases, the carcasses were placed in some type of
container to facilitate recovery of ash, preventing contamination
of the incinerator refractory.
Five sets of controlled burns were performed to quantify the subsequent releases of the microsphere radioisotopes Ce-141, Sn-113, Ru-103, Nb-95, and Sc-46. Each set consisted of three
successive burns. The first burn of each set incinerated a non¬ radioactive carcass, the second burn, a radioactive carcass, and
Ill floor, as is the standard procedure during normal operations.
iv
TABLE OF CONTENTS
ABSTRACT... ii
TABLE OF CONTENTS... iv
LIST OF FIGURES... vi
LIST OF TABLES... vii
ACKNOWLEDGEMENTS ... viii
I. INTRODUCTION ... 1
A. Purpose of Project... 1
B. Literature Review ... 1
1. Microspheres and Their Applications ... 1
a. Historical Development ... 1
b. Physical Description ... 3
c. Quality Assurance ... 6
d. Experimental Applications ... 9
e. Wastes Generated ... 11
2. Review of Available Disposal Methods ... 12
3. Previous Microsphere Incineration Studies ... 14
II. MATERIALS AND METHODS... 21
A. Incinerator... 21
B. Stack Sampling System ... 24
C. Vacuum System... 25
D. Multichannel Analyzer System ... 26
E. Experimental Design ... 33
1. Objectives... 33
2. Limiting Factors ... 34
; 3. Determination of Actual Activity and Analysis of Error... 38
4. Incineration Procedures ... 40
5. Stack Monitoring ... 40
6. Ash Removal and Sample Preparation... 42
7. Determination of Radioactivity in Ash Samples . 43 8. Refractory Swipes ... 43
III. RESULTS AND DISCUSSION... 45
A. Radioactivity Detected in Ash Samples ... 45
B. Radioactivity Detected in Swipe Samples ... 58
C. Radioactivity Detected in Stack Emissions ... 58
APPENDICES... 67
A. SUMMARY REPORTS OF ASH DATA... 68
B. SOURCES OF ERROR AND DETERMINATION OF
RETAINED FRACTION ... 7 4
LIST OF FIGURES
Page 1. Detail of Incinerator Stack... 23
2. MCA Spectrum of Microsphere Isotopes... 37 3. Percent Mass Reduction of Type IV Waste
From One Hour Burn... 46
4. Retention in Ash From the Incineration
of Ce-141 Microspheres... 50
5. Retention in Ash From the Incineration
of Sn-113 Microspheres... 52
6. Retention in Ash From the Incineration
of Ru-103 Microspheres... 54
7. Retention in Ash From the Incineration
of Nb-95 Microspheres... 56
8. Retention in Ash From the Incineration
of Sc-46 Microspheres... 57
9. Location of Stack Sampling Points... 84 10. Average Stack Temperatures From Six
Experimental Burns... 87
11. Average Stack Velocity From Six
Vll
LIST OF TABLES
Page
1. Half-Lives and Principal Photon Energies of
Gamma Emitting Radionuclides Used in Microspheres... 5 2. NEN-Trac Microsphere Sizes... 8
3. Blood Samples Withdrawn at 12 Second Intervals
Immediately After Microsphere Injection to
Verify Tracer Deposition... 10 4. Summary of Available Data: Ash Retention and
Effluent Concentrations (in Percent) for
Five Microsphere Isotopes to be Incinerated
at E.C.U. School of Medicine... 20
5. Incinerator Specifications... 22 6. Background Levels for Counting Configurations... 28 7. Lower Limits of Detection
for Counting Configurations... 30 8. Detection Efficiencies for Two Counting
Configurations Using a 12 Hour Count... 32 9. Total Percent Retention of Microsphere
ACKNOWLEDGEMENTS
This report represents the culmination of a extended academic
pursuit, so I am indebted to many individuals for their help along
the way.
I am very thankful for the guidance provided by Professor
James Watson, who served as my Advisor. His constant accessability
for comment and helpful attitude made him a true pleasure to work with. ,
I would also like to thank Dr. Alvis Turner for his editorial
and scientific comments as a reader of this report. He provided
an important service by viewing this work with a critical eye,
especially from the perspective of hazardous waste implications. A special thanks goes to Dr. Daniel Sprau for his assistance with this project. He acted as an on-site advisor for this project and served as a reader of this report. He has enthusiastically
supported all of my educational endeavors, and for this, I am
eternally grateful.
The support offered by the East Carolina University Office of Radiation Safety, as well as the Administration of the East
Carolina University School of Medicine is also greatly
appreciated. Dr. Dean Hayek, Associate Dean, ECU School of Medicine, has been especially supportive of my efforts. Many other
individuals, too numerous to mention here, gave assistance with technical problems, printing, graphics, and the like.
IX
Harris for his help. Ralton provided a critical review of this work in its early stages, and was always available to lend his expertise on the various environmental monitoring problems that
I encountered.
Finally, I would like to thank my fiancee Maureen Triller, whose support and encouragement throughout the completion of this project has been unbelievable. I hope that some day I can be as
A. Purpose of Project
Incineration has been chosen as the preferred method of
disposal for animal carcasses containing radioactive microspheres at the East Carolina University School of Medicine. The routine monitoring of incinerator ash from non-radioactive burns has revealed significant contamination from previously incinerated
microsphere isotopes. Several published studies have documented
ash retention of radioactivity, but none have addressed these apparent subsequent releases.
This study will attempt to document the successive subsequent releases of radioactivity from the incineration of microspheres by performing a series of controlled burns using both radioactive
and non-radioactive animal carcasses. This data will be used to
develop a comprehensive program for the monitoring and disposal of incinerator ash for East Carolina University, and establish limits for the amounts of radioactive microspheres which may be burned.
B. Literature Review
1. Microspheres and Their Applications a. Historical Development
2
parameters as the distribution of blood flow, cardiac output, and
organ shunting.•'
ͣ
The ability in recent years to accurately
regulate the size of these particles and to incorporate radioactive isotope labels has created a marked increase in their
popularity as a research tool.^ Radioactive tracers, commonly
called "microspheres" assist researchers in the detection and
quantification of particle retention in various tissues, hence indicating flow patterns and destinations of different blood
components.
The first radioactive foreign particles used for circulatory
studies were produced by exposing small glass beads to a neutron
flux which transformed the stable sodium in the glass into
radioactive Na-24.-^ Intended to imitate red blood cells once
injected in the animal, these miniature glass beads were too heavy
and therefore did not accurately mimic the behavior of normal erythrocytes. Microspheres made of ceramic were also produced, but these were also deemed inappropriate because of their tendency to quickly settle in a liquid medium.
Heymann, M.A., Payne, B.D., Hoffman, J., and Rudolph, A.M.,
"Blood Flow Measurements With Radionuclide-labeled Particles", Progress in Cardiovascular Diseases, Vol. XX, No. 1, 1977, p. 55.
^Heymann, M.A., et. al., p. 55.
•^Grim, E., Lindseth, P.O., "Distribution of Blood Flow to
Tissues of the Small Intestine of the Dog.", University of Minnesota Medical Bulletin, No. 30, 1958, pp. 138-145.
A wide variety of plastic microspheres were subsequently developed. Early versions resulted in batches of microspheres with wide variations in particle size and the tendency to permit
leaching of the radionuclide label.^ Any results obtained from
experiments with these tracers needed to be viewed with caution
due to the large degree of error introduced by these
characteristics.
Advances in manufacturing technology have resulted in
microspheres of a constant particle size and in a form that
prevents leaching. These current radioactive tracers are also
available with different isotope labels so as to permit the use of several different microspheres in one experiment.
b. Physical Description
One of the most popular nuclide-labeled microspheres in use
today is the insoluble carbonized plastic tracer microsphere
produced by the DuPont NEN Research Products, Boston,
Massachusetts. These tracers are used exclusively at the East
Carolina University School of Medicine. Marketed under the name
"NEN Trac Microspheres", these tracers are attractive for use in
circulatory studies because:
^Rhodes, B.A., Zolle, I., Buchanan, J.W., et al, "Radioactive
4
The microspheres have a specific gravity of approximately
1.3, which is comparable to that of whole blood (1.05).^
The microspheres are available in standard diameters ranging from 10+2 to 50+5 microns. This enables
researchers to select a microsphere size which correlates
with the blood constituent of interest.^
Ten different gamma emitting isotopes are available,
permitting the use of several different tracers with
energies discrete enough for easy analytic detection and
segregation (see Table 1). They are: Gd-153, Co-57,
Ce-141, Cr-51, Sn-113, In-144m, Ru-103, Sr-85, Nb-95, and
Sc-46. The half-lives and principal photon energies of
each isotope are listed in Table 2. When used incombinations, the manufacturer recommends that a minimum
of 100 keV energy separation be maintained between
principal photon energy peaks.°
NEN-Trac Microspheres Catalog, E. I. duPont De Nemours & Co. Biotechnology Systems Division, Boston, Mass. 1986.
^New England Nuclear Research Products Catalog, E. I. duPont
De Nemours & Co., Boston, Mass., 1988. pp. 137-139.
139.
137-Half Lives and Principal Photon Energies of Ganuaa Emitting Radionuclides Used in Microspheres
Radionuclide Half Life Photon Energy_____Photon Abundance
Gd-153 242 days 97-103 keV 55%
(also 41 keV) (100%)
Co-57 271 days 122-136 keV 98%
Ce-141 32.5 days 145 keV 48%
Cr-51 27.8 days 320 kev 9%
Sn-113 115 days 393 keV 64%
(also 255 keV) (2%)
In-114m 49.5 days 192 keV 17%
(also 558 keV 3.5%
and 725 keV) 3.5%
Ru-103 39.8 days 497 keV 88%
(also 610 keV) (6%)
Nb-95 35 days 765 keV 100%
Sr-85 64.7 days 514 keV 100%
Sc-46 84 days 889 keV 100%
f^^^^^^l^Wr^^^^^^^
The radionuclide tracer is incorporated into the plastic
matrix of the sphere to prevent leaching. Quality control
testing is performed at the factory to ensure tracer integrity.'c. Quality Assurance
The microsphere shipments received at the East Carolina
University School of Medicine are suspended in a 10% by volume
polyoxethylene 80 sorbant monooleate (Tween 80).-'
ͣ
^ Tween 80, a
detergent, is added to prevent aggregation of the microspheres.
(It should be noted that it is also possible to receive
microspheres in a dry state.) After the standard check-in
procedure by the Office of Radiation Safety, which is performed
on all radioactive shipments, several other verifications are
conducted by the actual user of the microspheres.
It is of paramount importance to confirm the actual size of
the microspheres received. A standard accepted procedure
established by Heymann, et. al. in 1977, calls for microscopic
examination of several grab samples. Diameter measurements are^New England Nuclear Research Products Catalog, 1988, pp.
137-139.
-*- New England Nuclear Research Products Catalog, 1988, pp.
137-139.
ͣ
'
ͣͣ
^Heymann, M.A. , Payne, B.D., Hoffman, J., and Rudolph, A.M.,
"Blood Flow Measurements With Radionuclide-labeled
made on 100 to 200 tracers, and their ranges plotted on a
histogram. The acceptable range of diameter size is directly
dependent upon the size of the microsphere ordered. The diameter
range data provided by New England Nuclear Company through their
Technical Services Division is listed in Table 2.
While under the microscope, a check is made for any clumping
or aggregations of microspheres. Adhesions caused by bacterial
growths in the solution can be broken up by vigorous shaking. Of
greater concern is "bridging" that can occur between the spheres.
Thin plastic strips sometimes still connect the spheres as a
result of the manufacturing process. These bonds are not easily
broken, and are cause for rejection of the batch.
A gamma spectral analysis is performed on each separate batch
of microspheres to check for radionuclide specificity. Any
cross-contamination or mislabeling will produce extraneous spectral
peaks.
Soaking the spheres in a 0.5% Tween 80 isotonic saline
solution for 24 hours is the technique used to check for isotope
leaching. After the soaking period, the microspheres are filtered
out, and the remaining solution counted for any residual
radioactivity.
The final check is for specific activity. A sample of the
microspheres is placed on a known field size, such as ordinary
graph paper. A physical count is made of the number of spheres
present in the field, and the total activity of the field is
Table 2
NEN-Trac MICROSPHERE SIZES
Nominal Size and Range______Approximate Number of Tracers/mg
microspheres present, an activity per bead can be obtained.
Upon completion of these verifications, the microspheres are
ready for use.
d. Experimental Applications
Since microspheres can be applied in a variety of experimental situations, it would be very difficult to outline all of the different applications. There are, however, some procedures which
are common throughout most research applications.
Normally an animal is anesthetized and a catheter is inserted into the left atrium of the heart. The left atrium is the location
of preference because of the high mixing of blood that occurs in this area. An initial injection of a well-vortexed 1 ml solution containing microspheres is made as a control. The choice of
microsphere isotopes is randomized to ensure that no selective
retention occurs over a series of experiments. The microsphere
injection is followed by a heparinized saline flush. During, and
immediately following the introduction of the microspheres, a
series of ten 2-3 ml blood samples are drawn. These ten samples
are counted using a Nal crystal connected to a multichannel
analyzer to verify the injection and subsequent deposition of the
microspheres into the tissue. Table 3 shows an example of ten
blood samples taken at 12 second intervals depicting the
introduction of radioactivity into the bloodstream and the totaldeposition of the radioactive material into the tissue in less
10
Table 3
Blood Samples Withdrawn at 12 Second Intervals
Immediately After Injection of Microspheres to Verify
Tracer Deposition
time after
microsphere injection (in counts per minute)
(in seconds)_________Ce-141 Sn-113 Ru-103 Nb-95 Sc-46
0 50 20 23 14 29 12 117 37 29 17 28 24 45063 8476 4050 6010 4943
36 14427 6017 2793 3207 1222
48 1360 634 429 378 156 60 334 159 113 83 53
72 533 127 60 53 64 84 271 86 44 38 81 96 420 102 48 35 73 108 397 124 45 40 63
experimental application of microspheres.
After the control injection is completed, any of a myriad of
stimuli may be performed on the animal. During various stages of
the experiment, different microsphere isotopes are injected, and the same procedure as detailed previously is followed. Using isotopes with different energies for each injection enables a researcher to compare tissue retention of blood components atvarious stages in the procedure.
At the end of the experiment, the animal is sacrificed, and
the tissues of interest excised. The typical method of analyzing the tissue is counting on a multichannel analyzer system with a Nal(Tl) crystal, with the regions of interest on the counter set
for the energies of the gamma rays expected.
Both the carcass and the excised tissue are contaminated with radioactive material and, as such, require special attention for
their disposal.
e. Wastes Generated
At the East Carolina University School of Medicine, the animal
carcasses and any excised tissues are brought to the Radiation
Safety Laboratory upon completion of the experiment. Until their
ultimate disposal is accomplished, the carcasses and tissues aretemporarily stored in freezers. The Office maintains at least 10
freezers for the storage of these types of wastes at all times.
A small amount of solid waste is also generated in the course
12
absorbent paper, tubing, etc.
Currently about 50-70 animal carcasses are being generated per
year. It is estimated that the annual production of animal carcasses containing microspheres at East Carolina University will increase to 150-200 in the next fiscal year.
2. Review of Available Disposal Methods for Radioactive
Carcasses
Three possible methods of disposal for these low-level radioactive biological wastes are currently available. The Office
of Radiation Safety considered (1) burial at a low level
radioactive waste disposal site, (2) storage for decay, or (3) incineration. Incineration was chosen as the preferred method of disposal for the following reasons:
- Cost. The present approximate cost for the burial for one
55 gallon drum of low-level radioactive biological waste is $400. Due to the stringent packaging requirements for
biological wastes, approximately two animals (usually
dogs or pigs) can be placed in each drum. At a generation rate of 200 animals per year, the annual cost for burial
of microsphere-contaminated animals alone would be
$40,000.
Carolina will have uninterrupted access to any low-level
radioactive waste disposal site in the future. Thepermanent closing of the Barnwell, S.C. facility is
scheduled for 1992. Disagreements over the eventual
siting of a new facility could delay any progress towards
a long term solution to the low-level radioactive waste(LLRW) disposal problem.
Lack of Storage Space. At most educational institutions, storage space (especially freezer storage space) is at
a premium, and the East Carolina University School of
Medicine is no exception. The space that would be needed
to adequately store contaminated animal carcasses for a minimum of seven half-lives is simply not available.Possible Packaging and Transportation Violations. The
regulations concerning packaging and shipment of LLRW are
confusing at best, and subject to constant change. Thepossibility of violating some State, Federal, or
contractors regulations during any phase of the packaging
or shipment procedure can result in the loss of
permission to continue shipping waste to a specific
disposal site.
Volume Reduction. The reported volume reduction of animal
14
Incineration would greatly reduce the volume of waste to be shipped for burial, which in turn would reduce waste
disposal costs.
Other Hazardous Wastes. Incineration is the preferred
method of disposal for other types of wastes which may be generated in association with microspheres such as
biohazardous, pathological, infectious, and chemical
wastes. Regulations regarding the disposal of "mixed wastes", when completed, may impose further restrictions
on generators.
Change of Waste Type Classification. Incineration of
animal carcasses transforms the classification of the
waste from a biological to a solid. Solid radioactive
wastes are subject to fewer packaging requirements.
Currently Available and Licensed Incinerator. The Office of Radiation Safety has been using the incinerator at the
East Carolina University School of Medicine since 1981
for the processing of low-level radioactive waste.
Gregory, W.D., and Maillie, H.D., "Incineration of Animal
Radioactive Waste: A Comparative Cost Analysis", Health Physics,
3. Previous Microsphere Incineration Studies
With the advent of the use of incineration as a technology for
LLRW volume reduction, several researchers began to examine the
possibility of burning microsphere-laden waste. When applying for
a license to incinerate radioactive waste, it must be assumed that
100% of the activity is exhausted into the atmosphere for the
purposes of calculating discharges of radioactivity. Preliminary
results indicated that some of the activity in the form of
microspheres was retained in the ash, so studies were performed
in hopes of quantifying ash retention factors so that larger
amounts of waste could be incinerated without exceeding
established air concentration limits for various radionuclides.
Landholt, et. al. performed the first study published on the
actual incineration of microsphere-ladened carcasses.
ͣ
'
ͣ
^ Eight
animals containing Sc-46 labeled plastic tracers were individually
placed directly into the incinerator and burned. The total ash
from each of these burns was collected in a container and countedon a multichannel analyzer system with a 3" x 3" Nal(Tl) crystal.
The mean percentage of retention of Sc-46 for the eight burns was
97.6+7.6%. Effluent monitoring was also performed, but no activity
from the incineration of Sc-46 microspheres was reported. The
total mass reduction ratio of the carcasses was reported to be
25:1. Contamination of ash from successive non-radioactive burns
ͣ
'
ͣ
•^Landholt, R.R., Barton, T.P., Born, G.S., Morris, V.R.,
Vetter, R.J., Zimmerman, N.J., "Evaluation of a Small, Inexpensive
Incinerator for Institutional Radioactive Waste", Health Physics,
16
was not addressed.
Brekke, et. al. monitored the stack effluent from the
incineration of carcasses containing combinations of
microspheres.-^'* These carcasses were placed directly into the
incinerator. No tray or container was utilized to collect the ash
while the carcasses were burned. A modified EPA Method 5 stack
sampling train was used to isokinetically remove a representative
sample of the incinerator stack effluent. All of the radioactivity
collected was retained on a particulate glass fiber filter located
at the front of the sampling train. No significant activity was
found in the HCl bubblers that followed the particulate filter.
The mean percentage of released activity for the microspheres
evaluated were: Sn-113, 12.3+4.9%; Gd-153, 5.0+2.5%; Nb-95,
4.8+1.1%; Co-57, 3.8+3.0%; and Ru-103, 16.5+5.0%. The Ru-103
release was assumed to be elevated due to the oxidation of the Rumetal to the volatile ruthenium tetroxide, RuO^. No postulations
were made concerning the apparent elevated release of tin. The
radioactivity remaining in the incinerator ash was determined for
only two nuclides. The mean ash retention for Nb-95 was 91+24%,
and for Ru-103 was 58+8%. The ash retention for the other isotopes
burned was not evaluated. Contamination of ash from subsequent
burns was not discussed.
Finnegan, et. al. monitored both ash and effluent during the
Brekke, D.D., Landholt, R.R., Zimmerman, N.J., "Measurement
of Effluent Radioactivity During the Incineration of Carcasses
Containing Radioactive Microspheres", Health Physics, Vol. 48, No.
incineration of a mixture of isotopes. ^ The carcasses burned were
placed on stainless steel trays to facilitate ash collection and
removal. Only a gross range of 83-100% ash retention was reported for the isotopes Ce-141, Cr-51, Sn-113, Sr-85, and Sc-46. The stack effluent was sampled via a high volume air sampler with a
particulate filter. No activity was reported to be found in the
effluent by this method of stack sampling. The burns yielded a 95% reduction in weight. Ash from two subsequent non-radioactive burns was also collected and analyzed. Approximately 1 to 5% of the
original activity burned was reported to be contained in these residues.
Classic, et. al. investigated solubility of radionuclides in residual ash resulting from the burning of radioactive
carcasses.
ͣ
'
ͣ
^ During this experiment, microspheres containing
various isotopes were burned while on stainless steel trays, and their percent activity retained in ash obtained. The results for
these radioisotopes were: Sc-46, 95.4+1.1%; Co-57, 76.9+2.3%; Sr-85, 79.3+3.4%. This report also concluded that the ash-retained activity in an insoluble form.
-^-Tinnegan, J.J., Miller,K.L., White, W.J., Bohner, K.R., "Incineration of Animal Carcasses Containing Gamma-Emitting Radioisotopes", Proceedings; 9th Biennial Conference of Campus
Radiation Safety Officers, Columbia, Missouri, June 1983, pp.
20-22.
ͣ
^^Classic, K., Gross, G., Vetter, R.J., "Solubility of
Radionuclides in Ash from the Incineration of Animals", Health
18
Van Swearingen evaluated the ash from three burns of Sc-46 and
Sr-85 ladened microspheres.-'
ͣ
^ Carcasses were placed on a bed of
existing non-radioactive ash and burned. One gram ash samples were
obtained from each burn and counted in a 2" X 2" NaI{Tl) detector
connected to a single channel analyzer. The mean percentage of
retention for Sc-46 was 79.7+12.9%; for Sr-85 86.3+32.8%. The study emphasized that problems exist in the exact determination of initial activity involved in the experiment.
In an attempt to better determine the exact amount of activity
that was initially injected into the animal, Krueger and McLaughlin derived a syringe retention factor by counting several syringes while full of microspheres and then recounting after the
expulsion of the contents.-'•^ The amount of activity in the full
syringe minus the residual activity in the "empty" syringe was
taken to be the true injected activity. Unfortunately, the actual
syringe retention factor used was not included in the report.
Krueger and McLaughlin also analyzed the remaining ash in a more detailed manner than in previous studies. Noting that the ash is in two distinct forms, powder and bone fragments, each constituent
was analyzed separately. The bone samples did reveal some radioactivity, however the possibility of contamination from the
1 7
"^'Van Swearingejif F.L., "Incineration of Microspheres", Lecture Notes; Incineration of Low Level Wastes; 1985, Tucson, Arizona, March 21-23, 1985, pp. U-1 - U-5.
ͣ
^"Krueger, D.J., McLaughlin, J.E., "Residual Radioactivity in
Ash from Incineration of Animal Carcasses Labeled With Radioactive
surrounding ash was not addressed. The results, published as Ash Retention Factors (ARF), were as follows: Gd-153, 67%; Co-57, 148%; Sn-113, 80%; Sr-85, 56%; and Sc-46, 92%. All carcasses were burned while resting on the floor of the incinerator. Although no subsequent releases of activity were investigated, the possibility of contamination of the refractory was mentioned. The unusually
high retention factor for Co-57 was postulated to be caused by
subsequent releases of activity which were trapped in the incinerator lining.
This report provides to-date, a comprehensive survey of the published data concerning microsphere incineration. Table 4 compiles all of the information available for ash retention values
and stack effluent releases for the five isotopes burned at East
Table 4
Summary of Available Data:
Ash Retention and Effluent Concentrations (in Percent) for Five Microspheres to be Incinerated at the
East Carolina University School of Medicine
Study
1 Ce-141
Micros Sn-113
sphere Isotopes
Ru-103 1 Kb-95
Sc~46 1
Landolt et. al. , 1982 in in
ash air
97.6+8%
Brekke et. al., 1985 in in
ash
air
58+8% 91+24%
12.3+5% 16.5+5% 4.8+1%
Finnegan, 1983 in
in ash air
1 83-100%
83-100%83-100% 1
Classic et. al., 1984 in in
ash
air
95.4+1%
Van Swearingen, 1985 in
in ash air
79.7+13% 1
Krueger et. al. , 1986 in in
ash
air
80%
92% 1
to
II. MATERIALS AND METHODS
The equipment used in this study included the East Carolina
University School of Medicine incinerator, a modified isokinetic
stack sampling train, a high efficiency particulate air (HEPA)
filtered vacuum ash collection system, and a Nal(Tl) detector
connected to a multichannel analyzer.
A. Incinerator
The incinerator at the East Carolina University School of
Medicine is an Environmental Control Products, Inc. Model 480E.
This natural gas fired, double chamber, 350 pound per hour
incinerator is manufactured primarily for the burning of Type IV
wastes. (Type IV wastes consists of carcasses, organs, solid
organic wastes containing up to 85% moisture and 5%
non-combustible solids.) The specifications of the incinerator are
listed in Table 5, and a schematic of the structure is shown in
Figure 1. The incinerator was installed in 1980 on a 5 inches
thick concrete floor of a room in the Utility Plant Building,
located 500 feet from the main building of the Medical School. The
primary and secondary chambers are both refractory lined. A 12
gauge galvanized steel rain hood was added after installation to
protect the refractory lining of the secondary chamber.
The wastes to be incinerated are fed into the primary
combustion chamber by a single ram, hydraulically operated feeder,
and burned. The combustion products pass into the secondary
22
Table 5
Incinerator Specifications
Model: Environmental Control Products, Inc. Model 480E
Cost: $60,000 (1980, estimate as part of total building)
Power: 6 HP, 280 Volts, 3 Phase
Fuel: Natural Gas
Primary Chamber Volume: 118 ft~^ Secondary Chamber Volume: 25 ft
Primary Chamber Temperature (maximum): 1800 °F
Secondary Chamber Temperature (maximum): 1600 °F
Stack Height: 32 feet
Inside Diameter of Stack: 21.4 inches
Figure 1
Detail of Incinerator and Stack
Environmental Control Products Incinerator
Model 480 E
Clean out Door
Q
Primary Chajnber
Volume: 118 ft^
Maximum Temperature: 1800 °F
Stack
Total Stack Height: 32 ft.
Inside Diameter: 21.4 in. Inside Stack Cross Sectional
Area: 2.49 ft-^
Secondary Chamber Volume: 25 ft^
HcUcimum Ten^wrature: 1600 °F
24 combustion process. The resultant gases then pass through the
refractory lined stack, which includes a spark arrester, and into
the atmosphere.Ashes collect on the floor of the refractory lined
primary chamber and are removed manually. The remaining material
is removed with a HEPA filtered vacuum system which directlydeposits the ash into a 17H DOT 55 gallon drum. Access is gained
to the refractory floor via a 16" by 16" door. The total height of the incinerator, including stack, is 32 feet, measured from the
concrete floor.
The burners operate on natural gas. The primary burner has a
maximum rating of 1.2 X 10^ BTU per hour, while the secondary
burner has a maximum rating of 8.0 X 10^ BTU per hour. Both
burners are provided with a timer control with a maximum setting
of twelve hours.
B. Stack Sampling System
The stack effluent sampling system used in this study
isokinetically removed stack gases and passed the sample through a filter assembly. A description of the system is as follows:
Probe and Nozzle: A 3/8 inch buttonhook nozzle made of stainless steel was employed to remove the gas sample. This type of nozzle
effectively removes a representative sample while causing minimal aerodynamic disturbance to the stream flow. The probe used to
transport the sample to the filter assembly has an effective
length of 5 feet and is constructed of inconel.
purpose of measuring real time gas velocity and temperature. The
pitot tube, a Stausscheibe type, was used to determine the exit
gas velocity and pressure. The thermometer, a semiconductive
resistance type, was used to measure stack gas temperature.
Filter Assembly: Stack gases that entered the sampler were passed to a filter holder containing a 7 cm diameter glass fiber filter produced by Fisher Products. This filter removed particulate matter with an efficiency of 99.97% for particles 3 microns in diameter or greater. The gases then passed through four bubblers.
The first two bubblers were filled with water. The third one was
left empty, and the fourth contained 6 mesh anhydrous CaSO^, a
desiccant. No other materials, such as acids, were used in the
bubbler system because it was felt that no activity would be released in a gaseous state. The study by Brekke showed no activity in the gaseous releases when bubbled through HCl. In addition, all of the boiling points of the metals examined are in
excess of 2700 °C, which is far hotter than the temperatures
experienced in the incinerator.
Control Console: After passing through the entire sample case, the
stack gases are drawn via a hose connection into a Scientific
Glass & Instruments, Inc. Model AP5500 Stac-o-lator control
console. This unit contains a vacuum gauge, vacuum pump, dry gas
meter, and dual manometer. This instrument was calibrated on July
19, 1988 by Nutech Corporation, Durham, N.C..
C. Vacuum System
26
incinerator using manual methods, a Hako Minuteman HEPA filtered vacuum system (Model Number C 80330-02, Hako Vacuum Systems,
Addison, 111.) is used to remove the remaining loose material. The
vacuum system contains a high density impact filter and a HEPA
filter which is 99.97% effective for trapping particulates as
small as 0.3 microns. When drawn into the vacuum, the ash is
directly deposited into a 55 gallon drum which is lined with a plastic bag.
D. Multichannel Analyzer System
The detection system used to evaluate all of the samples was
comprised of a Bicron 2" x 2" Nal(Tl) crystal connected to a
Nucleus, Inc. Model 5010 scintillation amplifier and power supply. The spectrum was analyzed using a Nucleus, Inc. Personal Computer Analyzer card installed in an IBM XT personal computer. Ash samples were collected and counted in disposable 1 liter Marinelli beakers. Air filters and filter paper smears were placed in
disposable plastic petri dishes for counting.
In order to determine a lower limit of detection (LLD) for the
counting system in each of the counting configurations, the
ordinary procedure is to count non-radioactive samples, and use
the results as a background level, from which a LLD could be
calculated. This technique could not be applied in this study because a combination of isotopes were being evaluated
simultaneously. When using MCA's for analysis of mixed isotope
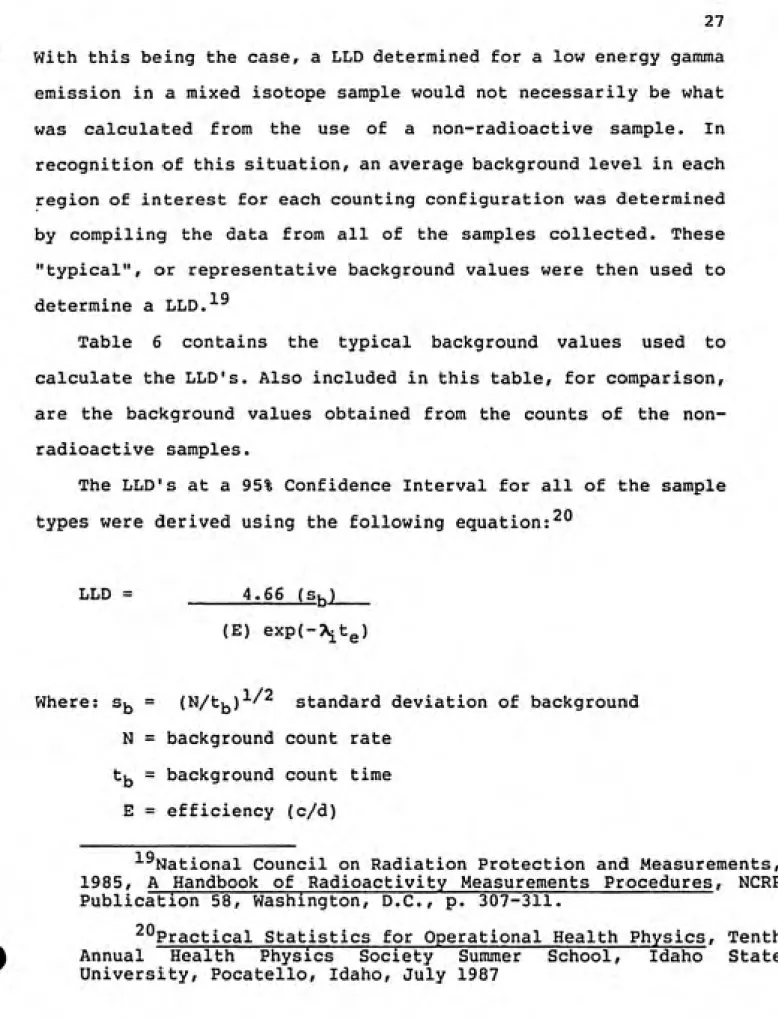
samples, the background level in each region of interest isWith this being the case, a LLD determined for a low energy gamma
emission in a mixed isotope sample would not necessarily be what
was calculated from the use of a non-radioactive sample. In
recognition of this situation, an average background level in each region of interest for each counting configuration was determined by compiling the data from all of the samples collected. These
"typical", or representative background values were then used to
in
determine a LLD.-^^
Table 6 contains the typical background values used to calculate the LLD's. Also included in this table, for comparison, are the background values obtained from the counts of the non¬ radioactive samples.
The LLD's at a 95% Confidence Interval for all of the sample types were derived using the following equation:
LLD = 4.66 (S|^)____
(E) exp(-X^tg)
Where: S]^ = (N/tj^)^' standard deviation of background
N = background count rate
tj^ = background count time
E = efficiency (c/d)
^National Council on Radiation Protection and Measurements,
1985, A Handbook of Radioactivity Measurements Procedures, NCRP Publication 58, Washington, D.C., p. 307-311.
^"Practical Statistics for Operational Health Physics, Tenth
Annual Health Physics Society Summer School, Idaho State
Table 6.
Background Levels for Counting Configurations
in Counts per Second
Ash Sample
12 Hour Count
Typical Non-Radioactive
Isotope Radioactive Sample_______Sample______
Air Filter
12 Hour Count
Swipe Sample 2 Hour Count
Typical Non-Radioactive Typical Non-Radioactive Radioactive Sample Sample Radioactive Sample______Sample______
Ce-141 Sn-113 Ru-103 Nb-95 Sc-46 350 341 331 279 241 1.14 1.2 1.07 0.9 0.7 1.4 1.2 1.2 1.0 0.8 1.06 1.0 0.94 0.9 0.7 0.9 0.8 0.82 0.7 0.6 0.6 0.6 0.53 0.5 0.45
Typical Radioactive Sample background values are defined as the average of the background values from all of the actual experimental samples counted in this configuration.
Non-Radioactive Sample background values are defined as the background counts of non-radioactive samples in the same counting configuration as the actual experimental samples.
th
y^^ = decay constant of i*-" nuclide
t = elapsed time
The LLD's for Ce-141, Sn-113, Ru-103, Nb-95,and Sc-46 are shown in Table 7.
To determine the detection efficiency for the ash counting configuration, a standard was prepared which closely simulated the
actual ash samples to be analyzed. An ash sample was collected
from the incinerator after a two month period of burning only non¬ radioactive wastes and carcasses. The ash sample was placed in a 1 liter Marinelli beaker, exactly like the beakers which were used for the counting of the actual samples. Known amounts of each of
the five isotopes were incorporated into the ash with a syringe, using the same techniques employed during an actual experimental application. (A complete description of the mixing and injection of microspheres in given in Part I, Section d.. Experimental
Applications). The actual activity of each isotope injected was determined based on the microsphere batch assay information provided by the manufacturer, and a correction for decay. After all of the microspheres were injected, the ash was allowed to dry in a desiccant chamber for 48 hours and then sealed. Prior to counting, the beaker was tumbled to ensure uniform distribution of the microspheres.
A similar method was used for the filter paper counting
30
Table 7.
Lower Limits of Detection
For Two Counting Configurations
12 hour count 12 hour count 2 hour count
Isotope Ash Sample (Bq)____Air Filter (Bq) Swipe Sample (Bq)
0.2 0.4 0.4 0.8 0.5 0.9 0.5 0.93 1.1 2.2
Ce-141 17.5
Sn-113 37.6 Ru-103 40.7
Nb-95 46.8
known amounts of the five microspheres were added by syringe. The petri dish was placed in a desiccant chamber for 48 hours and then
sealed.
The detection efficiencies for the five isotopes in each of
the two counting configurations were determined by performing five 12-hour counts. The peaks produced by the five gamma ray emitters were marked and the net counts in each of the regions of interest were obtained. An average associated efficiency error of 5% was established using a worst case assumption. To obtain this error,
each of the standards were counted ten times, and the detection
efficiencies for each peak independently determined. The mean counting efficiency and standard deviation were calculated for
each of the five isotopes. In the case of Sc-46, which has two gamma emissions, the peak of 1120 keV was always used for analysis. (The Sc-46 886 keV peak was interfered with by the 765 keV peak of Nb-95. This overlapping of peaks introduced error into the analysis of Nb-95, and is addressed in the section on Limiting
Factors.) The highest error, that of the 1120 keV peak of Sc-46 in the Marinelli beaker configuration, was found to be 5%. This
error was applied to all of the isotopes in each of the counting configurations as a conservative measure. The efficiencies and errors for the detection system used in this experiment are listed
in Table 8.
The regions of interest for each gamma ray energy were established using the appropriate spiked standard prior to actual
32
Table 8.
Detection Efficiencies (in percent) for Two
Counting Configurations Using a 12 Hour Count
Isotope_________Ash in Marinelli Beaker______Filter in Petri Dish
counted for 30 minutes. This allowed an accumulation of a
significant number counts so that the peaks could be easily distinguished from background. Regions of interest were marked on
each side of the peaks, and stored in the computer memory. Energy
calibration in keV/channel was also verified at this time. This
short count was then erased, and the sample to be analyzed was counted.
At the end of the counting period, the regions of interest previously established were superimposed onto the sample spectrum.
The method used by the computer to determine the net area of the
peak is to draw a straight line from the average of the beginning
region of interest channel contents and the three previous
channels to the average of the final region of interest counts
and the three following channels. All counts above the straight line are considered to be net
area.^-*-The peak data for all of the regions of interest, including net counts, background counts, centroid value, and full width-half
maximum (FWHM), are generated in a single summary report.
E. Experimental Design 1. Objectives
The procedures developed for this project were specifically designed with the deficiencies of previous studies in mind. The
primary objective of this study was to document the successive releases of radioactivity in non-radioactive burns which followed
34
the incineration of microspheres. To accomplish this, the monitoring of five sets of burns was proposed. Each set would
consist of three burns, the first containing non-radioactive carcasses, the second burn containing microspheres, and the third,
another non^radioactive carcass. Each burn in the set would
incinerate approximately the same volume of waste. This "series" approach would closely resemble the normal operating procedure
which includes a microsphere burn, followed by set of burns comprised of non-radioactive wastes.
Along with attempting to perform test burns in the incinerator
which reproduced actual standard operating procedures, all efforts were made to determine, as accurately as possible, the actual initial activity contained in the animal. The intention of monitoring the ash, refractory, and effluent was to perform a
materials balance so as to determine the ultimate fate of the
radioactivity in air, ash, or refractory.
2. Limiting Factors
Several parameters imposed limits on the design of the experimental burns. Because the incinerator is used for the disposal of large volumes of institutional wastes, exclusive
access to this unit for research purposes was severely limited. To maximize the number of test burns that could be performed, a
decision was made to utilize small volumes of waste which would
could not be applied in this experimental design because it included long warm-up and burn-down periods. Past operating experience demonstrated this unit would totally ash 60-80 lbs of
Type IV wastes in one hour with a 30 minute warm-up period.
Another constraint was imposed by the decision to burn only
wastes which were currently being generated from research work.
With the cooperation of the investigators, it was felt that an
accurate determination of the injected radioactivity could be made without the need for generating additional wastes by "spiking" animal carcasses. Economics also played a role in this decision, since the microspheres themselves are very expensive
(approximately $250 per 500 mg of each microsphere isotope). The decision to use currently generated wastes in this experiment effectively limited the amount of activity which would be incinerated in each burn. The typical amount of activity in each animal (13-27 kg dog or pig) is approximately 20 uCi of each of the five radioisotopes.
The stack sampling equipment produced another limiting factor. When incinerating wastes such as animal carcasses, the emission rate of effluents is not constant over the entire length of the
burn. Therefore, it is important that the effluent be monitored
over the entire burn period. The probe of the sample case is made
of a metal which can only survive the effluent temperature of the stack for one hour. To properly monitor the effluent, burn times
would need to be limited to no more than one hour.
36
made to perform each test burn with approximately 10-30 kg of
animal carcass (one large animal) for a burn time of one hour. The incinerator would be allowed to warm up for 30 minutes prior to charging the chamber with waste. This schedule would permit all
five sets of burns to take place with a minimum interruption to the normal waste processing at the facility.
It was recognized prior to the analysis of samples that the capabilities of the MCA system would also be a limiting factor in
this experiment. Most of the microsphere isotopes produced gamma
energy peaks which were easily resolved by the Nal(Tl) detector. The one exception was the overlapping of the Nb-95 peak at 765 keV with the 886 keV peak of Sc-46. Fortunately, Sc-46 emits two gamma
energies, so the 1120 keV peak, which was unaffected by Nb-95, was used exclusively for spectral analysis. With the peak analysis
capabilities available for this study, it was conceded that any Nb-95 results obtained should be viewed with this spectral resolution problem in mind. Figure 2 shows a typical spectrum obtained from a sample with a mixture of the five microsphere
ͣ
p
c 9 O
o
cr
o
Multichannel Analyzer Spectrum
of Standard Containing Five Microsphere Isotopes Showing Overlap of Nb-95 and Sc-46 Peaks
Ce-141 (145 keV)
Iv/V" '-m^."TfUi__ jf \ _^ r.f'. Jr
i /
Sn-113 (393 keV)
Ru-103 (497 keV)
'•^ \/"\
Nb-95 (765 keV)
Sc-46 (889 keV)
Sc-46 (1120 keV)
"H..
""s^.
ͣ
^-isuttrj
"'"iffcci,.,---Energy (keV)
38
3. Determination of Actual Activity and Analysis of Error
A common problem encountered in all of the previous studies
using institutionally generated waste was uncertainty associated with the initial activity placed in the incinerator. This
uncertainty was due mainly to inaccurate recordkeeping by the
researchers performing the actual microsphere applications. To aid
in the determination of the actual amount of activity injected
into the animals, assistance was solicited from one of the
researchers who actually used the microspheres in experiments. All
of the carcasses used in this study were obtained from this single researcher. Through this individual's diligent efforts, accurate records were maintained, including the date of injection, dilution of stock solutions, length of time vortexed and
sonicated, and the actual volume of liquid suspension media
injected. Fortunately, the experimental protocol used by this
researcher called for the microsphere injection to be followed by
a saline flush. This eliminated any possibility of microsphere
retention in the syringe or associated tubing, as encountered in the study by Krueger and McLaughlin. The empty syringes were
routinely monitored with a portable Nal(Tl) survey meter prior to disposal in a sharps container. No residual activity was ever
detected. At the completion of the experiment, the animal carcass and any tissue that was excised for biological analysis was brought to the Office of Radiation Safety. In this way, all of the
incineration, without any losses due to missing tissue or blood
samples.
Another source of uncertainty involved with the initial amount
of radioactivity incinerated is the error associated with the
actual radioactivity in each microsphere. Although each batch of microspheres is assayed by the manufacturer prior to shipment, this assay only indicates the measured specific activity of the beads, and not the associated standard deviation. Since the magnitude of this error is unknown, it would be prudent to make provisions for
this error in any work incorporating the results of this study.
Since the Marinelli Beaker ash counting standard used to
calibrate the counting system and the wastes were generated from
the same batches of microspheres and were made using similar
experimental methods, any uncertainty introduced by the activity
per bead in the wastes was also introduced, in the same amount,
into the ash counting standard. With this error in both the wastes and the counting standard, it was effectively eliminated, or cancelled out, with respect to the calculation of a percent
retention. Although the uncertainty in the activity in the microspheres does not effect the determination of the percent
retention, it would effect an estimate of the absolute amount of
activity retained in the ash. Any estimate of the activity retained in the ash would include the uncertainty in the activity in the
microspheres.
40
sample calculation using actual data from one of the burns. This
demonstrates that the value of the activity of the microspheres
cancels when determining the percent retention factor.
4. Incineration Procedures
Prior to initiating each series of burns, arrangements were made with the University Physical Plant to have uninterrupted use
of the incinerator for a minimum of 96 hours. This time period
usually occurred on weekends or holidays.
Before starting the series of burns, the incinerator was manually cleaned out and the refractory vacuumed. The incinerator
was then started and allowed to warm up for 30 minutes to reach
operating temperatures. The animal carcass was then weighed, and in the case of radioactive carcasses, the activity information recorded. The animal was placed in the automatic ram feed system and charged into the incinerator at the end of the warm up period, and burned for one hour.
At the end of each burn period, the incinerator was turned off
and allowed to cool for 4-6 hours before ash removal. 5- Stack Monitoring
Two different techniques were used to monitor the stack effluent. For the first two sets of burns (6 individual burns) the sample probe was placed at eight different sampling points on two
transects as prescribed in EPA Method 5. The sampling time at
each point was 7.5 minutes. Preliminary counts of the air filters
^^U.S. Environmental Protection Agency, 1981, Title 40 Part
from these burns yielded no detectable activity, so an alternative
method was employed for the remaining burns.
For sets 3, 4, and 5, (9 individual burns) the sample probe was placed at the one point with the highest air flow rate. This method was used in an attempt to sample from the area where the
highest concentration of effluents might exist.
At the end of each burn, the sample probe was removed from the stack and covered with aluminum foil. After cooling, the entire sample case was carried to the Office of Radiation Safety Laboratory for disassembly.
The particulate filter was removed and placed in a petri dish.
The sample probe was then disassembled and cleaned with a brush and acetone wash. The washings from this cleaning procedure were
collected directly on the particulate filter. In this manner, all of the particulates sampled were now on one filter. The filter was
placed in a desiccator for 48 hours and then sealed in the petri
dish.
The contents of all of the impingers were removed and
measured. The water volume collected in the water-filled impingers was measured by pouring the impinger contents into a graduated
cylinder. The desiccant was weighed on an electronic balance. The
additional water in the bubblers and the added weight of the desiccant was used to determine the water vapor content of the
effluent. The contents of the impingers were not analyzed for
radioactivity for several reasons. As stated earlier, the study
42
radioactivity sampled on the particulate filter, and no detectable
amounts in the impinger contents. With the lowest boiling point of
all of the microsphere elements being greater than 2700 °C, it was
doubtful that any vapors would be formed in the incinerator environment. Any vapors that might form would probably react with the available O2 to form oxide particles that would be trapped on
the particulate filter. Condensation of any effluent vapors onto the relatively cooler particulate filter (approximately 38 to 66
°C) also would play a role is preventing microsphere radioactivity
from reaching the impinger section of the sampling train.
6. Ash Removal and Sample Preparation
After cooling, the ash from the incinerator was removed in two ways. The largest debris was manually collected onto a tray placed
beneath the cleanout door using a hoe-like device. The remaining
ash was collected using the HEPA filtered vacuum system which deposited the fine silt directly into a 55 gallon drum lined with
a plastic bag. The manually removed material was then added to the vacuumed material in the drum. Any visible fine dust that was
collected on the vacuum filter system was brushed off into the plastic bag. The plastic bag was then sealed and brought to the
Radiation Safety Laboratory for weighing and spectral analysis. In the lab, the ash was transferred to 1-liter Marinelli Beakers and weighed. Usually, all of the ash would fit into one beaker. If any excess ash remained, it was placed in plastic jugs
assumed for radioanalysis purposes that the radioactivity was homogeneously distributed in each of the samples counted.
Special precautionary procedures were followed while removing all incinerator ash. Because a danger of ingestion and personnel
contamination existed, full face particulate respirators were worn,
as well as complete sets of anti-contamination clothing. After ash cleanout was accomplished, contamination surveys around the incinerator area were performed and documented.
7. Determination of Radioactivity in Ash Samples
Once the ash samples were prepared for counting, the Marinelli beakers were counted on the MCA system. At the completion of the
twelve hour counting period, each peak on the spectrum that was produced was marked and integrated as previously described in Part II, Section D. The MCA peak analysis program generated a report for each sample which contained the net counts and background counts
in each region of interest. The net count rate and associated standard deviation for each energy region was then calculated and used to obtain the percent activity that was retained. Appendix B
details the method used to calculate the retained fraction of
radioactivity in ash. 8. Refractory Swipes
Filter paper swipes were taken on the interior refractory surface of the incinerator after each burn. The filter papers used
were the same size and weight of the air filter papers used in air
44
were 1) the incinerator floor at the base of the ram door, 2) the
center of the floor, 3) the floor area just inside the cleanout door where material was often accumulated, and 4) two feet up the wall of the incinerator near the ram door.
III. RESULTS AND DISCUSSION
A. Radioactivity Detected in Ash Samples
The overall objective of this research project was to document
the retention and subsequent releases of radioactivity resulting
from the incineration of microspheres. Ultimately, the data from
the analysis of the radioactivity in the ash samples proved to be
the most useful in meeting this goal.
Each incineration series consisted of three burns. A coding
system was established which would identify each sample as to its
burn series and sequential number. For example, a sample with the
identification number 2:1 indicates that the sample was from the
first burn of the second series of burns. 2:2 indicates the second
burn in the second series, and so on. This system proved to be most
helpful in the identification of the large number of samples
collected.
The incineration process routinely reduced the mass of the
wastes by more than 90%. The average mass reduction for the 15
experimental burns performed was 94.1%. These results agree with
the findings of several previous incineration studies, which
reported reductions of 90-95%. Figure 3 shows the percent mass
reduction for each of the fifteen experimental burns.
The fourth burn series, to be indicated by numbers 4:1, 4:2,
and 4:3, was cancelled due to incinerator malfunction. During the
initial burn of the series, which contained a non-radioactive
100-1
Figure 3
Percent Mass Reduction of Type IV Wastes from One Hour Burn
(Initial Weight 11 to 31 Kg)
• • •
a
o
•H
ͣ
P u
m &
ͣ
p
c o o
u
Pi
50-—I---1---1---1---1---1---1 I---1---1---1---1---1---1---1---1---1---1 1:1 1:2 1:3 2:1 2:2 2:3 3:1 3:2 3:3 4:1 4:2 4:3 5:1 5:2 5:3 6:1 6:2 6:3
burned, and had to be removed for disposal. Repairs for the
incinerator took a week to complete, so the remainder of the fourth
series of burns was cancelled, and the fifth series was initiated.A sixth burn series was added to provide data which was lost due
to this malfunction.
The ash from the five initial burns, 1:1, 2:1, 3:1, 5:1, and
6:1, all contained microsphere radioactivity, even though a non¬
radioactive carcass was burned. This contamination of non¬
radioactive ash apparently resulted from the release of
radioactivity from the incinerator refractory from previous
microsphere burns. For the five initial burns, the following ranges
of gross activities were measured: Ce-141, 12.5 to 1326 Bq; Sn-113,
20 to 5515 Bq; Ru-103, 24 to 1729 Bq; Nb-95, 0 to 215 Bq; and
Sc-46, 181 to 28,528 Bq. The higher activities were detected in the
later series of burns, indicating a buildup of activity in the
refractory was occurring as a result of the experimental burns.
The quantities of radioactivity found in the initial burns
were not subtracted from the subsequent ash data as an indication
of background levels of radioactivity. After examining all of the
data from the first three series of burns, it became obvious that
the amount of microsphere radioactivity released from the
refractory into the ash decreased with successive burns. Since the
rate of this release was not previously documented, it was assumed
that the amount of activity contributed from previous burns would
48
The average retention of Ce-141 in the ash from the burns of
radioactive carcasses was 29.2+9.8%. The range of retention values
was 17.5+1.2% to 43.1+3%. The average retention value was obtained
from the ash results from burns 1:2, 2:2, 3:2, 5:2 and 6:2. The
percent retention value and associated error for each burn was
determined using the calculations shown in Appendix B. It should
be noted that a range of ash retention values for each microsphere
isotope was anticipated because of the inherent nature of
industrial incinerators. Since these devices are explicitly
designed and used for the processing of large amounts of
institutional wastes, they should not be considered as precise
laboratory equipment. Fluctuations in the various operating
parameters of incinerator such as chamber temperature and induction
of forced air, do indeed occur, and may effect the retention values
of each specific burn. All of the previous studies performed on
microsphere incineration make note of the retention variations that
occurred from burn to burn. The variations in ash retention values
warranted special consideration when calculating average retention
values. The difference between samples produced errors more
significant than the errors within each sample, so a mean and
standard deviation for the mean retention values of each burn was
calculated. This same calculation was also performed to summarize
the results of each of the subsequent burns. The average retention
value obtained using this technique adequately addressed the
variation between individual samples.
microsphere burn retained an average of 6.1+4.1% of the Ce-141
activity. The range of values was 1.4+0.1% to 12.4+0.9%. The
radioactivity detected in these burns was undoubtedly due to the
release of radioactivity from the incinerator refractory since the
wastes contained no Ce-141.
Of the five series of burns performed, several were run in
succession. The first, second, and third burn series were performed
consecutively, without any interruption by the normal waste
processing of the University. The fifth and sixth series of burns
were also conducted consecutively. Since each burn series started
with the incineration of a non-radioactive carcass, successive
series of burns permitted the monitoring of ash from a second non¬
radioactive burn after the incineration of microspheres. As an
example, the initial burn for series two, indicated by 2:1, also
produced data as the second non-radioactive burn following the
radioactive burn 1:2. For the three burns which could be considered
as the secondary non-radioactive burns for Ce-141, an average of
3.0+1.9% of the original activity was recovered.
The average total Ce-141 activity recovered from all of the
ash monitored was 38.3+10.8%. The only previous research with this
microsphere isotope, performed by Finnegan, reported retention
values of 83-100%. The previously reported values are higher than
the results found in this study because the carcasses were burned
while on collection trays, permitting almost complete ash
retrieval, while preventing refractory contamination. Figure 4
50
Figure 4
Retention in Ash From Incineration of Ce-141 Microspheres
Average Total Activity Retained: 38.3 + 10.8%
100 —n
M
> M
I
50 H
INITIAL ACTIVITY
FIRST ASH
SECOND ASH
THIRD
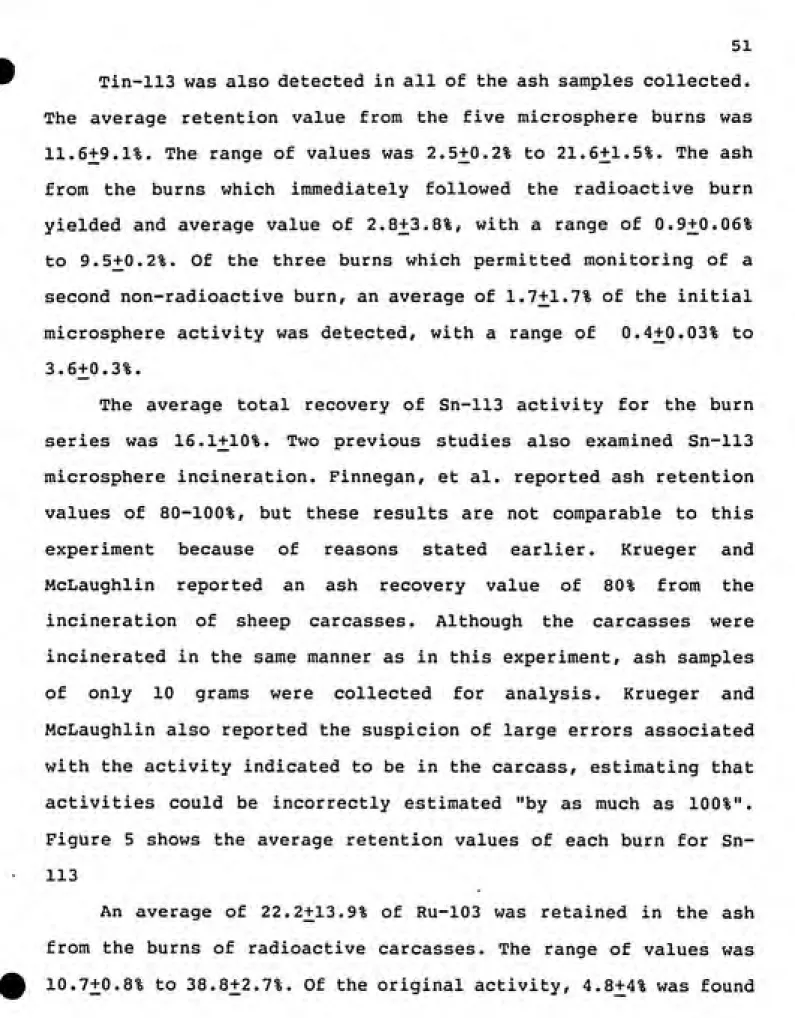
Tin-113 was also detected in all of the ash samples collected.
The average retention value from the five microsphere burns was
11.6+9.1%. The range of values was 2.5+0.2% to 21.6+1.5%. The ash
from the burns which immediately followed the radioactive burn
yielded and average value of 2.8+3.8%, with a range of 0.9+0.06%
to 9.5+0.2%. Of the three burns which permitted monitoring of a
second non-radioactive burn, an average of 1.7+1.7% of the initial
microsphere activity was detected, with a range of 0.4+0.03% to
3.6+0.3%.
The average total recovery of Sn-113 activity for the burn
series was 16.1+10%. Two previous studies also examined Sn-113
microsphere incineration. Finnegan, et al. reported ash retention
values of 80-100%, but these results are not comparable to this
experiment because of reasons stated earlier. Krueger and
McLaughlin reported an ash recovery value of 80% from the
incineration of sheep carcasses. Although the carcasses were
incinerated in the same manner as in this experiment, ash samples
of only 10 grams were collected for analysis. Krueger and
McLaughlin also reported the suspicion of large errors associated
with the activity indicated to be in the carcass, estimating that
activities could be incorrectly estimated "by as much as 100%".
Figure 5 shows the average retention values of each burn for
Sn-113
An average of 22.2+13.9% of Ru-103 was retained in the ash
from the burns of radioactive carcasses. The range of values was
52
Figure 5
Retention in Ash From Incineration of Sn-113 Microspheres
Average Total Activity Retained: 16.1 + 10%
100 ~i
>
H
50 H
±
INITIAL ACTIVITY
FIRST
ASH
SECOND ASH