i
THE GLOBAL RACE FOR TALENT: ENTREPRENEURIAL TALENT
FLOW BETWEEN THE U.S. AND ASIA
Yusheng Zhang
An honors thesis submitted to the faculty of the Kenan-Flagler Business School at the University of North Carolina at Chapel Hill.
Chapel Hill 2019
Approved by:
_____________________________ (Ted Zoller, Ph.D., Thesis Advisor) (Arvind Malhotra, Ph.D., Reader)
iii ABSTRACT Yusheng Zhang
The Global Race for Talent: Entrepreneurial Talent Flow Between The U.S. and Asia (Under the direction of Ted Zoller, Ph.D.)
iv
ACKNOWLEDGEMENTS
I must thank several groups of people whose support made my research and honors thesis possible. First, my advising committee, Dr. Ted Zoller, Dr. Xinxin Wang, and Dr. Arvind Malhotra’s mentorship have been invaluable in my research and education. Thank you. Next, I thank three members of the Kenan-Flagler Business School faculty. Dr. Patricia Harms taught me the fundamentals of compelling academic business writing. Dr. Chloe Glaeser’s knowledge of statistical analyses gave strength to my findings and made my thesis a more substantial piece of literature. Dr. Frank Ethridge’s expertise in data collection helped me navigate numerous databases to perform my analyses.
Furthermore, Dr. Vivek Wadhwa at Carnegie Mellon University and Harvard Law School and Dr. Ben Rissing at Cornell University both supplied me with innovative literature and databases. Dr. Wadhwa’s writing on the immigration debate in
collaboration with Dr. AnnaLee Saxenian of University of California, Berkeley were the original inspiration for me to examine the immigrant entrepreneurship question.
v
TABLE OF CONTENTS
ABSTRACT ... iii
ACKNOWLEDGEMENTS ... iv
LIST OF TABLES ... vii
LIST OF FIGURES ... viii
INTRODUCTION ... 1
LITERATURE REVIEW ... 2
I. Why HSIEs Succeed ... 2
II. HSIE Contributions to the U.S... 4
III. Obstacles Against HSIEs ... 5
IV. Reverse Brain Drain ... 9
RESEARCH METHODOLOGY AND LIMITATIONS ... 11
I. Research Methodology ... 11
Research Questions... 11
Hypotheses... 11
Hypotheses Rationale ... 12
vi
Startup Formation Methodology ... 14
II. Limitations ... 16
Methodology Limitations ... 16
Data Limitations ... 16
ANALYSIS AND FINDINGS ... 18
I. Analysis of Education and Retention Data ... 18
Survey of Earned Doctorates ... 18
Capital IQ Immigrant Data ... 25
II. Findings from Education and Retention Analysis ... 31
III. Analysis of Startup Formation Data ... 32
“Unicorn” Data ... 33
IV. Findings from Startup Formation Analysis ... 36
CONCLUSION, RECOMMENDATIONS, AND IMLPICATIONS ... 38
I. Conclusion ... 38
II. Recommendations ... 40
III. Implications ... 42
Policy Implication... 42
Research Implications ... 43
REFERENCES ... 45
vii
LIST OF TABLES
Table 1: Categories of "Unicorn" Analysis ... 50
Table 2: Top 20 Undergraduate Institutions of Immigrant Sample by Count ... 51
Table 3: Undergraduate Origins of Immigrant Sample by Country ... 52
viii
LIST OF FIGURES
Figure 1: Research Methodology Map ... 53
Figure 2: All U.S. Doctorate Recipients 2008-2017 ... 53
Figure 3: Changes in U.S. Earned Doctorates 2009-2017 ... 54
Figure 4: Ten Most Popular Doctorate Fields for TVHs ... 54
Figure 5: Ten Least Popular Doctorate Fields for TVHs ... 55
Figure 6: Nine Fastest Growing Fields for TVHs ... 55
Figure 7:Nine Fastest Falling Doctorate Fields for TVHs ... 56
Figure 8: Chinese, Indian, and South Korean Doctorate Earners ... 56
Figure 9: Top Ten TVH Origins ... 57
Figure 10: Top Ten TVH Origins for Science and Engineering ... 57
Figure 11: Top Ten TVH Origins for Non-S&E ... 58
Figure 12: Total "Unicorns" by Region ... 58
Figure 13: Total "Unicorn" Valuations by Region ... 59
Figure 14: "Unicorns" >$40B by Region... 59
Figure 15: Total $1B "Unicorns" by Region ... 60
Figure 16: Total "Unicorn" Exits by Region ... 60
Figure 17: Asian "Unicorn" Founders Education ... 61
Figure 18: European "Unicorn" Founders Education ... 61
ix
1
INTRODUCTION
Highly skilled immigrants have been spectacularly successful entrepreneurs in the United States. They have co-founded iconic companies such as Google, Intel, eBay, and Yahoo. A highly skilled immigrant entrepreneur, hereafter referred to as HSIE, usually comes to the U.S. seeking higher education or job opportunities. AnnaLee Saxenian (2002) might describe HSIEs as “foreign-born engineers and other highly educated professionals whose skills were in short supply.” In the past decade, HSIEs have begun leaving the U.S. for better opportunities elsewhere, creating a “reverse brain drain.” The reverse brain drain has democratized entrepreneurial talent flow, spurring a global race for talent. Recent discussion on immigrant entrepreneurship asks four important questions:
1. Why are HSIEs so successful?
2. What contributions have HSIEs made to the U.S.? 3. What obstacles do HSIEs face in the U.S. today? 4. What are effects of the reverse brain drain of HSIEs?
2
LITERATURE REVIEW
I. Why HSIEs Succeed
To understand the success drivers of HSIEs, it is beneficial to review the history of immigrant entrepreneurship in the U.S. The Hart-Cellar Act of 1965, also known as the Immigration and Nationality Act, is one of the most important modern U.S.
immigration policies for immigrant entrepreneurship. The Hart-Cellar Act allowed entry into the U.S. based on possession of rare skills through programs such as the H1-B visa. Professionals could then more easily immigrate to the U.S. with their families (Saxenian, 2002). In 1967, 1,321 Taiwanese scientists and engineers immigrated to the United States—a 2,500 percent increase in two years (Wadhwa, 2012). Passage of the
Immigration and Nationality Act of 1990, “further favored the immigration of engineers by almost tripling the number of visas granted on the basis of occupational skills from 54,000 to 140,000” (Saxenian, 1999). By the end of 1990, 23 percent of the population living in the heart of Silicon Valley was foreign-born. While Chinese and Indian immigrants were still a minority in Silicon Valley in 1990, they were more than twice more likely to hold Master’s or Ph.D. degrees than their White counterparts (Saxenian, 2002). Between 1980 and 1998, Chinese and Indian immigrants ran close to one quarter of Silicon Valley’s technology firms (Saxenian, 2002). As HSIEs grew rapidly in
3
the Silicon Valley Chinese Engineers Association (SCEA) began to support ethnic communities. In the early 2000s, U.S. entry visas, permanent residence visas, and the naturalization process began to struggle to keep up with the number of applicants (Wadhwa, Saxenian, & Siciliano, 2012). Nevertheless, 43.9 percent of Silicon Valley engineering and technology companies founded between 2006 and 2012 had at least one key foreign-born founder (Wadhwa et al., 2012).
Scholars hypothesize that immigrant entrepreneurs in the U.S. have four
4
possible combination of backgrounds, risk tolerance, and ethnic networks (Lee & Eesley, 2018). There indeed appears to be some evidence that HSIEs leverage strong and weak ties within their ethnic enclaves to achieve success in the U.S. Ongoing research today seeks to deepen our understanding of the minute differences between immigrant entrepreneurs of different nationalities, races, and genders.
II. HSIE Contributions to the U.S.
HSIEs have made vital contributions to the American economy and to American innovation through founding companies, creating jobs, and filing intellectual property. Equipped with valuable occupational knowledge and skills, immigrant-founded companies produced $52 billion in sales and employed 450,000 workers in 2005 (Wadhwa, Saxenian, Rissing, & Gereffi, 2007). Half a decade later, first-generation immigrants and their children helped found 40 percent of Fortune 500 companies as of 2011 (Wadhwa, 2012). In 2012, immigrant-found companies generated $63 billion in sales and hired 560,000 workers (Wadhwa, Saxenian, & Siciliano, 2012). HSIEs also tend to create jobs and revenue in the most innovative fields including pharmaceuticals and healthcare. Immigrant founders created 18.7 percent of startups in North Carolina’s Research Triangle Park, compared to the 13.9 percent average for the rest of North Carolina (Wadhwa et al., 2007). These are a few examples of HSIEs’ direct economic contributions.
5
Immigrant inventors are more likely to collaborate with colleagues of different backgrounds and facilitate cross-border diffusion of knowledge and technology. This finding is consistent with Granovetter’s theory of strong and weak social ties (1973) and with Lee and Eesley’s ethnic enclave proposition (2018). Furthermore, collaboration between immigrant inventors and native inventors seem to create higher innovative output, which indicates that innovative immigrant-native partnerships are not zero-sum. Bernstein et al. also found that immigrants account for 30 percent of U.S. innovation despite only making up 17 percent of total inventor workforce. By 2006, foreign nationals contributed over 25 percent of the U.S.’ international patent applications. For example, 63.3 percent of the patents that General Electric filed in 2006 were by foreign national and foreign resident inventors (Wadhwa, Jasso, Rissing, & Gereffi, 2007). Highly skilled immigrants have indeed made extraordinary contributions to the U.S. as soon as they set foot in this country for the past five decades.
III. Obstacles Against HSIEs
For the first time in decades, immigrant entrepreneurship is declining in the U.S. Immigrant entrepreneurs are leaving the country both voluntarily and out of frustration. Between 2005 and 2012, the proportion of immigrant-founded companies across the U.S. fell from 25.3 percent to 24.3 percent; the number in Silicon Valley dropped from 52.4 percent to 43.9 percent (Wadhwa, Saxenian, & Siciliano, 2012). The Obama
6
Highly skilled immigrants in the U.S. have also been returning home to reunite with their families in addition to pursuing better career opportunities (Wadhwa, Saxenian, Freeman, & Gereffi, 2009). I will hereafter refer to this group of entrepreneurs returning home as “returnees.” Survey data shows that highly skilled immigrants came to the U.S. largely because it has offered HSIEs superior education and career outcomes for the past five decades (Wadhwa et al., 2009). Today’s returnees, however, are leaving the U.S. for both social and professional reasons. Wadhwa surveyed over 1,200 Chinese and Indian returnees in 2006, and discovered that returnees primarily returned to their home countries to seek out better care of their aging parents and stronger family values. The opportunity to be close to family and friends was a stronger incentive to return than professional opportunities at home. Nevertheless, over 80 percent of Chinese returnees and almost 70 percent of Indian returnees who responded to the survey also believed that their skills were now in demand in their home countries. Other obstacles in the U.S., such as language barriers and cultural assimilation, played smaller roles in returnees’ decision to leave.
Wadhwa also found that returnee experienced mixed satisfaction in their home countries. After returning home from the U.S., returnee who responded to the survey experienced the following changes:
Positive
o Increase in the speed of professional growth by 60 to 70 percent o Increase in professional recognition
7
Negative
o Reduction in healthcare benefits o Increase in bureaucracy
o Inferior public infrastructure
o Lower gross wages, but also lower cost of living o Lower quality in children’s education
o Reverse culture shock
Despite some of these unpleasant changes at home, almost half out of all survey respondents indicated that they were unlikely to return to the U.S. in the future. However, attitudes change when isolating for returnees who already received a U.S. permanent-residence visa. Over 60 percent of respondents in this category would accept or seriously consider an offer if they were presented with a job opportunity in the U.S. equivalent to the position they held at home (Wadhwa et al., 2009). This finding suggests that offering more permanent-residence visas could help the U.S. retain more potential HSIEs.
Wadhwa estimated in 2006 that each year, only around 120,000 visas are available to over a million highly skilled immigrants applicants and their families. To exacerbate the bottleneck, U.S. Customs and Immigrations Services (USCIS) can award no more than 7% of these visas to citizens from any one country (United States Citizenship and Immigration Services, 2018). This backlog of permanent-residence applications further emphasizes the need to bolster U.S. immigration policy to retain these talented HSIEs, especially since over half of respondents indicated that they would start a company within five years of returning home (Wadhwa et al., 2009). Through performing
8
India and China have helped their countries become leaders in science technology and computing hardware, respectively (Wadhwa, 2009b). Losing each of these new jobs to other countries may reduce relative U.S. competitiveness in the global market. Again, it is important to note that global innovation is not zero-sum.
Dissatisfied entrepreneurs who are not returning to their home countries are looking to greener pastures elsewhere. Australia, Canada, Chile, France, Germany, and Singapore have recently all passed startup legislation to address pain points of immigrant entrepreneurship. For instance, the Chilean government launched Start-Up Chile in 2012 to build an entrepreneurship hub in the country. Start-Up Chile is a public startup
9 IV. Reverse Brain Drain
Although scholars have critiqued U.S. immigration policy and speculated on reactive measures to restore American appeal to highly skilled immigrants, few have conducted extensive or conclusive primary research to directly assess the current direct and indirect effects of HSIEs leaving the U.S. versus staying. The exact effects of the ongoing reverse brain drain are difficult to quantify, and some scholars have found it frustrating that U.S. immigrant entrepreneurship policy over the past decade has not seen significant liberalization—this may be a reason why the literature on the effects of the reverse brain drain has stagnated. Existing solutions to restore the U.S. appeal to HSIEs fall in two categories: short-term permanent-residence visa increases and longer-term policy improvements. In the short term, Wadhwa calls for more permanent-residence visas for skilled professionals and accelerated visa processing times. He also suggests that highly valuable workers should be able to bring their parents to the U.S. since caring for aging parents is a major reason for highly skilled immigrants to return home
(Wadhwa, 2009a).
In the long term, U.S. immigration policy could bring back highly skilled returnees by offering them permanent residency status and better career options.
10
multiple cross-continental relocations to take on opportunities in the U.S. should be a positive indicator for the U.S. economy and a motivation for the government to renovate outdated policies. Literature cited above emphasizes more welcoming immigrant
entrepreneurship policy. However, what ecosystem-wide approaches can other
stakeholders take to affect the flow of entrepreneurial talent and boost U.S. innovation? My thesis addresses this gap by translating education and startup data into
11
RESEARCH METHODOLOGY AND LIMITATIONS
I. Research Methodology
The purpose of this section is threefold: to define research question, to identify two hypotheses in response to the research question, and to introduce two hypothesis-testing methods. I designed the research question and hypotheses of this paper with the goal of exploring the most up-to-date, measurable effects of the reverse brain drain on the U.S.’ entrepreneurship and talent retention capabilities.
Research Questions
Is the reverse brain drain of highly skilled immigrant entrepreneurs (HSIEs) accelerating? As a result, how does the future of U.S. entrepreneurial capability compare
against the rest of the world?
Hypotheses
The research question has two components. While it is extremely difficult to prove causality between the two phenomena, the intentional juxtaposition of the two questions could produce interesting future research questions in the direction of establishing causality. I devised two hypotheses to answer this two-part question:
12
2. The United States is still the most popular and conducive destination for startup formation.
Hypotheses Rationale
I built these two hypotheses as the most relevant proxy metrics with reliable and accessible data corresponding to each of the two research questions. Hereafter in the paper, I will refer to the first hypothesis as the Education and Retention Hypothesis and the second hypothesis as the Startup Formation Hypothesis. The Education and Retention Hypothesis focuses on answering the research question about the acceleration of the reverse brain drain while the Startup Formation Hypothesis focuses on answering the question regarding the future of U.S. entrepreneurship. I recognize that education is not the only opportunity in the U.S. that attracts and retains talented immigrants. Compared to immigrants who migrate to the U.S. seeking employment in corporations or academia, however, those who migrate to receive undergraduate or graduate education are
reasonably more likely to consider entrepreneurship as a career option. Acknowledging that the two hypotheses address different parts of the research question, I created two separate research methodologies to tackle the two hypotheses.
Education and Retention Methodology
This section offers an overview of the methodology used to evaluate the
Education and Retention Hypothesis, the objective of the methodology, the reasoning for constructing such a methodology, and the components involved in the methodology.
13
immigration data, and profiles of entrepreneurs who left the U.S. to represent the status quo of U.S. education and retention of global talent holistically. Using profiles alone would have been much less statistically rigorous than using a combination method. However, with their qualitative nature, profiles added an additional depth to the understanding of immigrants that the available quantitative data could not provide.
All three components in the Education and Retention Methodology came from different sources. Longitudinal data came from the Survey of Earned Doctorates, which requests information from doctorate recipients of U.S. education institution about their post-graduation plans (Survey of Earned Doctorates, 2017). This survey contains reliable data segmented by country and field of study, which offers insight into the origins, citizenship status, field of expertise, and post-doctorate career intentions. To be clear, doctorate attainment data does not substitute or perfectly emulate immigrant entrepreneur movement, but it is one of the few sets of reliable data in existence to track the flow of highly skilled individuals globally. I chose to focus on data from the past decade (2008-2018) from this survey due to the forward-looking purpose of this thesis. Furthermore, the financial crisis of 2008 might introduce additional biases into the data that are difficult to control.
14
attracting and retaining and how much of that population the U.S. had lost. Given that USCIS plans to grant only 85,000 H1-B visas during the 2020 fiscal year, a 3,000-person sample is reasonably large (U.S. Citizenship and Immigration Services, 2019).
After analyzing the Capital IQ immigrant sample, I selected five immigrant founders around whom to build brief profiles using LinkedIn. These profiles are
qualitative and added a level of understanding to the Capital IQ data that numbers alone could not convey. The profiles intended to highlight the characteristics of returnee
immigrant entrepreneurs rather than to represent all immigrant entrepreneurs. I selected these five individuals from the sample because they were young founders under the age of 35 who returned to their home countries to start their companies after receiving U.S. educations. I discuss the execution of this methodology and its findings in the “Analysis and Findings” section below.
Startup Formation Methodology
This section offers an overview of the methodology used to evaluate the Startup Formation Hypothesis, the objective of the methodology, the reasoning for constructing such a methodology, and the components involved in the methodology.
The Startup Formation Methodology is a longitudinal quantitative analysis. I tracked the creation, growth, and exits of “unicorn” companies across the U.S., Europe, Asia, and other regions between 2014 and 2019. The Wall Street Journal’s Billion Dollar
15
they are rare, governments and entrepreneurs alike look to “unicorns” as a benchmark of entrepreneurial achievement.
Using “unicorns” as proxy for startup formation is an imperfect but precise and reliable method. Most startups do not publish reliable public data, even on platforms such as Crunchbase. Relying on obtainable startup data from Crunchbase would unfairly disadvantage regions outside of North America and Europe where startup culture and regulation are less transparent. “Unicorns,” on the other hand, are large and scrutinized enough to provide reliable information.
Before beginning the analysis, I sorted the companies by geographic and financial categories as shown in the table below.
Table 1 Here
16 II. Limitations
My research contended with methodology and data limitations. This section describes these limitations and their implications for my research.
Methodology Limitations
Instead of building LinkedIn entrepreneur profiles, I originally intended to conduct 10 to 20 interviews and 30 to 50 surveys with HSIEs in the U.S. who faced immigration challenges in their career. Institutional Review Board restrictions ultimately prevented me from conducting these interviews and surveys. Being able to conduct interviews and surveys would have added primary research to my thesis that was previously unavailable in the existing literature. First-hand stories from these entrepreneurs could also have uncovered challenges in the immigration and startup processes that quantitative analyses could not describe.
Data Limitations
Availability and accessibility of data presented the bigger limitation in my thesis research. I encountered three notable data limitations:
17
of employment individuals intended to pursue and made no distinction between entrepreneurial versus non-entrepreneurial careers. A future plans survey of highly skilled immigrants in the U.S. would provide an incredibly useful tool for researchers, policy makers, and business leaders.
2. I also had limited access to immigrant education data beyond samples from the Survey of Earned Doctorates and Capital IQ. For example, access to a “Survey of Earned MBAs” modeled after the Survey of Earned Doctorates, or admissions and enrollment data from U.S. entrepreneurship programs, would have lent more predictive power and credibility to my thesis.
3. Finally, data on founders and employees of new startups around the world may have been a more innovative proxy for startup formation capability than
“unicorn” data alone. I searched for, but was unable to find, enough information on the origins, educational background, and personal journeys of founders and employees in new startups. This data may have to be collected via interviews and surveys since available profiles on Crunchbase and LinkedIn did not give
18
ANALYSIS AND FINDINGS
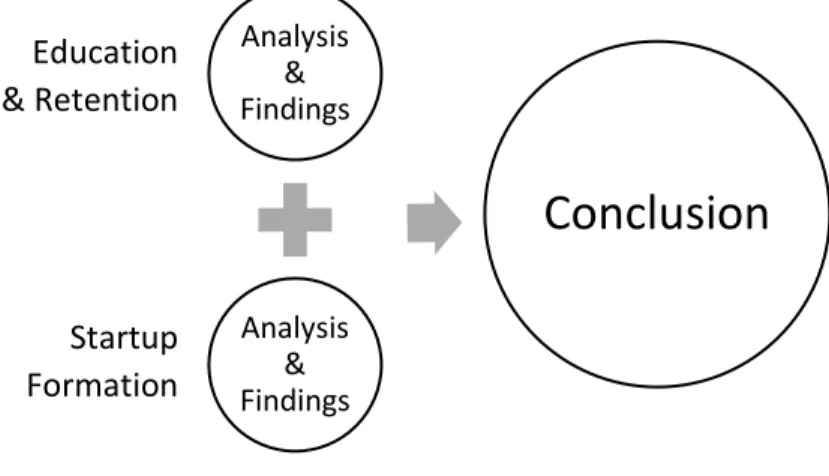
The subsequent section first documents my data analysis using the methods detailed in the “Research Methodology” section above and then presents findings from the analyses. For the purpose of continuity, I chose to first present the analysis and findings pertaining to the Education and Retention Methodology together. Then I present the analysis and findings pertaining to the Startup Formation Methodology. A synthesis of findings from the two methodologies in the “Conclusion” section will directly evaluate my two hypotheses and research question. Figure 1 below visually depicts the structure of the following Analysis and Findings section.
Figure 1 Here
I. Analysis of Education and Retention Data
Three components make up the Education and Retention Methodology: Survey of Earned Doctorates, Capital IQ immigrant data, and LinkedIn entrepreneur profiles.
Survey of Earned Doctorates
19 Fields of Study
The Survey of Earned Doctorates captured 43 fields of study that awarded doctorate degrees in the U.S. between 2008 and 2017. As shown in Figure 2 below, the total number of doctorates awarded in the U.S. annually rose by approximately 5,000 between 2008 and 2017. This is a 12.1 percent growth over 10 years. However, U.S. citizens and permanent residents contributed to the majority of this increase in doctorate degrees, growing 16.0 percent. Temporary visa holders, on the other hand, earned only seven percent more doctorate degrees in 2017 than they did in 2018. It is important to note that, nonetheless, out of 54,664 total doctorate degrees awarded in 2017, a significant 16,323 of them went to temporary visa holders. Additionally, Figure 2 also includes four additional categories specifically concerning temporary visa holders. I will discuss these trends in the following pages.
Figure 2 Here
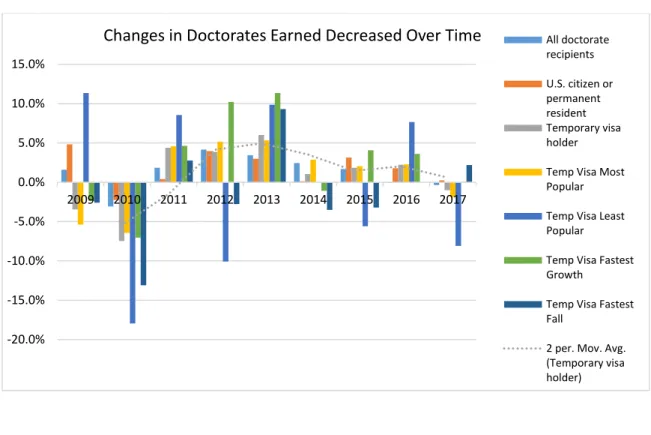
To better understand the trends in U.S. doctorates earned, I analyzed the year-over-year rates of change of the number of doctorates award to U.S. citizens and permanent residents versus those awarded to temporary visa holders. For example, columns in the year 2009 show the percentages changes from 2008 to 2009. Figure 3 includes four additional data categories regarding temporary visa holders. These
20
look into the changes in educational interest of these highly skilled immigrants. Figure 3 shows four trends:
1. Year-over-year percentage changes overall decreased over time, marked by smoothening oscillations in the dotted moving average line (see “Mov. Avg.” in legend).
2. Year-over-year percentage changes for “All doctorate recipients” remained low, never rising or falling by more than five percent between 2009 and 2017.
3. Year-over-year percentage changes for “Temp Visa Most Popular” also remained relatively stable between 2009 and 2017, hovering between two to seven percent. 4. Year-over-year percentage changes for “Temp Visa Least Popular”, “Temp Visa
Fastest Growth”, and “Temp Visa Fastest Fall” created the largest rises and dips in the graph. These large oscillations indicate the need for a closer examination of changes in temporary visa holders’ fields of study preferences.
Figure 3 Here
Next, I mapped the four field categories on four graphs to examine changes in temporary visa holders’ fields of study. Figure 4 shows that temporary visa holders have been most interested in earning doctorates in science and engineering. In fact, the number of U.S. doctorates awarded to temporary visa holders in these nine fields rose eight percent between 2008 and 2017, one percent higher than the seven percent average increase for all doctorates awarded to temporary visa holders. Furthermore, the
21
and the number of computer science and mathematics doctorates rose by 16.6 percent. These two growth rates surpass the 12.1 percent growth rate for all doctorates awarded in the U.S. and are on par with the 16.0 percent growth rate for doctorates awarded to U.S. citizens and permanent residents.
Figure 4 Here
The total number of doctorates awarded to temporary visa holders in the nine least popular fields of study decreased from slightly above 800 per year to slightly above 700 per year between 2008 and 2017, making an eight point five percent decrease. Fields including sociology, education administration, and teacher education all contributed to this decrease. Surprisingly, aerospace, aeronautical, and astronautical engineering
doctorates for temporary visa holders also fell by roughly four percent between 2008 and 2017, in contrast with the emphatic rise in interest for other engineering fields. The overwhelming trend in Figure 5, however, is that temporary visa holders are increasingly less interested in earning U.S. doctorates in social sciences and the liberal arts.
Figure 5 Here
22
Figure 6 Here
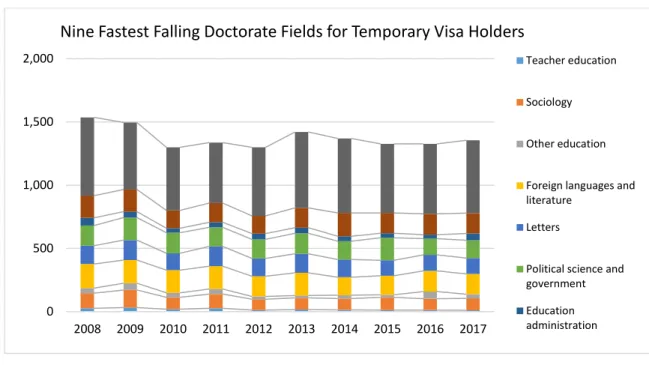
Finally, Figure 7 shows that the fastest falling doctorate fields for temporary visa holders decreased by 11.8 percent from 2008 to 2017. These nine fields overlap with the nine least popular fields, but also contain foreign languages and literature, political science and government, industrial manufacturing and engineering, and business management and administration. Seeing the latter two fields on this list was surprising. Falling industrial manufacturing and engineering doctorates amongst immigrants may have to do with slowing employment demand in this field and rising manufacturing expertise overseas; in fact, the number of doctorates awarded to U.S. citizens and permanent residents in industrial manufacturing and engineering also dropped by over four percent between 2008 and 2017. The decrease in popularity for doctorate degrees in business management and administration is also surprising, but many immigrants come to the U.S. to earn their Masters in Business Administration (MBA) instead of doctorates.
Figure 7 Here
23 Citizenship Status
The Survey of Earned Doctorates offered two types of citizenship status data. The first type of data aggregated the top 40 countries or economies of origin of temporary visa holders earning doctorates at U.S. colleges and universities in 2017. Figure 8 below indicates that China, India, and South Korea immigrants earned more than half of all doctorates awarded in the U.S. in 2017. This is not surprising knowing that Asian
immigrants have performed extremely well in U.S. academia, corporations, and startups.
Figure 8 Here
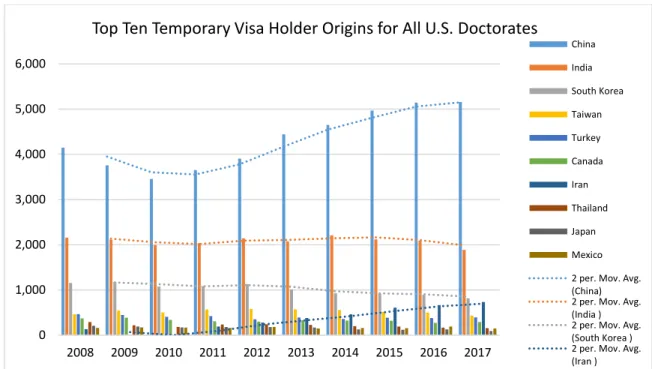
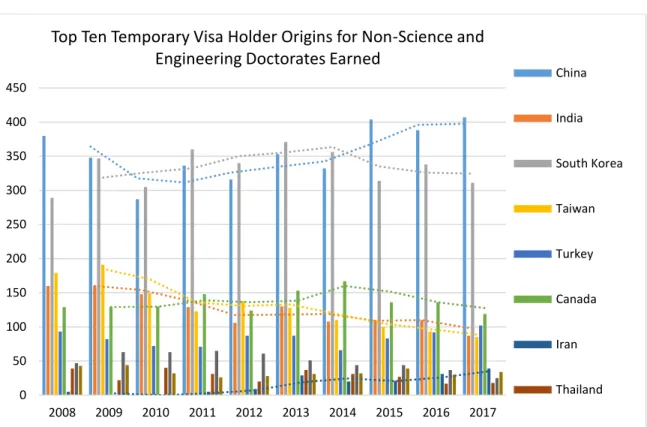
The second type tracks doctorates awards for 10 largest countries of origin of temporary visa holders earning doctorates at U.S. colleges and universities, by country or economy of citizenship and fields of study from 2008 to 2017. I further split this data into doctorates earned in science and engineering fields and non-science and engineering fields because the “Fields of Study” analysis above indicated that temporary visa holders are earning increasingly more doctorate degrees in science and engineering and fewer degrees in other fields. Figure 9 below supports the findings from Figure 8: Chinese, Indian, and South Korea temporary visa holders have earned the majority of U.S. doctorates in all fields. However, data here identifies two interesting trends:
24
coming to the U.S. for their doctorate degrees or that they are coming to the U.S. for other types of education and employment opportunities.
2. Number of doctorate degrees awarded to Iranian temporary visa holders more than tripled between 2011 and 2017. They could soon overtake South Korean immigrants for the third largest group on this list and become a very significant population in the U.S. talent pool in the next decade if they sustain the trajectory.
Figure 9 Here
Isolated science and engineering degrees data produces three key takeaways:
1. In science and engineering fields, Chinese, Indian, and South Korean temporary visa holders even more overwhelmingly dominate the number of doctorate
degrees earned. China and Iran’s rising trends and India and South Korea’s falling trends continue to persist. Figure 10 strongly supports the findings from Figure 9. 2. Trends are less clear in non-science and engineering fields, shown in Figure 11.
25
Figures 10 and 11 Here
Capital IQ Immigrant Data
For the second analysis within the Education and Retention Methodology, I acquired public Capital IQ data containing the name, age, location, education, and professional background of 2,972 highly skilled immigrants who received at least one degree from a U.S. higher education institution. The following analysis explored the educational origins and entrepreneurial outcomes of this sample.
Educational Background
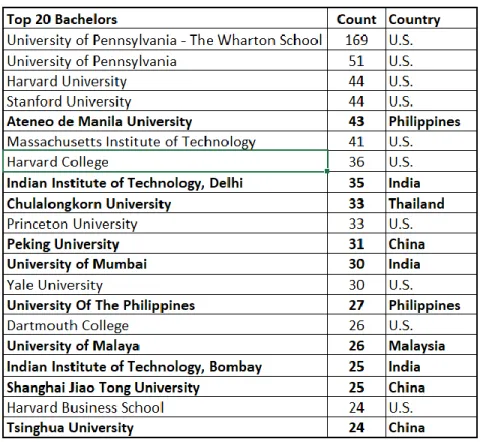
Out of all the education institutions that the 2,972 individuals attended, I took the top 20 institutions where these immigrants earned their Bachelor’s Degrees, shown in Table 2 below. No institution outside of the U.S. and Asia made this top 20 list.
Table 2 Here
Out of all 824 immigrants captured in Table 3 who earned their Bachelor’s Degrees from these top 20 institutions, 63.7 percent earned their bachelor’s degrees from U.S. universities. The other 36.3 percent earned them from Asian universities. Chinese and Indian universities each awarded roughly 10 percent of these Bachelor’s Degrees.
26
After understanding the educational origins of these immigrants, I wanted to find out how many of them founded their own businesses. Out of the 2,972 individuals in the sample, 1,795 are alive and reported their age. Table 4 shows that 618 (34.4 percent) out of these 1,795 individuals self-identified as founders. From their professional background descriptions, most of the self-identified founders started their own businesses, nonprofits, or philanthropic foundations. Most founders are now between the ages of 30 and 70, with an average age of 58 and standard deviation of 11.4. While I was not able to calculate the exact percentage of founders who practiced entrepreneurship in the U.S. versus in another country, their professional background descriptions indicate that an overwhelming
majority of them returned to their countries of origin to start their businesses. Similarly, most individuals in the overall sample ultimately returned to their countries of origin for employment. Findings from this analysis pose a difficult outlook for the U.S.’ ability to remain highly skilled immigrants and immigrant entrepreneurs.
Table 4 Here
LinkedIn Entrepreneur Profiles
From the 618 founders captured in the Capital IQ sample, I selected five individuals ages 35 or younger around whom to build entrepreneur profiles. I
supplemented their professional backgrounds captured from Capital IQ with their public LinkedIn profiles and company websites. I used LinkedIn primarily to find each
27
Name Age Education
John Riady 33 Georgetown University (BA) The Wharton School (MBA) Columbia Law School (JD)
Name of Venture: Venturra Capital
Location: Jakarta, Indonesia
Description: Venturra Capital is a Southeast Asia focused venture capital firm investing in early stage high-growth businesses. The firm’s primarily invests in internet companies that are ready to expand internationally in e-commerce, financial technology, marketplaces, healthcare and education (Venturra Capital, 2019).
Name Age Education
Anand Piramal
33 University of Pennsylvania (BA) Harvard Business School (MBA)
Name of Venture: Piramal Swasthya
Location: Mumbai, India
28
Name Age Education
Gautam Shewakramani
35 University of Notre Dame School of Engineering (BA) MIT Sloan School of Management (MBA)
Name of Venture: AudioCompass
Location: Mumbai, India
29
Name Age Education
Piyush Jain 33 The Wharton School (BS)
John F. Kennedy School of Government (MPP)
Name of Venture: Impact Guru Technology Ventures Private Ltd.
Location: Mumbai, India
Description: “Impact Guru Technology Ventures Private Limited provides a
30
Name Age Education
Jiaxin Li 34 Harvard College (BA)
Harvard Business School (MBA)
Name of Venture: VascuLogic
Location: New Jersey, United States
Description: VascuLogic is a startup focused on developing and commercializing image-guided medical devices and diagnostic products. The company developed a tool called VenousPro, which promised improved patient experience, increased lab and hospital performance, and better practitioner health and safety (VascuLogic, 2019). After leaving VascuLogic, Ms. Li joined Lilly Asia Ventures in Hong Kong and Shanghai as a partner, where she is interested in “breakthrough technologies within biotech, medtech and diagnostics across the board-stage agnostic (from incubation to pre-IPO)” (Li, 2019).
Not only do these entrepreneur profiles show a strong trend of high-achieving, U.S.-educated immigrants returning to their home countries in Asia after graduation, they also feature post-graduate entrepreneurial endeavors in a wide range of industries. These HSIEs are innovating in venture capital, telemedicine, crowdfunding, travel, and biotech. The five profiled entrepreneurs most likely could have attained prestigious and
31
II. Findings from Education and Retention Analysis
In the analysis above, I presented data and findings from three components of data: Survey of Earned Doctorates, Capital IQ immigrant data, and LinkedIn entrepreneur profiles. Synthesis of the three components produced the following four findings
regarding the ability of U.S. education institutions to attract and retain highly skilled immigrants:
1. The total number of temporary visa holders seeking doctorate education in the U.S. has increased 19.7 percent from 2010 to 2017. Furthermore, volatility in temporary visa holders’ demand for doctorate degrees from U.S. education institutions stabilized over the past decade.
2. Temporary visa holders’ demand for U.S. doctorate degrees concentrates in engineering, life and physical sciences, mathematics, and computer science. Demand for degrees in these fields have grown. Demand for degrees in social sciences, liberal arts, and education administration is low and falling.
3. Asian countries and universities lead the world in sending doctorate candidates and highly skilled immigrants to the U.S. China sends by far the most number of doctorate degree seekers and continues to send more each year. Iran is also quickly ramping up its doctorate degree seeker diaspora to the U.S. On the other hand, the numbers of Indian and South Korean temporary visa holders seeking doctorate degrees in the U.S. have declined.
32
Many of them now also invest in their home countries as corporate investors, venture capitalists, and angel investors. These entrepreneurs frequently originate from India and China, and came to the U.S. to attend prestigious universities, often in the Ivy League. A significant portion of these immigrants also built successful corporate careers in the U.S. in the 1990s and early 2000s before returning home in the past decade.
Overall, U.S. education institutions continue to attract the world’s best and brightest talent but struggle to retain them. This is issue particularly manifests in business and entrepreneurship. The lack of retention could reflect room for improvement in post-graduate career placement, corporate recruiting strategy, and the attractiveness of the U.S. entrepreneurial ecosystem.
III. Analysis of Startup Formation Data
33
“Unicorn” Data
I began this analysis by sorting all the “unicorns” by year and region. New
“unicorns” arise each year and existing unicorns sometimes fail or exit; I intended to keep track of all these changes. As explained in the “Research Methodology,” I tracked
changes in five “unicorn” trends. First, I mapped changes in the total number of “unicorns” globally from 2014 to 2019. Figure 12 below shows that the world saw the most number of “unicorns” in 2016 and 2017, after which the number declined across the board. Nevertheless, the U.S. has consistently held approximately twice the number of “unicorns” as all of Asia combined. From 2014 to 2015, Asian “unicorns” in total were worth approximately 50 percent the valuation of all U.S. “unicorns.” During the peak “unicorn” years of 2016 and 2017, total valuation of Asian “unicorns” climbed to three-quarters the total valuation of U.S. “unicorns.” As global total “unicorn” valuations declined in 2018 and 2019, Asian “unicorn” valuation fell dramatically while U.S. “unicorn” valuation rose. Figure 13 shows that as of January of 2019, total Asian “unicorn” valuation to total U.S. “unicorn” valuation ratio fell to 42.5 percent.
Figures 12 and 13 Here
34
2019. Figure 14 shows that the China contends with the U.S. as one of the only two countries in the world that have been able to create “unicorns” of such massive size.
Figure 14 Here
Furthermore, Asia may also be contending with the U.S. in its ability to birth new “unicorns.” Figure 15 clearly indicates that Asia has almost caught up with the U.S. in its number of “unicorns” valued at $1 billion. Asia now holds 18 of the world’s 42 $1 billion “unicorns” while the U.S. holds 19. This trend reflects a quickly maturing startup
ecosystem and “unicorn” pipeline in Asia. Further analysis showed that Asia will continue to add 2.2 new billion-dollar “unicorns” per year according to the following regression:
𝑵𝒖𝒎𝒃𝒆𝒓 𝒐𝒇 $𝟏 𝑩𝒊𝒍𝒍𝒊𝒐𝒏 “𝑼𝒏𝒊𝒄𝒐𝒓𝒏𝒔”̂ 𝑨𝒔𝒊𝒂 = −𝟒𝟒𝟐𝟎. 𝟖𝟎 + 𝟐. 𝟐𝟎 × 𝒀𝒆𝒂𝒓+∊
R2 Asia: 0.57
Significant at 0.1
I could not draw conclusions for U.S. $1 billion “unicorns” due to low R2 and low significance level, but the trend seems to be stagnant and slightly declining.
Figure 15 Here
35
almost twice the number of “unicorns” as the rest of the world combined. Regressions for future U.S. and Asia “unicorn” exits show predictions of strong growth in both regions:
𝑵𝒖𝒎𝒃𝒆𝒓 𝒐𝒇 “𝑼𝒏𝒊𝒄𝒐𝒓𝒏𝒔” 𝑬𝒙𝒊𝒕𝒔̂ 𝑼.𝑺. = −𝟐𝟎𝟏𝟑𝟐. 𝟑𝟎 + 𝟏𝟎. 𝟎𝟎 × 𝒀𝒆𝒂𝒓+∊
R2 U.S.: 0.97 Significant at 0.001
𝑵𝒖𝒎𝒃𝒆𝒓 𝒐𝒇 “𝑼𝒏𝒊𝒄𝒐𝒓𝒏𝒔” 𝑬𝒙𝒊𝒕𝒔̂ 𝑨𝒔𝒊𝒂 = −𝟓𝟔𝟑𝟓. 𝟖𝟕 + 𝟐. 𝟖𝟎 × 𝒀𝒆𝒂𝒓+∊
R2 Asia: 0.97 Significant at 0.001
The regressions suggest that Asia is very unlikely to catch up with the U.S. in total “unicorn” exits in the near future.
Figure 16 Here
The above analyses hint at the growing success of entrepreneurship outside of the U.S. Does this mean that the reverse brain drain has led highly skilled U.S-educated entrepreneurs to start their “unicorns” in other countries? I ran two calculations identifying the numbers of Asian and European “unicorns” founded by U.S.-educated entrepreneurs to answer this question. Figures 17 and 18 below display the findings.
36
Trends in Figures 17, 18, and 19 indicate that while over a dozen “unicorns” each year in Europe and Asia have U.S.-educated entrepreneurs as their founders, the reverse brain drain of U.S.-educated entrepreneurs has not directly, or significantly, contributed to “unicorn” formation abroad. However, this does not mean the diaspora of HSIEs away from the U.S. does not boost global entrepreneurial ecosystems. Furthermore, U.S.-educated entrepreneurs founded the majority of the U.S.’ “unicorns,” which suggests that the reverse brain drain may not directly weaken the U.S. startup formation capabilities.
IV. Findings from Startup Formation Analysis
I have now analyzed changes in five different “unicorn” trends. The analysis yielded four findings:
1. The U.S. and Asia hold 88.9 percent of the world’s “unicorns,” and the U.S. will most likely hold onto its claim over the majority of the world’s total “unicorns.” 2. Asia has almost caught up with the U.S. in startup formation capability. Asia now
almost holds the same number of $1 billion unicorns as does the U.S. and may be able to take the lead in the next five years. Having more $1 billion “unicorns” reflects a maturing and increasingly successful startup formation ecosystem. 3. Unlike the rest of the world, the U.S. is able to continue to exit more “unicorns”
each year. Considering that the U.S. holds only twice as many “unicorns” as Asia but has over three times the number of exits, the U.S. appears to be more
37
4. The majority of “unicorn” founders in Europe and Asia are not educated in the U.S., which suggests the reverse brain drain does not directly benefit foreign startup formation.
38
CONCLUSION, RECOMMENDATIONS, AND IMLPICATIONS
I. Conclusion
Current literature paints a rather grim outlook for the future of U.S.
entrepreneurship and competitive advantage based on the perceptions that HSIEs are fleeing the country, and that countries in Asia and other regions of the world threatens American hegemony in entrepreneurship. My thesis suggests that the macro reality is much less desperate and antagonistic. The flow entrepreneurial talent will likely continue, but so will the symbiotic exchange of people and ideas. Immigrants arrive in the U.S. each year with a growing interest in studying science and engineering and many of these highly skilled immigrants do become entrepreneurs. The crucial distinction is that the days of Sergey Brin, Jerry Yang, and Andrew Grove are over. Immigrants now have the freedom to share the knowledge, talents, and experience they gained during their tenure in the U.S. with the rest of the world. During the first great wave of 20th century
39
21st century entrepreneurial diaspora, where competition among global entrepreneurial ecosystems has created options for entrepreneurs and incentive for countries and firms to reimagine future talent strategies.
Nevertheless, findings in this thesis suggest that current global entrepreneurial talent flows are indirectly boosting native, entrepreneurship in global regions such as China, India, and Germany. Synthesis of Education and Retention and Startup Formation findings hint at the following four trends:
1. Highly skilled immigrants highly demand and value U.S. education.
2. More HSIEs and highly skilled, U.S.-educated immigrants choose to return to their home countries after U.S. educations. Declines in HSIE retention could negatively affect the number of “unicorns” in the U.S. in coming decades as global flow of entrepreneurial talent continues.
3. Most returnees do not found “unicorns,” and many of them pursue careers outside of entrepreneurship; but they actively participate in the local entrepreneurial ecosystem through investment and diffusion of knowledge. 4. Countries that send large numbers of immigrants to the U.S. and receive large
numbers of U.S.-educated returnees also hold the largest share of “unicorns” outside of the U.S.
40
democratization of entrepreneurial capability is not a zero-sum game but a global advancement of people and ideas.
II. Recommendations
U.S. political and business leaders these days frequently tout a “global war for talent.” While this tension may be unavoidable in the short term, recommendations in this thesis use data and research to suggest future possibilities for policy makers, education institutions, and firms.
Policy makers at the federal, state, and local levels should take interest in fostering entrepreneurship. A challenge preventing policy makers from enacting better entrepreneurship policies is the incredibly high startup failure rate. Investing in
entrepreneurship can appear much less popular for securing constituent support and reelection than investing in partnerships with brand name corporations. Governments in the greater Washington, D.C. metropolitan area, including D.C., Bethesda, Crystal City, and Tyson’s Corner, spent billions of dollars in tax incentives in the last decade to attract companies such as Capital One, Marriott International, The Advisory Board Company, and Amazon. Unfortunately, research shows that these incentive deals almost never realize the desired return on investment (Krätke, 2010). Instead of spending billions of dollars on tax incentives, governments could direct funds to support entrepreneurs in three ways.
41
benefits, or tuition waivers. These programs reduce the social and economic risk of entrepreneurship and thus encourage entrepreneurial activity.
Second is the Chile model, where the government offers extensive resources to help established entrepreneurs succeed. U.S. governments at all levels could better fund large accelerators modeled after Santiago’s Start-Up Chile program to provide capital, training, real estate, mentorship, and global networks access to entrepreneurs. This thesis showed that the reverse brain drain has given the U.S. a superior global network of HSIEs. The U.S. governments can capitalize on this network to help U.S. startups become more globally competitive while remaining headquartered in the U.S.
A third option is what I call a Multi-Layer model, where governments understand and support nuanced layers in the U.S. entrepreneurial ecosystem. Highly skilled
immigrants who do not become entrepreneurs themselves but are still interested in entrepreneurship can play a huge role in this model. Instead of primarily focusing on startup entities or individual entrepreneurs, this model identifies the multiple levels of organizations supporting the startup ecosystem. Figure 19 below gives examples of such organizations but does not imply any inherent hierarchy between the types of
organizations mentioned.
Figure 19 Here
42
Optional Practical Training (U.S. Citizenship and Immigration Services, 2018), and aiding immigrant students and employees in the naturalization process. The reality is that would-be HSIEs continue to feel constrained by their reliance on visa sponsorship from universities and companies. Consequently, highly skilled immigrant students and workers who earned their degrees in highly-demanded fields such as life and physical sciences, engineering, and computer science are often forced to remain in stagnant roles in the U.S. or return to their home countries. Governments, education institutions, and firms share the responsibility of liberating the entrepreneurial potential of these HSIEs.
III. Implications
This thesis has assessed current literature on immigrant entrepreneurship and informed some gaps of knowledge on the global flow of HSIEs, U.S. educational institutions’ ability to attract and retain highly skilled immigrants, and trends in global startup formation capabilities. Finally, I consider the policy implication of this thesis and propose questions for future research.
Policy Implication
43
U.S. policy makers may benefit from keeping entrepreneur retention in mind when legislating over education, immigration, and foreign policy.
Research Implications
First, there is a serious need for a novel and transferable method to track
entrepreneur immigration and calibrate the progress of global talent flow. As explained in the “Limitations” section, it is currently difficult to collect data on the movements and future plans of highly skilled immigrants, and it is even more difficult to obtain this data for entrepreneurs. Bernstein et al. (2018) matched discrete inventors with their
immigration statuses using Social Security Number (SNN) data by comparing at what age the individuals received their SSNs. While this method worked well in the U.S., future researchers may struggle to transfer this technique to other countries. Making this data available, whether through public or private efforts, will aid all stakeholders in the global entrepreneurial ecosystem identified in Figure 19 advance entrepreneurial outcomes.
Next, it would behoove governments to understand the critical mass of HSIE boomerangs, or returnees necessary to jumpstart native entrepreneurship. Each country may find different answers based on its own economic, political, and technological situations, but success stories in Chile, China, and India can provide models for emulation.
44
industry. This analysis could point to more nuanced differences between the U.S. and Asia that this thesis might have missed.
Finally, education will continue to be indispensable to entrepreneurship. Deep analysis of the correlation between offerings at education institutions and entrepreneurial outcome of alumni could yield pedagogical and operational wisdom. Course offerings, networks, faculty experience, and the availability of experiential entrepreneurship opportunities on campus may all contribute to the molding of future entrepreneurs, but current literature has not yet reached consensus on this topic. A probit regression isolating educational characteristics could yield useful results for this question.
45 REFERENCES
AudioCompass. (2019). Your personal audio travel guide. Retrieved March 7, 2019, from http://www.audiocompass.in/#About
Austin, S., Canipe, C., & Slobin, S. (2019, January). The Billion Dollar Startup Club. Retrieved February 6, 2019, from https://www.wsj.com/graphics/billion-dollar-club/
Barakat, A., & Parhizgar, K. D. (2013). Highly-skilled immigrant entrepreneurs in the United States and the unique competitive advantages that they possess over their unskilled counterparts. Competition Forum, 11(1), 103-115. Retrieved from http://libproxy.lib.unc.edu/login?url=https://search.proquest.com/docview/175580 3859?accountid=14244
Bernstein, S., Diamond, R., McQuade, T., & Pousada, B. (2018). The Contribution of High-Skilled Immigrants to Innovation in the United States. (Working Paper No. 3748) Stanford Graduate School of Business.
Bloomberg. (2019). Company Overview of Impact Guru Technology Ventures Private Limited. Retrieved March 7, 2019, from
46
Feinleib, D. (2012). Why Startups Fail: And How Yours Can Succeed. New York: Apress.
Fontana, R., & Vezzulli, A. (2016). Technological Leadership and Persistence in Product Innovation in the Local Area Network Industry 1990–1999. Research Policy, 45(8), 1604-1619. doi:10.1016/j.respol.2016.04.002
González, J. D., & Campbell, D. G. (2018). Beyond the enclave: Success strategies of immigrant entrepreneurs. International Journal of Applied Management and Technology, 18(1) Retrieved from
http://libproxy.lib.unc.edu/login?url=https://search.proquest.com/docview/210308 2654?accountid=14244
Granovetter, M. S. (1973). The Strength of Weak Ties. American Journal of Sociology,78(6), 1360-1380. doi:10.1086/225469
U.S. Citizenship and Immigration Services (2019, March 19). H-1B Fiscal Year (FY) 2020 Cap Season. Retrieved March 17, 2019, from
https://www.uscis.gov/working-united-states/temporary-workers/h-1b-specialty-occupations-and-fashion-models/h-1b-fiscal-year-fy-2020-cap-season
Krätke, S. (2010). ‘Creative Cities’ and the Rise of the Dealer Class: A Critique of Richard Floridas Approach to Urban Theory. International Journal of Urban and Regional Research,34(4), 835-853. doi:10.1111/j.1468-2427.2010.00939.x
47
Leone, V., & Medeiros, O. R. (2015). Signaling the Dotcom Bubble: A Multiple Changes in Persistence Approach. The Quarterly Review of Economics and Finance, 55, 77-86. doi:10.1016/j.qref.2014.08.006
Lee, J. (n.d.). LinkedIn Profile. Retrieved March 7, 2019, from https://www.linkedin.com/in/judithjli/
Piramal Swasthya. (2019). Accessible, Affordable, Available Healthcare. Retrieved March 7, 2019, from http://www.piramalswasthya.org/
Saxenian, A. (1999). Silicon Valley’s New Immigrant Entrepreneurs. Public Policy Institute of California, ISBN: 1-58213-009-4
Saxenian, A. (2002). Silicon Valley’s New Immigrant High-Growth Entrepreneurs. Economic Development Quarterly, 16(1), 20-31. doi:10.1177/0891242402016001003
Schlosser, F., & Zolin, R. (2013). Characteristics of Immigrant Entrepreneurs and Their Involvement in International New Ventures. Thunderbird International Business Review, 55(3). doi:10.2139/ssrn.2954218
Start-Up Chile. (2014). The S Factory G9 is now Open! Retrieved December 4, 2018, from http://www.startupchile.org/
Survey of Earned Doctorates. (2017). Retrieved February 1, 2019, from https://sedsurvey.org/DataUsers/Reports
48
U.S. Citizenship and Immigration Services. (2018, August 09). Optional Practical Training (OPT) for F-1 Students. Retrieved March 8, 2019, from
https://www.uscis.gov/opt
United States Citizenship and Immigration Services. (2018). Per Country Limit.
Retrieved December 2, 2018, from https://www.uscis.gov/tools/glossary/country-limit
The United States Department of State. (2017). The Immigration and Nationality Act of 1952 (The McCarran-Walter Act). Retrieved October 30, 2018, from
https://history.state.gov/milestones/1945-1952/immigration-act
VascuLogic. (2018). Developing and commercializing image-guided medical devices and diagnostic products. Retrieved March 7, 2019, from http://www.vasculogic.com/
Venturra Capital (2019). Indonesia Venture Capital Firm For Tech Startups. Retrieved March 7, 2019, from https://www.venturra.com/
Wadhwa, V. (2009a). An Outflow of Talent: Nativism and the US Reverse Brain Drain. SSRN Electronic Journal. doi:10.2139/ssrn.1424282
Wadhwa, V. (2009b). Tapping Talent in a Global Economy: A Reverse Brain Drain.
Issues in Science and Technology. Retrieved from: https://issues.org/wadhwa-2/ Wadhwa, V. (2012). The Immigrant Exodus: Why America is Losing the Global Race to
49
Wadhwa, V., Jasso, G., Rissing, B. A., Gereffi, G., & Freeman, R. B. (2007). Intellectual Property, the Immigration Backlog, and a Reverse Brain-Drain: Americas New Immigrant Entrepreneurs, Part III. SSRN Electronic Journal.
doi:10.2139/ssrn.1008366
Wadhwa, V., Saxenian, A., Freeman, R. B., & Gereffi, G. (2009). Americas Loss is the Worlds Gain: Americas New Immigrant Entrepreneurs, Part IV. SSRN Electronic Journal. doi:10.2139/ssrn.1348616
Wadhwa, V., Saxenian, A., & Rissing, B., & Gereffi, G. (2007). Americas New Immigrant Entrepreneurs, Part I. SSRN Electronic Journal.
doi:10.2139/ssrn.2159875
Wadhwa, V., Saxenian, A., & Siciliano, F. D. (2012). Then and Now: Americas New Immigrant Entrepreneurs, Part VII. SSRN Electronic Journal.
50 APPENDICES
Table 1: Categories of "Unicorn" Analysis
Geographic Categories Financial Categories
Global Total Total “Unicorns” by Region
U.S. “Unicorns” Valued Over $40 Billion
Asia “Unicorns” Valued at $1 Billion
Europe Total Value of “Unicorns” by Region
51
52
Table 3: Undergraduate Origins of Immigrant Sample by Country
53
Figure 2: All U.S. Doctorate Recipients 2008-2017
0 10,000 20,000 30,000 40,000 50,000 60,000
2008 2009 2010 2011 2012 2013 2014 2015 2016 2017
All Doctorate Recipients
All doctorate recipients
U.S. citizen or permanent resident
Temporary visa holder
Temp Visa Most Popular
Temp Visa Least Popular
Temp Visa Fastest Growth
Temp Visa Fastest Fall Analysis & Findings Analysis & Findings
Conclusion
Education & Retention Startup Formation54
Figure 3: Changes in U.S. Earned Doctorates 2009-2017
Figure 4: Ten Most Popular Doctorate Fields for TVHs
-20.0% -15.0% -10.0% -5.0% 0.0% 5.0% 10.0% 15.0%
2009 2010 2011 2012 2013 2014 2015 2016 2017
Changes in Doctorates Earned Decreased Over Time All doctorate
recipients
U.S. citizen or permanent resident Temporary visa holder
Temp Visa Most Popular
Temp Visa Least Popular
Temp Visa Fastest Growth
Temp Visa Fastest Fall
2 per. Mov. Avg. (Temporary visa holder) 0 5,000 10,000 15,000 20,000 25,000
2008 2009 2010 2011 2012 2013 2014 2015 2016 2017
Ten Most Popular Doctorate Fields for Temporary Visa Holders Engineering
Life sciences
Biological and biomedical sciences
Physical sciences and earth sciences
Mathematics and computer sciences
Psychology and social sciences
55
Figure 5: Ten Least Popular Doctorate Fields for TVHs
Figure 6: Nine Fastest Growing Fields for TVHs
0 100 200 300 400 500 600 700 800 900 1,000
2008 2009 2010 2011 2012 2013 2014 2015 2016 2017
Ten Least Popular Doctorate Fields for Temporary Visa Holders
Other education Education administration Anthropology Sociology Communication Aerospace, aeronautical, and astronautical engineering Letters History 0 1,000 2,000 3,000 4,000 5,000 6,000 7,000 8,000
2008 2009 2010 2011 2012 2013 2014 2015 2016 2017
Nine Fastest Growing Doctorate Fields for Temporary Visa Holders
Other engineering
Materials science engineering Mathematics and statistics
Agricultural sciences and natural resources Non-S&E fields nec
Psychology
Health sciences
56
Figure 7:Nine Fastest Falling Doctorate Fields for TVHs
Figure 8: Chinese, Indian, and South Korean Doctorate Earners
0 500 1,000 1,500 2,000
2008 2009 2010 2011 2012 2013 2014 2015 2016 2017
Nine Fastest Falling Doctorate Fields for Temporary Visa Holders
Teacher education
Sociology
Other education
Foreign languages and literature
Letters
Political science and government
Education administration
China, India, and South Korea,
8,664
All Other Countries or Economics, 7,517
China, India, and South Korea Dominate Number of Doctorates Earned in 2017
57
Figure 9: Top Ten TVH Origins
Figure 10: Top Ten TVH Origins for Science and Engineering
0 1,000 2,000 3,000 4,000 5,000 6,000
2008 2009 2010 2011 2012 2013 2014 2015 2016 2017
Top Ten Temporary Visa Holder Origins for All U.S. Doctorates
China India South Korea Taiwan Turkey Canada Iran Thailand Japan Mexico 2 per. Mov. Avg. (China) 2 per. Mov. Avg. (India ) 2 per. Mov. Avg. (South Korea ) 2 per. Mov. Avg. (Iran ) 0 1,000 2,000 3,000 4,000 5,000 6,000
2008 2009 2010 2011 2012 2013 2014 2015 2016 2017
Top Ten Temporary Visa Holder Origins for Science and Engineering
Doctorates China
58
Figure 11: Top Ten TVH Origins for Non-S&E
Figure 12: Total "Unicorns" by Region
0 50 100 150 200 250 300 350 400 450
2008 2009 2010 2011 2012 2013 2014 2015 2016 2017
Top Ten Temporary Visa Holder Origins for Non-Science and Engineering Doctorates Earned
China India South Korea Taiwan Turkey Canada Iran Thailand 0 20 40 60 80 100 120 140 160 180
2014 2015 2016 2017 2018 2019
Total "Unicorns" by Region
59
Figure 13: Total "Unicorn" Valuations by Region
Figure 14: "Unicorns" >$40B by Region
0 100 200 300 400 500 600 700 800
2014 2015 2016 2017 2018 2019
Total "Unicorn" Valuations by Region
Total Valuations ($B) U.S. Asia Europe Other
0 0.5 1 1.5 2 2.5 3 3.5
2014 2015 2016 2017 2018 2019
"Unicorns" >$40B by Region
60
Figure 15: Total $1B "Unicorns" by Region
Figure 16: Total "Unicorn" Exits by Region
0 10 20 30 40 50 60
2014 2015 2016 2017 2018 2019
Total $1B "Unicorns" by Region
Total $1B U.S. Asia Europe Other
0 10 20 30 40 50 60 70 80 90
2014 2015 2016 2017 2018 2019
Total "Unicorn" Exits by Region
61
Figure 17: Asian "Unicorn" Founders Education
62
Figure 19: U.S. "Unicorn" Founders Education
Figure 20: Startup Ecosystem Pyramid Diagram
0 20 40 60 80 100 120
2014 2015 2016 2017 2018 2019
N u m b er o f "U n icorn s" Year
U.S. "Unicorn" Founders are Mostly Educated in U.S., followed by U.K., India, and Israel
U.S. U.K. Germany France India Israel
Startups and Entrepreneurs
Acelerators, Investors, and Mentors
Networks, Support Platforms, Summits, Conferences, and Corporate Initiatives