STAYING
HOME
An Evaluation of North Carolina’s
Urgent Repair Program
ERIKA BRANDT
1
Executive Summary
Among other programs of the North Carolina Housing Finance Agency (NCHFA), the Urgent Repair Program (URP) finances home repairs and modification for low-income households with special needs. URP aims to improve quality of life and choice for individuals who might otherwise have to endure substandard, unsafe housing conditions or enter institutional care settings.
This evaluation assesses the program’s outcomes and impact in three areas: (1) effectiveness, or how well URP prevents displacement and improves quality of life for participants; (2) spatial equity, or how the geographic distribution of URP investment compares to the distribution of need; and (3) cost efficiency, or how the program’s public costs compare to its public benefits. Participant surveys, GIS mapping, and cost/benefit analysis were used to evaluate URP’s performance in these three areas, respectively.
Findings revealed that URP has largely succeeded at improving participants’ quality of life, addressing spatially concentrated need, and creating savings to public health insurance systems:
Overall satisfaction with URP among surveyed participants was 90.7%;
URP is highly active in 76% of the counties with high proportions of eligible households; and Every $1 of URP funding could save up to $19 of Medicaid/Medicare spending.
Recommendations for improving the program include:
Improving program administration guidelines regarding project monitoring, quality control, and communication among local administrators, applicants/participants, and contractors; Increasing outreach to potential local program administrators in six underserved, high-need
counties (Alleghany, Ashe, Beaufort, Bladen, Chatham, and Jones); and
Coordinating with the North Carolina Department of Health and Human Services to enhance the provision of publicly-funded home and community-based long-term care services. Overall, this study provides evidence of URP’s positive statewide impact and fiscal cost
2
Contents
Executive Summary ... 1
Introduction ... 3
Background ... 4
Housing Challenges Facing Senior Homeowners ... 4
Programs to Assist Senior Homeowners ... 6
Evaluation Metrics and Methods ... 8
Effectiveness ... 8
Spatial Equity... 9
Cost Efficiency ... 10
Findings ... 11
Effectiveness ... 11
Equity ... 14
Cost Efficiency ... 15
Discussion & Recommendations ... 17
Effectiveness ... 17
Spatial Equity... 18
Cost Efficiency ... 19
Conclusion ... 20
References ... 21
3
Introduction
The North Carolina Housing Finance Agency (NCHFA) is the state entity responsible for providing affordable housing opportunities for North Carolinians whose housing needs are not met by the private market. One of its best-loved and longest running programs is the Urgent Repair Program (URP), which finances home repairs and modifications for low-income households (that include at least one member who is elderly, disabled, or otherwise suffers severe mobility impairments) so that those households can continue living safely in their homes. The program aims to keep some of the most vulnerable North Carolinians from being forced to leave their homes and enter institutional care. The degree to which URP truly achieves this end, however, is hard to confirm, as the primary evaluation metrics for URP have been intermediary outputs (e.g., number of units repaired) rather than actual outcomes (e.g., number of households who have avoided displacement or experience other quality of life improvements).1 Some preliminary investigation into the program’s potential impacts has been conducted, but more rigorous assessment, better tailored to the context of North Carolina and including data from beneficiaries of the program, is achievable and potentially
necessary for the program’s continued operation. Over the past decade, the North Carolina General Assembly’s appropriations to the state Housing Trust Fund, which funds URP, have decreased by 60%, heightening the need for robust and compelling program evaluation. Program funding is often contingent on perceived value, demonstrated through concrete, measurable outcomes.2 Assessing the actual outcomes and impacts of URP could provide firm evidence in support of continued program funding.
This study begins to fill this evaluation gap by examining several measures of the outcomes and fiscal impact URP has had on the state, counties, and people of North Carolina over the past decade. Most program evaluations done by state housing finance agencies are based solely on economic impact. They typically use input-output models, a quantitative method for demonstrating economic interdependencies within a given region. These studies generally highlight programs that stimulate new residential construction or substantial redevelopment, since these activities require the most spending and generate the most wages and jobs.3 Because URP is a relatively low-spending program, this evaluation model is not suited to measuring the program’s true impact. In order to provide a more complete picture of the program’s performance, it is necessary to move beyond the traditional economic impact approach and examine other aspects of program function and
outcomes. Providing evidence from a detailed evaluation of this program may improve the accuracy of its valuation by the General Assembly and demonstrate the need for stable funding. Furthermore, the evaluation methodology used expands the boundaries of traditional economic impact modeling favored by state housing finance agencies and provides a model for evaluating housing programs with hard-to-measure outcome goals.
First, this study explores the context surrounding the housing challenges facing senior and/or disabled homeowners and programs designed to address these challenges. Next, the study describes the evaluation metrics and methods used to assess the outcomes and impacts of North Carolina’s Urgent Repair Program. The paper concludes with a presentation of findings and discussion of recommendations for the program moving forward.
1 Mills-Scofield, 2012
4 FIGURE 2. Percent of homeowners with mortgage debt.
Source: Joint Center for Housing Studies, 2014
Background
Housing Challenges Facing Senior Homeowners
The United States housing market does not adequately meet the financial and physical needs of many elderly adults. As a result, many senior homeowners (particularly low- and fixed-income individuals) are unable to remain in their homes for their entire lifespans, and must enter
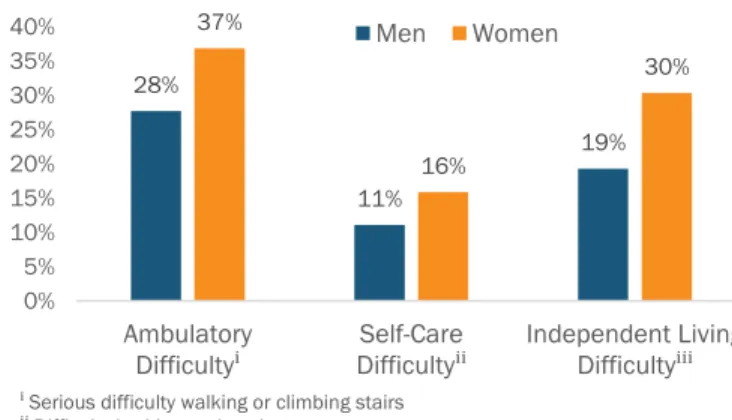
institutional care. Considering that the population segment over age 50 is projected to grow by 20% in the next 15 years, senior housing needs should be a top priority.4 More than a third of adults over age 50 are cost-burdened, meaning they pay over 30% of their income on housing expenses, with the heaviest burden falling on adults age 80 and older.5 In fact, an increasing percentage of seniors are living in poverty due to accumulation of health issues with age (Fig. 1) and rising medical costs over the past decade.6 In other words, most people are both paying for more frequent doctor visits as they age, and paying a higher price per visit—with dollars that could otherwise be put toward housing.
As adults enter old age, and become less physically and financially able to maintain their homes, the burdens of homeownership can start to outweigh the benefits. Although monthly mortgage payments are usually lower than rents for comparable properties, and home equity is an important means of wealth accumulation, the financial responsibilities of paying property taxes, insurance, and maintenance costs can become unsustainable for older adults with fixed incomes. The burden has grown over the past 20 years as more adults have carried mortgage debt into their retirement years (Fig. 2).
Furthermore, most housing in the United States is designed for younger adults, and not suitable for seniors who struggle with mobility and manual dexterity.7 Although homebuilding trends are moving toward accessibility, most older homeowners are living in older homes, not new, aging-friendly ones.8 These older homes become even less habitable as they age and
4 Joint Center for Housing Studies, 2014 5Ibid.
6 Brandon, 2012 7 Badger, 2014 8Ibid. 28% 11% 19% 37% 16% 30% 0% 5% 10% 15% 20% 25% 30% 35% 40% Ambulatory
Difficultyⁱ DifficultySelf-Careⁱⁱ Independent Living Difficultyⁱⁱⁱ
Men Women 0% 10% 20% 30% 40% 50% 60% 70% 80%
1992 1998 2004 2007 2010
Age 50-64 Age 65+
ⁱ Serious difficulty walking or climbing stairs
ⁱⁱ Difficulty bathing or dressing
ⁱⁱⁱ Difficulty doing errands alone due to a physical, mental, or emotional problem Source: U.S. Census Bureau, 2015
5 require maintenance, which many senior homeowners are physically and financially unable to
handle.
The impacts of these housing challenges are felt in many ways. A 2011 study found that adults who lived in homes they owned, as opposed to those who rent or live in institutional care, reported better mental health—an effect that increased as they aged.9 However, owning a home in disrepair without the means to fix it up was identified as a mental health stressor among owner-occupiers.10 Housing quality affects the physical health of older people as well, because susceptibility to illnesses
associated with low temperatures and time spent in the home both increase with age.11 Wealth differences add another layer of impact. In a recent case study, indoor home environments were found to differ more widely between poor and wealthy people than the surrounding neighborhood environment.12
Many elderly homeowners become so burdened by the costs of homeownership that they must leave their homes and enter institutional care. This decision often comes at a high price to their health and happiness, and to the public health insurance system. About 89% of adults prefer to age in place, or live in their homes for as long as possible rather than in assisted living facilities or nursing homes.13 This trend reflects not only individuals’ quality of life preferences, but also financial considerations. Nationally, the cost of living in a long-term care facility averages somewhere between $41,000 and $85,000 per year, whereas the cost of in-home care is about $30,000 per year.14 One side effect of North Carolina’s low wages, particularly for caregiving professions, is an even lower cost of in-home care in the state—about $22,000 per year.15 This suggests that allowing elderly and disabled people to stay in their homes longer can accrue cost savings of $20,000 or more each year.
These savings not only benefit recipients of URP home repairs, but North Carolina taxpayers at large. When seniors enter institutional care, a large share of the cost is paid through Medicaid (40%), Medicare Post-Acute Care (23%) and other public sources (3%).16 Medicaid also funds in-home services through the Home and Community Based Services waiver, but at about a third of the cost of paying for care in a nursing home.17
Further adding to taxpayer burdens, there is a high rate of potentially avoidable hospitalizations (PAHs) among older adults living in institutional settings, leading to poor health outcomes and costly care.18,19 Many long-term care facilities transfer patients to hospitals in order to access Medicare Post-Acute Care funds, which have a higher reimbursement rate than Medicaid.20 PAHs are particularly likely to occur among dual Medicare/Medicaid enrollees, who are, by definition, low-income seniors or people with disabilities. In 2009, the rate of PAHs was much higher among dual Medicare/Medicaid enrollees living in institutional care than among those living at home—comprising
9 Howden-Chapman et al., 2011 10Ibid.
11Ibid.
12 Lejeune et al., 2016 13 AARP, 2009
14 Reinhard et al., 2014 15 Freyer, 2016 16 Calmus, 2013 17 AARP, 2009
18 “Potentially avoidable hospitalizations” are defined as “hospitalizations that could have been avoided because the
condition could have been prevented or treated outside of an inpatient hospital setting” (Segal et al., 2014)
6 almost half of all PAHs—and the average cost per person of a PAH, paid through Medicare/Medicaid, was $8,783.21 Total national spending on long-term supports and services costs taxpayers about $200 billion each year.22 Considering the increased likelihood of PAHs among the population that URP serves, investment in URP could have a big fiscal impact on Medicare and Medicaid spending. It is important to acknowledge that avoiding institutionalization of low-income elderly and/or disabled homeowners has potential drawbacks for the workforce productivity and health outcomes of family caregivers. According to the AARP, 88% of long-term care is provided informally by uncompensated family members.23 In 2009, the average amount of informal care provided per caregiver was 20.4 hours per week for 4.6 years, which add up to a total of 4,880 hours.24 In the same year, median household income was $45,069, which breaks down to an hourly wage of $21.67.25 Multiply these numbers, and the opportunity cost to an individual caregiver is estimated at over $100,000. While family members may consider this cost the lesser of two evils compared to paying for a private nursing home, it is costlier to individuals than using Medicare or Medicaid dollars to pay for institutional care. Furthermore, one in four primary caregivers reports that caregiving negatively impacts their health; this rate is even higher among lower-income caregivers.26 This suggests that some caregivers of elderly and/or disabled homeowners might avoid negative health outcomes if their family members transitioned into institutional care.
Despite the potential drawbacks of aging in place, all people, regardless of income or ability, should have the opportunity to choose between remaining in their homes or transitioning into institutional care. Unfortunately, U.S. housing markets do not often give low-income elderly and disabled homeowners this choice, and many must turn to public sector programs.
Programs to Assist Senior Homeowners
A variety of programs exist to address the financial and physical issues facing senior homeowners, including homeowner education and counseling, property tax payment assistance, intergenerational home sharing, and repair grants and loans.
While homeownership education is typically associated with first-time homebuyers, there are several programs geared toward long-time homeowners, like the National Council on Aging’s “Your Home as A Strategic Asset” module, that cover topics like reverse equity mortgages, avoiding foreclosure, getting out of property tax debt, and intergenerational home transfer.27,28 In North Carolina, ten of the state’s 78 HUD-approved housing counseling agencies offer reverse mortgage counseling.29 Property tax assistance can take several forms, including property tax circuit-breakers and deferrals. In North Carolina, three property tax payment assistance programs exist. The Elderly or Disabled Property Tax Exclusion excludes the greater of the first $25,000 or 50% of the assessed value of eligible homeowners’ primary residences. The Circuit Breaker Tax Deferment Program limits annual property taxes to a percentage of eligible homeowners’ incomes. The Disabled Veteran Property Tax
21Ibid.
22 Reaves & Musumeci, 2015 23 Calmus, 2013
7 Exclusion Program excludes up to the first $45,000 of the appraised value of honorably discharged veteran homeowners’ primary residences.30
Intergenerational home sharing programs augment senior homeowners’ incomes with rent from college student boarders, who also benefit from rents that are lower than university housing costs. These arrangements may also reduce social isolation among seniors, either by design or
happenstance.31 One example of an intergenerational home sharing program is New York University’s pilot initiative for fall of 2017 that will match students seeking affordable rents with nearby seniors who are willing to lease a spare room.32 Currently, no formal home sharing programs exist in North Carolina.
The programs with perhaps the most potential to directly alleviate both physical and financial burdens are repair grants/loans, which address “bricks and mortar” problems that are both physically and financially impossible for many older homeowners to fix. In North Carolina, NCHFA runs the Urgent Repair Program (URP), which finances emergency home repairs and modifications for elderly and/or special needs homeowners with incomes below 50% of area median income (AMI).33 The program aims to address housing conditions that threaten life or safety and, but for the repairs or modifications, would force occupants to move out of their homes. NCHFA administers URP funds through local government and nonprofit partner agencies, who are responsible for
implementing the program. The partners advertise the program (often names other than “Urgent Repair Program”), receive applications from interested homeowners, determine applicant eligibility, and contract for and supervise the work. Once applicants are approved, they receive a loan of up to $8,000 to pay for the necessary repairs or modifications, which is deferred and forgiven at $1,000 per year.
30 OVMFinancial, Inc., 2015
31 Altus & Mathews, 2000 32 Smeltz, 2016
8
Evaluation Metrics and Methods
Program evaluations may be grouped broadly into three types: process evaluations, which assess the degree to which a program is implemented as intended; outcome evaluations, which assess the degree to which a program achieves its intended effects on a target population; and impact
evaluations, which assess a program’s overall effects and progress toward its ultimate goals.34 This evaluation assesses the outcome and impact dimensions of URP’s function (Fig. 3).35
FIGURE 3. Evaluation criteria used to assess URP’s outcomes and impacts.
Criteria Description
Outcomes Effectiveness How well does the program prevent displacement and improve quality of life of low-income elderly and/or disabled homeowners?
Spatial Equity How does the spatial distribution of program activity compare to the distribution of need?
Impact Cost Efficiency How do the program’s costs compare to its benefits?
Adapted from the National Collaborating Centre for Healthy Public Policy, 2012
Effectiveness (how well URP improves homeowners’ quality of life and prevents displacement from their homes) and spatial equity (how well program activity is distributed to meet the need) were examined to evaluate the program’s outcomes. Cost efficiency was analyzed to measure URP’s economic and fiscal impacts. The methods used to evaluate these metrics are described below.
Effectiveness
The purpose of URP is to address housing conditions that pose an imminent threat—to life, to safety, or of displacement—to elderly and/or disabled owner households by funding home repairs or
accessibility modifications. The degree to which the program achieves this purpose, or its
effectiveness, can be assessed by determining how well URP removes those threats. While NCHFA tracks URP projects in its database, the numbers reported (such as number of units repaired) are outputs, and do not necessarily translate directly into outcomes about housing condition
improvement and displacement prevention.
To gain insight into these outcomes, a survey was developed and distributed to a random sample of 300 households who participated in URP between 2005 and 2015 (Appendix A).36 The survey includes questions on demographics (gender, age, race/ethnicity, and disability status) and health insurance information; the effects of receiving URP repairs on participants’ and their loved ones’ daily lives; satisfaction with the program’s processes and outcomes (rated on a five-point Likert scale); and information on participants’ counties of residence and length of tenure in their homes.
34 CDC, n.d.
35 National Collaborating Centre for Healthy Public Policy, 2012
36 Originally, the sample contained 200 URP participants; however, after two mailings of the survey yielded less than 30
9 The 2005 to 2015 timeframe was selected to include some historical data, while recognizing that because most participating homeowners are elderly, many of those who received repairs more than ten years ago may have passed away. Cover letters and self-addressed prepaid envelopes for returning completed surveys were sent out with each survey (Appendix B), and contacts at local partner agencies were notified by email of NCHFA’s outreach to homeowners for program evaluation purposes (Appendix C).
To measure effectiveness, quantitative data on participant satisfaction with the program were analyzed using descriptive statistics. Open-ended, written comments from survey responses were thematically coded using the qualitative data analysis software ATLAS.ti. Because participants’ responses did not always correlate most closely with the survey questions to which they were responding, all written comments from a given participant were grouped as one unit (rather than broken out by question), and each participant’s aggregated comments were analyzed to parse out themes.
Spatial Equity
Spatial equity, or how a program affects people differently across geographies, is increasingly used to evaluate programs and interventions through the use of geographic information systems (GIS) analysis.37 For instance, the Piedmont Triad Regional Council of Governments in North Carolina has mapped income and housing stock data to identify neighborhoods for targeted marketing of a local single-family home rehabilitation program.38 Spatial analysis can also reveal whether programs funded at the state (or higher) government level are effective across implementing localities.39 In this study, NCHFA’s geographic data on URP participants from 2005 to 2015 (i.e., the counties in which each repaired unit was located) were compared to public data from the American Community Survey40 to analyze the degree to which actual URP activity aligned with theoretical targeting based on the spatial distribution of relevant demographic categories. Since URP eligibility is based on income, age and/or disability, and homeownership, these were the four demographic characteristics used to develop geographic targeting maps.
To be eligible for URP, households must be owner-occupied and earn less than 50% of the area median income (AMI) of the county in which they reside, as defined by the U.S. Department of Housing and Urban Development (HUD). Data on the number of owner-occupied households in each county earning less than 50% of AMI from HUD’s Comprehensive Housing Affordability Strategy (CHAS) were used to identify counties that could be targeted for outreach and marketing of URP based on these criteria.41 URP eligibility criteria also require that households contain a member with special needs (i.e., age 62 or older, handicapped or disabled, a single parent, a child with elevated blood levels of lead, or large households of five or more). Because URP funds are most often used to assist elderly and/or disabled individuals, county-level data on the number of elderly and disabled residents were used to simplify targeting based on special needs criteria.42,43
37 Dalton et al., 2013; Clark & Maantay, 2006; Miranda et al., 2002 38 Malinda Ford, workshop presentation, 2016, November 4. 39 Koschinsky, 2013
40 U.S. Census Bureau, 2016 41 HUD, 2016
42 U.S. Census Bureau, 2010, Decennial Census; U.S. Census Bureau, 2010, ACS
43 Data on the total population and the population over age 65 in each county came from the 2010 Decennial Census,
10 Target counties were defined as those with (1) a greater proportion of owner-occupied households earning under 50% AMI than the median proportion for the state, (2) a greater proportion of owner-occupied householders over age 65 than the state median, or (3) a greater proportion of residents with disabilities than the state median.44 Target counties were then ranked by the number of qualifying conditions they had, with highest priority counties being those meeting all three targeting conditions. ArcMap 10 was used to visualize the concentration of URP-funded units (from 2005 to 2015) within counties overlaid on the target county map in order to assess the degree to which URP activity matched up with geographic targeting based on demographics.
Cost Efficiency
Cost efficiency can be assessed through cost-benefit analysis, or comparison of a program’s total costs with its benefits in quantifiable and monetized terms. In this study, costs and benefits were assessed using published data on cost of care and life expectancy, as well as information from survey responses from URP participants. Data from Genworth on the costs of long-term care, including home/community-based care (homemaker services, home health aides, and adult day health care) and institutional care (assisted living facilities and nursing homes), in different regions of the state were used to estimate potential public long-term care expenditures for URP
participants.45 Based on the counties of residence and health insurance type (e.g., Medicare, Medicaid, both) reported by survey respondents, long-term home and institutional care costs, and coverage of those costs by public health insurance systems, were estimated for each respondent. To estimate the length of care required, respondents’ self-reported ages were compared to life
expectancy data for their county, adjusted for sex and race (Appendix D).46
Estimated Medicare/Medicaid costs of care from the survey sample were derived by multiplying the average per-person cost over an individual’s projected lifetime (which was estimated by averaging the remaining life expectancies of sampled participants) by the number of homeowners who participated in URP between 2005 and 2015. This cost estimate was compared against NCHFA’s spending on URP over the same period to determine the program’s cost savings to
Medicare/Medicaid. Details about the assumptions and calculations underlying the cost-benefit analysis are described in Appendix D.
complete information for all counties. Data on the population with disabilities came from 2010 3-Year ACS Estimates, due to a lack of data in more recent ACS datasets and the 2010 Decennial Census.
44 Age 65 was used rather than 62 (as specified in URP eligibility requirements) due to the way age data are aggregated in
the ACS (i.e., age categories are broken down 55 to 64; 65 to 74; 75 to 84; etc.)
11
Findings
Effectiveness
Of the 300 surveys distributed, 80 (26.7%) were returned as undeliverable—many because the recipient was deceased, and some for other reasons, such as no mail receptacle was available outside the home. Adding an additional 100 participants to the original sample of 200, and looking up the added individuals prior to mailing the surveys (to correct changed addresses and replace individuals who were known to be deceased), improved the response rate of the third mailing. Ultimately, however, only 54 surveys (24.6% of those delivered) were returned with responses. Demographically, respondents were somewhat representative of the whole sample (Table 1). In both cases, black females made up the majority of the group, followed by white females, black males, and white males; however, the proportions of each age/sex group differed somewhat between the respondents and the sample. Also, a higher percentage of respondents indicated having a disability than the sample as a whole would suggest. However, no common definition of disability was used, which may explain some of this discrepancy.
TABLE 1. Demographics of survey sample (N = 300) and respondents (N = 54).
Sample Respondents Black Females 40.8% 42.6% White Females 31.1% 37.0% Black Males 12.0% 5.6% White Males 11.4% 7.4% Females of Other Race 1.0% 3.7% Males of Other Race 0.7% 0.0% Race and Gender Unknown 0.0% 3.7% Physically Disabled 56.7% 64.2% Average Age (no data) 71.5
Survey responses suggest that URP has been successful in keeping many participants in their homes. All but one respondent indicated that they still live in the homes that had received URP repairs, and respondents’ average length of tenure in those homes was just under 30 years, which speaks to the program’s value in preserving family assets. However, while many responses
discussed various quality of life improvements resulting from URP repairs, none directly stated that URP prevented individuals from leaving their homes and entering institutional care.
12 appropriate, reclassified under existing categories. Nine ”Other” comments could be classified under existing categories (three under “Finances”, three under “Stress”, one under “Comfort”, one under “Mobility – Within home”, and one under “Mobility – In/out of home”). Three comments could be classified under existing categories, but they reinforced comments the respondents had already listed under those categories (one under “Health” and two under “Mobility – In/out of home”); to avoid duplication, these were not reclassified. Eight comments were left in the “Other” category: five described repairs performed without discussing their impacts, and three described negative experiences with URP.
TABLE 2. Participant satisfaction ratings, where 1 = Highly Dissatisfied, 2 = Somewhat
Dissatisfied, 3 = Somewhat Satisfied, and 4 = Highly Satisfied (N = total count for each column).
Program
Outreach Application Process
Relationship with Local Administrator
Repair
Quality Promptness Approval Promptness Repair Average 3.53 3.56 3.53 3.39 3.38 3.48 Median 4 4 4 4 4 4 Response
Counts
1 (2.1%) 1 (4.0%) 2 (4.1%) 2 (7.8%) 4 (6.0%) 3 (3.8%) 2 2 (6.4%) 3 (6.0%) 3 (4.1%) 2 (7.8%) 4 (6.0%) 3 (9.6%) 5 3 (27.7%) 13 (20.0%) 10 (26.5%) 13 (19.6%) 10 (32.0%) 16 (19.2%) 10 4 (63.8%) 30 (70.0%) 35 (65.3%) 32 (64.7%) 33 (56.0%) 28 (67.3%) 35 Total
Count 47 50 49 51 50 52
TABLE 3. Areas of impact on homeowners’ and loved ones’ lives from URP repairs (N = 54).
Mobility Health Safety Comfort Finances Stress Other
Within
home of home In/out Self-Reported
Count (13.2%) 7 (22.6%) 12 (26.4%) 14 (24.5%) 13 (30.2%) 16 (15.1%) 8 (11.3%) 6 (32.1%) 17
Additional Inferred from “Other” Category
Count 1 1 1 3 3 Total
13 Participants’ written responses described three primary areas of their lives that were positively impacted by URP repairs: (1) physical health, safety, and comfort; (2) financial security, and (3) mental health. Thirty-four of the 49 written
responses described benefits of URP related to their households’ physical health (e.g., patching roof leaks), safety (e.g., fixing faulty wiring), or comfort (e.g., making front steps easier to climb for people with knee problems).
Sixteen responses described benefits related to financial security, such as having more money to spend on food, reducing their utility bills through window replacement, and protecting their physical assets by leak-proofing the house. Seven responses described benefits related to stress reduction. Two of these responses convey general peace of mind from having repairs addressed, two describe reduced anxiety surrounding financial and asset protection
matters, and three describe reduced fear concerning physical safety in the home.
Not all survey respondents were satisfied with URP, however. Thirteen participants reported being somewhat or highly dissatisfied with one or more of the six metrics on the Likert scale. Written comments detailing their experiences described dissatisfaction with the process of applying for and receiving assistance through the program and/or the quality of repairs. Some participants reported receiving repairs that did not sufficiently address the intended problems, or even exacerbated them, including failing to caulk around a newly installed window (forcing the homeowner to cover the window in plastic to keep out the cold), faulty repair of a heating unit resulting in high energy bills, and installing a new toilet incorrectly, resulting in water and mold damage to carpet and sheetrock. One participant even reported having to leave her mobile home and move in with a relative due to damage from poorly executed repairs. Another reported a fire resulting from faulty electrical work. One respondent suggested that homeowners should be involved in selecting contractors “that we know would do a great job” and who would have greater accountability. Frustration with
accountability was echoed by another respondent, who was unable to contact the HVAC technician who installed a new unit as part URP-funded repairs; when that unit malfunctioned, she had to hire someone else to fix it, at a very high price. Inconsistency in contractor quality was also echoed by another respondent, who had two separate contractors working on her home—one of which, she had a very negative experience with, and the other, a very positive one.
Some responses also expressed frustration with the process leading up to actual repairs, including year-long waitlists and non-responsive administrative staff and contractors. One participant wrote, “My heating unit went out last December. I applied for help. I haven’t heard anything yet. I went the whole winter with no heat on the first floor.” The comment went on to express understanding of program administrators’ limited capacity, but suggested that administrators should better communicate expected wait times to applicants.
“Peace of mind knowing [my] home
will not be destroyed. My only child,
knowing he will always have a home.”
“My knee has gotten worse and
[without the repairs] I would really be
having difficulties getting in and out of
the house.”
14 It is worth noting that most participants who reported negative experiences still expressed
appreciation for being part of the program. One participant wrote, “It took a little time, but I am very pleased with what the guys have done in order for me to get in and out of my house a lot easier.” Another was happy with the roof repairs she received, but disappointed that the local program administrators ran out of funds before they could fix her floors as well.
Consistent with written feedback from respondents, the “Repair Quality” metric on the Likert scale had the highest count of dissatisfied ratings (Table 2). Similarly, the two “Promptness” metrics had the second-highest counts of dissatisfied ratings. Of the 11 respondents who described
dissatisfaction in written comments, four reported dissatisfaction with only one aspect of their experience on the Likert scale (repair quality for two individuals, repair promptness for one, and program advertisement for another). Three were dissatisfied with two metrics (repair quality and repair promptness), another with three metrics (repair quality, approval promptness, and repair promptness), and two with all (or all but one) metrics.
Equity
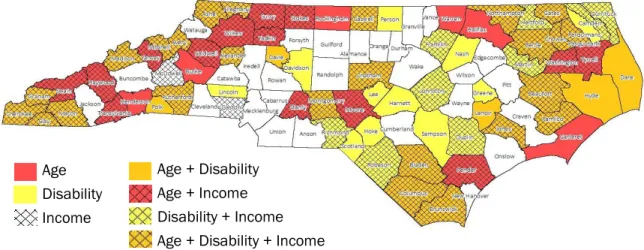
Spatial analysis revealed 25 counties that could be considered high targeting priorities for URP outreach based on their demographics. Figure 4 shows counties with median values above those of the state on three indicators: homeowners earning less than 50% of AMI, homeowners age 65 and older, and persons with disabilities, as well as combinations of these three criteria. The 25 counties with high proportions of all three criteria are primarily in the far western part of the state (Alexander, Alleghany, Ashe, Avery, Cherokee, Clay, Graham, Macon, Madison, Mitchell, and Rutherford) and the eastern part (Beaufort, Bertie, Bladen, Brunswick, Chowan, Columbus, Gates, Jones, Northampton, Pamlico, and Perquimans), with a few scattered in between (Caswell, Chatham, and Montgomery).
FIGURE 4. Counties with high need for URP projects based on age, disability, and income.
The spatial distribution of demographics indicating need for URP projects was overlaid with actual URP investment data from 2005 to 2015 (Fig. 5). The dark circles in Figure 5 represent the number of URP projects in each county during that timeframe, normalized by the county’s population; for example, Wake County had 236 URP projects and an estimated population of 900,993, so the county had 0.00026 projects per capita. These proportions were grouped into four categories—low, medium/low, medium/high, and high—based on the distribution of the data.
Age Disability Income
15 FIGURE 5. County URP need overlaid with actual URP projects per capita, 2005 - 2015.
Nineteen (76%) of the 25 high-priority counties identified in the targeting spatial analysis have had high or medium/high URP investment since 2005, indicating that the program is meeting much of spatially-concentrated need highlighted by demographic data. Six high-priority counties had low or medium/low scores: Ashe (which had the only low score), Alleghany, Beaufort, Bladen, Chatham, and Jones (all of which scored medium/low). These six counties could be prime places to increase marketing of URP (Fig. 6).
FIGURE 6. Potential counties in which to increase URP marketing and outreach.
Cost Efficiency
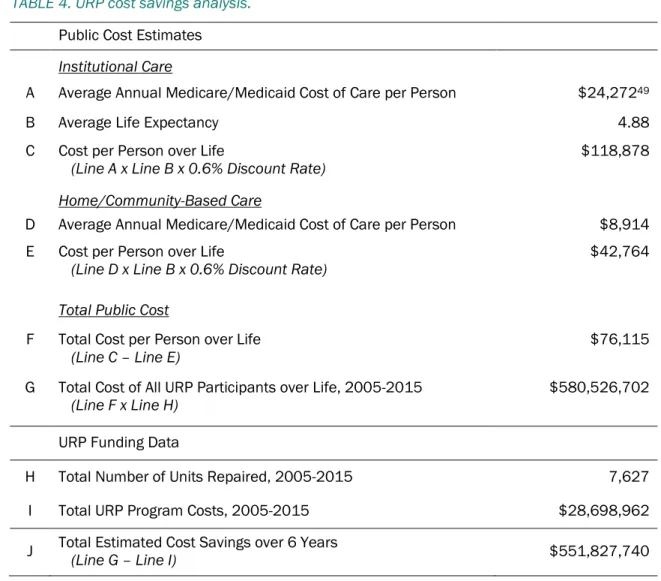
Between 2005 and 2015, URP provided an estimated cost savings of about $550 million to the public health care system (Table 4). This cost savings was calculated by totaling program
expenditures, or cost, during that period ($28,698,962) compared to avoided public costs, or benefit ($580,526,702). Subtracting cost from benefit yields a savings of $551,827,740 (Table 4).
Public cost savings was calculated by estimating Medicare/Medicaid expenditures on long-term institutional care for each URP participant ($118,878) and subtracting the corresponding public cost per person of long-term home/community-based care, which may be needed to replace institutional care ($42,764), yielding a total cost of $76,115 per person (Table 4). Per-person costs of long-term institutional and home care were derived by discounting the average annual Medicare/Medicaid
Low (0.0001 – 0.0004)
Medium/Low (0.0004 – 0.0008) Medium/High (0.0008 – 0.0012) High (0.0012 – 0.0169)
16 expenditures per person ($24,272 for institutional care and $8,914 for home care) by 0.6% (per federal guidelines) over 4.68 years, the average life expectancy of URP participants (Appendix D).47,48
TABLE 4. URP cost savings analysis.
Public Cost Estimates
Institutional Care
A Average Annual Medicare/Medicaid Cost of Care per Person $24,27249
B Average Life Expectancy 4.88 C Cost per Person over Life
(Line A x Line B x 0.6% Discount Rate) $118,878
Home/Community-Based Care
D Average Annual Medicare/Medicaid Cost of Care per Person $8,914 E Cost per Person over Life
(Line D x Line B x 0.6% Discount Rate) $42,764
Total Public Cost
F Total Cost per Person over Life
(Line C – Line E) $76,115
G Total Cost of All URP Participants over Life, 2005-2015
(Line F x Line H) $580,526,702
URP Funding Data
H Total Number of Units Repaired, 2005-2015 7,627 I Total URP Program Costs, 2005-2015 $28,698,962 J Total Estimated Cost Savings over 6 Years (Line G – Line I) $551,827,740
It is important to note the limitations of the above methodology. While this analysis captures the trade-off of keeping elderly and/or disabled homeowners in their homes by estimating
Medicaid/Medicare coverage of professional home care to replace institutional care, it does not capture private costs to URP participants. The average annual private cost of home care among survey respondents is $23,485, which would total $114,663 over their average 4.88-year life expectancy. If friends or family provided home care informally rather than paid professionals, the opportunity cost to those caregivers over the same period would be about $49,000.50
47 The averaged difference between survey respondents’ age and the life expectancy for their county of residence, adjusted
by sex and race (IHME, 2010).
48 OMB, 2016
49 This number is higher during the first year of care ($26,730), as Medicaid contributes to the payment of institutional care
costs for the first 100 days of care.
50 This number was derived by: (1) estimating the average income of URP participants’ caregivers (50% of the average
17
Discussion & Recommendations
Effectiveness
The survey about URP’s impacts on participants’ lives did not explicitly ask whether the program prevented individuals from leaving their homes and entering institutional care, making it difficult to confirm whether URP has achieved that outcome goal. This explicit question was considered too leading and was avoided. Unfortunately, however, this leaves us unable to conclusively determine URP’s effectiveness at preventing homeowner displacement.
While this study did not definitively capture how effectively URP achieved its ultimate outcome goal of keeping elderly and/or disabled homeowners out of institutional care, survey responses indicate that URP has largely been effective at mitigating threats to life and safety caused by poor housing conditions. Furthermore, several respondents reported secondary quality of life benefits, including alleviating financial burdens of home maintenance and reducing associated stress. However, 25% of survey responses indicated dissatisfaction with one or more aspects of the program—particularly repair quality and promptness of completion. The variation among participants’ experiences with the program that was reflected in their written feedback, as well as the variation within the experiences of some participants (such as the individual who reported satisfaction with one contractor and dissatisfaction with another), suggests that URP could benefit from including more detailed guidelines for managing contractors’ responsibilities and homeowners’ expectations.
However, program policies are already very thorough, requiring work write-ups for every project and preconstruction conferences with the local program administrator, homeowner, and contractor to discuss the proposed repairs/modifications. The administrator’s manual also requires that a signed record of the conference be maintained by administrators, and suggest that work write-ups and accompanying notes detailing cost estimates be maintained as well.51
One area that could be enhanced is monitoring by local program administrators. Currently,
administrators must monitor and approve the performance of contractors to ensure compliance with work specifications, licensing and insurance requirements, and schedules.52 Including in this
guideline a specific timeframe for monitoring, and one that is long enough to ensure program administrators catch problems with repairs or installations (e.g., check-ins at three and six months after repair completion), could improve quality control of contractor work, and perhaps prevent some of the negative experiences described by survey respondents. For even greater oversight, URP policy could require contractors to provide one-year warranties, or have local administrator maintain a system for rating contractors in which those who perform substandard work are penalized in future bids. To help ensure clear communication between administrators and homeowners, program assistance procedures could require that administrators provide applicants with a reasonable estimate of the timeframe between application approval, repair commencement, and repair completion.
the wage by 20.4 hours, which is the average amount of weekly informal care (The SCAN Foundation, 2012) and by 52 weeks to get an annual wage; then (4) multiplying the annual wage by the average life expectancy of survey respondents (4.88 years). The derived opportunity cost is $49,097.
18
Spatial Equity
GIS analysis revealed that URP is currently highly active in most of the counties (76%) with the greatest concentration of eligible households. However, six counties (Alleghany, Ashe, Beaufort, Bladen, Chatham, and Jones) have a high concentration of need but below-average investment, and could benefit from increased marketing of the program to potential partner organizations by NCHFA, and increased outreach by those partners to eligible households.
Three of these counties (Chatham, Bladen, and Jones) are currently served by a local program administrator.53 In both Chatham and Bladen counties, the local partner organization covers a large geographic area with significant population density and relies on volunteer labor to complete repairs.54 As such, these organizations have limited capacity, which may explain the potential gap in services in the counties. In Jones County, the most recent URP projects were completed in 2005 by Coastal Community Action, a community action agency (CAA) in Newport, North Carolina. In recent years, the organization appears to have concentrated efforts in Carteret, Duplin, and Onslow
counties, and may no longer serve Jones.55 Likewise, the remaining three counties (Ashe, Alleghany, and Beaufort) do not currently have any local partner agencies administrating URP.56
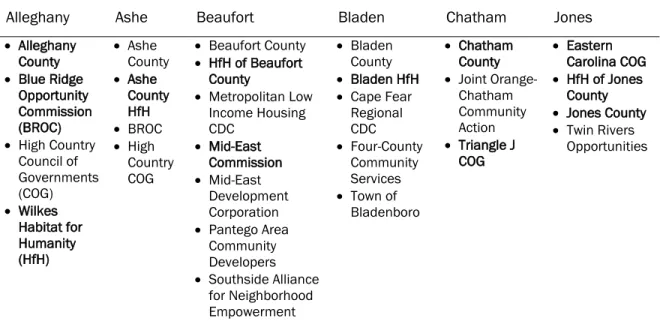
Unfortunately, lack of institutional capacity among local program administrators severely limits the practicality of those organizations increasing their outreach to eligible households, as they likely cannot handle a greater work load. However, NCHFA could reach out to other organizations in the six target counties—both those that have historically received URP funding and potential new partners— to gauge interest in reactivating or initiating partnerships (Table 5).
TABLE 5. Potential URP partner organizations in target counties (light text indicates organizations that have participated in URP in the past, and bold text indicates those that have not).
Alleghany Ashe Beaufort Bladen Chatham Jones
Alleghany
County
Blue Ridge
Opportunity Commission (BROC)
High Country
Council of Governments (COG) Wilkes Habitat for Humanity (HfH) Ashe County Ashe County HfH BROC High Country COG
Beaufort County
HfH of Beaufort
County
Metropolitan Low
Income Housing CDC Mid-East Commission Mid-East Development Corporation
Pantego Area
Community Developers
Southside Alliance
for Neighborhood Empowerment
Bladen
County
Bladen HfH
Cape Fear
Regional CDC
Four-County
Community Services
Town of
Bladenboro
Chatham
County
Joint
Orange-Chatham Community Action
Triangle J
COG
Eastern
Carolina COG
HfH of Jones
County
Jones County
Twin Rivers
Opportunities
53 NCHFA, 2017, Current Community Partners
54 Rebuilding Together of the Triangle, 2017; Wilmington Area Rebuilding Ministry, Inc., 2017 55 Coastal Community Action, Inc., 2017
19
Cost Efficiency
Assuming URP does, in fact, prevent recipients from entering institutional care, the program provides huge potential savings to the Medicaid and Medicare programs—every $1 of URP funding could save up to $44 of public health insurance.
If the State is interested leveraging URP funds even further, incorporating a local match requirement into the program could be a good strategy. For example, the Tennessee Housing Development Agency’s Emergency Repair Program requires a 50% match, which may be provided by the
homeowner, local groups or agencies, donated labor or materials, federal funds, or a funding pool from local lenders to the Development District.57 However, considering the low financial capacity of URP participants, and of many of the small local government and nonprofit partners that administer the funding, such a requirement would likely diminish the program’s use.
While the evidence of URP’s fiscal cost efficiency is compelling, the program’s economic impacts on the unpaid caregivers of low-income elderly and/or disabled homeowners is unclear. Although many participants indicated in their survey responses that the program alleviated financial burdens from their households, it is possible that by diverting homeowners from entering institutional care, URP increases the real and opportunity costs to their informal caregivers. Because so much of long-term care is provided by uncompensated family members, particularly in low-income families, extending the duration of informal home care rather than utilizing public health insurance coverage of institutional care may be the costlier option for some families.58
Though perhaps outside the scope of this program, NCHFA could consider ways of partnering with the Department of Health and Human Services (DHHS) to enhance the provision of public
home/community-based long-term care services, and lower the real and opportunity costs of aging in place to low-income individuals and families. The State currently offers two Medicaid waiver
programs that facilitate provision of home and community-based services to adults. The NC
Innovations Waiver helps individuals with intellectual or developmental disabilities receive services outside of institutional settings and live more independently.59 The Community Alternatives Program for Disabled Adults helps individuals access services and supports to meet their medical,
psychosocial, and functional needs that are beyond those they can attain through other formal or informal caregivers.60 Coordinating with DHHS to link URP participants and other eligible households with these programs could be a valuable long-term investment in the future of community-based living and care in North Carolina.
20
Conclusion
NCHFA’s Urgent Repair Program finances home repairs and modification for low-income households with special needs, so that families can continue living safely in their homes. URP aims to improve quality of life and choice for individuals who might otherwise be forced to endure substandard, unsafe housing conditions or enter institutional care settings.
This evaluation assesses the program’s outcomes and impact in three areas. The first area, effectiveness, examined how well URP prevents displacement and improve quality of life of participants through analysis of participant surveys. Spatial equity, or how the geographic distribution of URP investment compares to the distribution of need, was analyzed and mapped using GIS. Finally, URP’s fiscal cost efficiency, or how the program’s public costs compare to its public benefits, was determined through cost/benefit analysis.
Findings reveal that URP has largely succeeded at improving participants’ quality of life, addressing spatially concentrated need, and creating savings for the public health insurance system:
Overall satisfaction with URP among surveyed participants was 90.7%
URP is currently highly active in 76% of the counties with the greatest concentration of eligible households
Every $1 of URP funding could save up to $19 of Medicaid/Medicare spending Of course, potential for program improvement still exists. Incorporating some of the following recommendations may further improve URP’s performance in the three areas evaluated:
Effectiveness
Specify in the administrators’ manual a timeframe for monitoring repair work to ensure program administrators can catch and address issues with repairs or installations. Require contractors to provide one-year warranties and/or require local program
administrators to maintain a system for rating contractors based on performance. Require administrators to provide applicants with a reasonable estimate of the
timeframe between application approval, repair commencement, and repair completion. Spatial Equity
Reach out to historic partner organizations to gauge interest in reactivating local administration of URP and increase investment in underserved, high-need counties (Alleghany, Ashe, Beaufort, Bladen, Chatham, and Jones).
Reach out to potential new partner organizations in those six counties, such as county governments, Regional Councils of Government, and Habitat for Humanity affiliates. Cost Efficiency
Incorporate a local match requirement, which may be provided by the homeowner, donations or nonprofit organizations, or federal or local funds. However, this requirement would likely diminish the program’s use, which could cause a net decrease in cost efficiency.
21
References
AARP. (2009, June). Providing more long-term support and services at home: Why it’s critical for health reform. Washington, DC: AARP Public Policy Institute. Retrieved from
http://assets.aarp.org/rgcenter/health/fs_hcbs_hcr.pdf.
Altus, D. E. & Mathews, M. (2000). Examining satisfaction of older home owners with intergenerational homesharing. Journal of Clinical Geropsychology, 6(2): 139-147.
Arias, E. (2015, September 22). United States Life Tables, 2011. National Vital Statistics Reports, 64(11). Centers for Disease Control and Prevention. Retrieved from
https://www.cdc.gov/nchs/data/nvsr/nvsr64/nvsr64_11.pdf.
Badger, E. (2014, September 2). America is rapidly aging in a country built for the young. The Washington Post. Retrieved from
https://www.washingtonpost.com/news/wonk/wp/2014/09/02/america-is-rapidly-aging-in-a-country-built-for-the-young/.
Brandon, E. (2012, May 21). Poverty increasing among retirees: The gap between the wealthiest and the poorest retirees is growing. U.S. News & World Report. Retrieved from
http://money.usnews.com/money/retirement/articles/2012/05/21/poverty-increasing-among-retirees.
Calmus, D. R. (2013, February 6). The long-term care financing crisis. Washington, DC: Heritage Foundation Center for Policy Innovation. Retrieved from
http://s3.amazonaws.com/thf_media/2013/pdf/CPI_DP_07.pdf.
Center for Community Progress. (2016). Preventing involuntary displacement of the neighborhood's lower-income residents. Page in the Building Stronger Neighborhoods Toolkit. Retrieved from
http://www.communityprogress.net/preventing-involuntary-displacement-of-the-neighborhood-s-lower-income-residents-pages-243.php.
Centers for Disease Control and Prevention [CDC]. (n.d.). Types of evaluation. National Center for HIV/AIDS, Viral Hepatitis, STD, and TB Prevention. Retrieved from
https://www.cdc.gov/std/Program/pupestd/Types%20of%20Evaluation.pdf.
Clark, M. J. & Maantay, J. A. (2006). Optimizing recycling in all of New York City's neighborhoods: Using GIS to develop the REAP index for improved recycling education, awareness, and participation. Resources, Conservation and Recycling, 46(2): 128-148.
Coastal Community Action, Inc. (2017). Urgent Repair. Retrieved from
http://www.coastalca.org/index.cfm?fuseaction=dep_intro&dept_id=10&cat_id=2.
Dalton, A. M., Jones, A., Ogilvie, D., Petticrew, M., White, M., & Cummins, S. (2013). Using spatial equity analysis in the process evaluation of environmental interventions to tackle obesity: the healthy towns programme in England. International Journal for Equity in Health, 12: 43. Dickey, E. (2017). Medicaid for North Carolina residents needing assisted living or home health care.
Retrieved from
http://www.nolo.com/legal-encyclopedia/medicaid-north-carolina-residents-needing-assisted-living-home-health-care.html.
Freyer, A. (2016, August 2). Homecare workers in every North Carolina county earn too little to make ends meet. NC Policy Watch Progressive Pulse [blog]. Retrieved from
http://pulse.ncpolicywatch.org/2016/08/02/81706/.
Genworth. (2016). Compare long term care costs across the United States [annual data for North Carolina]. Retrieved from https://www.genworth.com/about-us/industry-expertise/cost-of-care.html.
Howden-Chapman, P. L., Chandola, T., Stafford, M., & Marmot, M. (2011). The effect of housing on the mental health of older people: The impact of lifetime housing history in Whitehall II. BioMed Central Public Health, 11: 682.
Institute for Health Metrics and Evaluation [IHME]. (2010). Life expectancy, obesity, and physical activity [county-level data for North Carolina]. Retrieved from
22 Joint Center for Housing Studies. (2014). Housing America’s older adults: Meeting the needs of an
aging population. Cambridge, MA: Joint Center for Housing Studies of Harvard University. Retrieved from
http://www.jchs.harvard.edu/sites/jchs.harvard.edu/files/jchs-housing_americas_older_adults_2014.pdf.
Kenyon, D. A. & Langley, A. H. (2010, April). Property tax relief: The case for circuit breakers. Lincoln Institute of Land Policy. Retrieved from
http://www.lincolninst.edu/publications/articles/property-tax-relief.
Koschinsky, J. (2013). The case for spatial analysis in evaluation to reduce health inequities. Evaluation and Program Planning, 36(1): 172-176.
Lejeune, Z., Xhignesse, G., Kryvobokov, M., & Teller, J. (2016). Housing quality as environmental inequality: The case of Wallonia, Belgium. Journal of Housing and the Built Environment, 31: 495-512.
Matula, T. (2009). Older adults in North Carolina: An overview. NC Study Commission on Aging. Retrieved from
http://www.ncleg.net/documentsites/committees/NCSCA/2009-10%20Interim%20Commission%20Meetings/1-7-10/Aging%20101.pdf.
Miranda, M. L., Dolinoy, D. C., & Overstreet, M. A. (2002). Mapping for prevention: GIS models for directing childhood lead poisoning prevention programs. Environmental Health Perspectives, 110(9): 947–953.
National Collaborating Centre for Healthy Public Policy. (2012, September). A framework for
analyzing public policies: Practical guide. Briefing Note: For up-to-date knowledge relating to healthy public policy. Québec, Canada: Institut National de Santé Publique.
National Council on Aging. (2015, June 3). NCOA and Wells Fargo Housing Foundation help seniors navigate housing options. NCOA website. Retrieved from
https://www.ncoa.org/news/press-releases/ncoa-wells-fargo-housing-ed/.
North Carolina Department of Health and Human Services [NC DHHS]. (2017). Community Alternatives Program for Disabled Adults (CAPD/DA). NC DHHS website. Retrieved from
https://dma.ncdhhs.gov/providers/programs-services/long-term-care/community-alternatives-program-for-disabled-adults.
North Carolina Department of Health and Human Services [NC DHHS]. (2017). NC Innovations Waiver. NC DHHS website. Retrieved from https://www2.ncdhhs.gov/ncinnovations/. North Carolina Department of Health and Human Services Division of Medical Assistance [NC DMA].
(2017). Nursing facility rates 2017 04 01 [Excel file]. Retrieved from
https://dma.ncdhhs.gov/nursing-facility-rates.
North Carolina Housing Finance Agency [NCHFA]. (2017). Current Community Partners. NCHFA website. Retrieved from
http://www.nchfa.com/homeownership-partners/community-partners/current-community-partners.
North Carolina Housing Finance Agency [NCHFA]. (2017). Urgent Repair Program. NCHFA website. Retrieved from
http://www.nchfa.com/current-homeowners/repairing-your-home/urgent-repair-program.
North Carolina Housing Finance Agency [NCHFA]. (2016, May). Urgent Repair Program (URP16) Administrator’s Manual. Retrieved from
http://www.nchfa.com/sites/default/files/page_attachments/URP16%20Admin%20Manual. pdf.
OVMFinancial, Inc. (2015, June 20). North Carolina Property Tax Relief for the Elderly & Disabled [blog post]. Retrieved from
http://teammovemortgage.com/2015/06/20/nc-property-tax-discounts-programs/.
Reaves, E. L. & Musumeci, M. (2015, December 15). Medicaid and long-term services and supports: A primer. The Henry J. Kaiser Family Foundation. Retrieved from
http://kff.org/medicaid/report/medicaid-and-long-term-services-and-supports-a-primer/.
Rebuilding Together of the Triangle. (2017). Rebuilding Together of the Triangle. Retrieved from
23 Reinhard, S. C., Kassner, E. Houser, A., Ujvari, K., Mollica, R., & Hendrickson, L. (2014). Raising
expectations: A state scorecard on long-term services and supports for older adults, people with disabilities, and family caregivers. Prepared for AARP, The Commonwealth Fund, and The SCAN Foundation. Retrieved from
http://www.aarp.org/content/dam/aarp/research/public_policy_institute/ltc/2014/raising-expectations-2014-AARP-ppi-ltc.pdf.
Segal, M., Rollins, E., Hodges, K., & Roozeboom, M. (2014). Medicare-Medicaid eligible beneficiaries and potentially avoidable hospitalizations. Medicare & Medicaid Research Review, 4(1). Retrieved from http://www.cms.gov/mmrr/Downloads/MMRR2014_004_01_b01.pdf. Smeltz, M. (2016, November 20). NYU plans to set students in need of housing up with senior
citizens. CBS New York. Retrieved from
http://newyork.cbslocal.com/2016/11/20/nyu-senior-citizens-housing/.
Tennessee Housing Development Agency. (2017). Emergency Repair Program. Retrieved from
https://thda.org/business-partners/emergency-repair.
The SCAN Foundation. (2012, October). Who provides long-term care in the U.S.? The SCAN Foundation. Retrieved from
http://www.thescanfoundation.org/sites/thescanfoundation.org/files/us_who_provides_ltc_
us_oct_2012_fs.pdf.
U.S. Census Bureau. (2009). 2005-2009 American Community Survey 5-Year Estimates. American FactFinder. U.S. Census Bureau. Retrieved from http://factfinder.census.gov/.
U.S. Census Bureau (2010). 2010 Decennial Census. American FactFinder. U.S. Census Bureau. Retrieved from http://factfinder.census.gov/.
U.S. Census Bureau. (2010). 2008-2010 American Community Survey 3-Year Estimates [ACS]. American FactFinder. U.S. Census Bureau. Retrieved from http://factfinder.census.gov/. U.S. Census Bureau. (2015). 2011-2015 American Community Survey 5-Year Estimates. American
FactFinder. U.S. Census Bureau. Retrieved from http://factfinder.census.gov/.
U.S. Centers for Medicare & Medicaid Services. (2017). Your Medicare coverage: Skilled nursing facility (SNF) care. Medicare.gov. Retrieved from
https://www.medicare.gov/coverage/skilled-nursing-facility-care.html.
U.S. Department of Housing and Urban Development [HUD]. (2016). ACS 5 Year CHAS Data by County as of 2012. HUD eGIS. Retrieved from
https://egis-hud.opendata.arcgis.com/datasets/3dd180c7b4a64b74b796db3d1686ff63_0/features/2 894.
Weber-Raley, L. & Smith, E. (2015). Caregiving in the U.S. Research conducted by Greenwald & Associates. National Alliance for Caregiving and the AARP Public Policy Institute. Retrieved from
http://www.caregiving.org/wp-content/uploads/2015/05/2015_CaregivingintheUS_Final-Report-June-4_WEB.pdf.
24
Appendix
26 Appendix B. Cover letter mailed with each survey distributed to URP homeowners.
Appendix C. Email template sent to local partner agency contacts.
27 Appendix D. Cost-benefit analysis assumptions and calculations.
Life Expectancy
County life expectancies for each sex were adjusted by race multipliers that were derived from national life expectancies by sex and race.61 For example, the national life expectancy for black females was 78.2, while the national life expectancy for all females was 80.8, so the black female multiplier was 0.968 (78.2 divided by 80.8); to calculate the life expectancy for black females in Alamance County, the life expectancy for all females in Alamance (80.2) would be multiplied by 0.986 to get 77.6.
Medicaid Coverage of Long-Term Care Costs
Medicaid covers the cost of up to 80 hours of home/community-based care per month, or 960 hours of care per year, so public coverage of home care for survey respondents who reported Medicaid as their primary health insurance (including those who receive both Medicaid and Medicare) was estimated by multiplying the annual Genworth Cost of Care estimate for home care by 960.62 Medicaid covers the cost of assisted living facilities up to $14,184 per year, so public coverage of that cost was assumed to be the lesser of $14,184 or the annual Genworth Cost of Care estimate.63 The cost of nursing home care may also be covered by Medicaid, when it is deemed medically necessary. Medicaid reimbursement rates for North Carolina nursing facilities for 2017 were aggregated by region, and public coverage of nursing home costs for survey respondents with Medicaid (including those with both Medicaid and Medicare) was assumed to be the annualized reimbursement rate in their county of residence.64
Medicare Coverage of Long-Term Care Costs
Medicare coverage of long-term care is limited to medically-necessary care. Of the types of long-term care included in the Genworth Cost of Care estimates, only nursing homes could typically qualify as medically necessary, and even then, only under certain conditions and for a limited time.65 Medicare covers the full cost of skilled nursing facilities for the first 20 days of care, and the cost of care minus a daily copay of $164.50 for days 21 through 100.66 As such, the public cost of long-term care for survey respondents who reported Medicare as their primary health insurance was assumed to be $0 for all types of care except nursing home care. Public coverage of nursing home care was estimated using the formula below, where G equals the annual Genworth Cost of Care estimate:
((G/365) x 20) + (((G/365) – 164.5) x 80)
Because of Medicare’s time-limited coverage of nursing home care, it was assumed that survey respondents with Medicare as their primary health insurance would not receive any public cost coverage for nursing home care after Year 1 (2017) of the 4.88-year life expectancy period over which total public expenditure was estimated.
61 IHME, 2010; Arias, 2015
62 Dickey, 2017 63Ibid.
64 NC DMA, 2017
28 Average Annual Costs of Care
The average annual cost of institutional care per person during the first year of care is a weighted average of the annual costs of two of the three different types of institutional care included in the Genworth study (i.e., assisted living facility and nursing home semi-private room). The “nursing home private room” category was omitted under the assumption that Medicaid and Medicare would likely require beneficiaries to stay in semi-private rather than private rooms for cost saving purposes. The average was weighted by the rates of assisted living facility and nursing home residence among North Carolinians over age 65. The NC DHHS Division of Aging and Adult Services reports that about 36.5 per 1,000 persons over 65 were in assisted living facilities in 2000 and 42.2 per 1,000 were in nursing homes.67 Thus, 46.4% of adults in either type of care were in assisted living facilities and 53.6% were in nursing homes. The following formula was used to obtain the average annual cost of institutional care per person, where A is the average annual cost of assisted living facility care per person and N is the average annual cost of nursing home care per person:
(A x 0.464) + (N x 0.536)
The average annual cost of institutional care per person reported in Table 4, Line A is the average cost after the first year of care (for Years 2 through 4.88). This figure is slightly lower than the average annual cost in Year 1, because Medicare costs were removed. Because of Medicare’s time-limited coverage of nursing home care, it was assumed that survey respondents with Medicare as their primary health insurance would not receive any public cost coverage after Year 1 (2017) of the 4.88-year period over which the total public expenditures over participants’ projected life
expectancies was estimated. To remove Medicare-dependent respondents from the sample, their public costs were summed and subtracted from the total sum of public costs for all respondents. The remaining number was divided by 54 (the sample size of survey respondents) to calculate an
average public cost of care for Years 2 through 4 (2017 to 2020). The cost of care in Year 4.88 (2021) was assumed to be 88% of the Year 2 average public cost.
The average annual cost of home care per person used in this analysis (Table 4, Line D) is a simple average of the annual costs of the three different types of home care included in the Genworth study (i.e., homemaker services, home health aides, and adult day health care).
Net Present Value of Public Costs over Life Expectancy
To remove Medicare-dependent respondents from the sample, their public costs were summed and subtracted from the total sum of public costs for all respondents. The remaining number was divided by 54 (the sample size of survey respondents) to calculate an average public cost of care for Years 2 through 4 (2017 to 2020). The cost of care in Year 4.88 (2021) was assumed to be 68% of the Year 2 average public cost.
The average annual cost of care estimates were discounted at 0.6% per year to yield a net present value of $118,878 for institutional care and $42,764 for home/community-based care.68
67 Matula, 2009