Chapter 2
Scientific Methods in Psychology
Science is a word derived from Latin roots: scientia
meaning “knowledge.”
- Scientific practice helps psychologists to know that they have obtained the most accurate and useful knowledge of mental processes and
Module 2.1
Thinking Critically and Evaluating Evidence
Psychology is a science. This chapter is about how we utilize scientific methods in evaluating claims and theories in psychology.
The Scientific Method
• Why do we need it?
– The scientific method provides guidelines for scientists in all fields, including psychology, to use in evaluating discrete claims (called
The Scientific Method
• Why do we need it?
– It is almost impossible to prove with utter certainty that any individual claim or theory is true beyond a doubt.
– The scientific method allows us to declare our
conclusions to be probable to the point where it is reasonable to treat them as factual.
Scientific Theories
• What is a theory?
– A theory is a comprehensive explanation of observable events and conditions.
– A good theory makes precise and consistent predictions while relying on a small number of underlying assumptions.
Scientific Theories
• The importance of falsifiability and parsimony – A theory that makes precise predictions is
falsifiable because it is easy to think of evidence that would confirm or contradict the theory.
– Reliance on the fewest and simplest possible assumptions is called parsimony, and is
considered an essential strength of good scientific theory.
Scientific Theories
• Example of a parsimonious and falsifiable scientific theory:
– Gravity is a force that pulls objects in the universe towards each other.
– According to the theory of gravity, larger and more massive objects pull smaller objects towards them.
The Scientific Method
• How do we support claims scientifically?
– Scientists want to know the evidence that will
support or disprove a claim.
– The scientific word for a claim is hypothesis.
– A hypothesis is a testable prediction of what will
The Scientific Method
• What’s the hypothesis?
– Claim: There is a relationship between televised violence and aggressive behavior.
The Scientific Method
• The importance of replication
– Testing of hypotheses must be repeated. – The standards in the scientific community
demand that researchers report their methods in enough detail so that any other scientist could feasibly repeat the study to confirm or contradict the validity of the findings.
– Replicable results are those that anyone can obtain, at least approximately, by following the same procedures.
The Scientific Method
• A good example of an interesting non-replicable
result in psychology is the much-ballyhooed “Mozart effect.”
– Based the results of a single study, researchers claimed that listening to classical music could improve cognitive functioning.
– Several other studies have failed to replicate the results of the original one.
The Scientific Method
• The method of meta-analysis
– Because we sometimes find predominance of small to medium effects in most studies of a particular
phenomenon (such as sex differences in aggressive behavior), we may compile the results of a large
number of studies and treat them for all intents and purposes as one very large research study.
– A meta-analysis also provides us with more information about the circumstances that will
increase or decrease the likelihood of the predicted effect occurring.
The Scientific Method
• Can you think of examples of evidence that would confirm or contradict this theory?
• Does the theory rely on assumptions other than the existence of the force itself and the effects of size on the workings of the force?
EASILY. It is falsifiable.
The Scientific Method
• An example of a claim that is NOT falsifiable:
– The telephone psychic says, “Next year, you will go through a big change.”
The Scientific Method
• An example of a claim that is NOT parsimonious: – The sun goes around the earth. Little gnomes
push it around the sky every day. We can’t see them because they are invisible to the human eye.
• This is not parsimonious because too many assumptions must be made in order for the claim to be accepted as fact.
NO
It is vague.
Concept Check
• Is this claim falsifiable?
– “You will encounter new challenges in your travels this week.”
YES
Concept Check
• “An oversupply of dopamine in the human central nervous system will eventually result in a decline in the number of receptors available for that
Concept Check
• “On March 19th, 2006, you will meet a 30-year-old millionaire who will offer you an exciting entry-level job in a growing high-tech company in Austin, TX.”
YES
Think – why do horoscopes never get this
specific?
Concept Check
• “Children whose parents divorce will eventually have serious emotional and relationship
problems.”
NOT AS SUCH
The terms “emotional problems” and
“relationship problems” must be
Concept Check
• “There are unseen powers at work in our lives that scientists will never be able to fully explain.”
NO
This is vague – what powers? How do they
work
?
Parsimony and Degrees of Open-mindedness
• You might ask
-– “Shouldn’t we remain open-minded to new possibilities?”
Scientific open-mindedness:
• It is the willingness to consider proper evidence. • It is NOT unquestioning acceptance of any
possibility in the absence of evidence. This is known as “gullibility.”
• In other words, your degree of open-mindedness should have some relationship to the quality of the evidence presented, including the degree of
What about anecdotal evidence?
• People often use personal accounts of isolated
events to bolster their beliefs in phenomena (such as ESP.)
• Because this sort of evidence is not systematically gathered, it is prone to “selective memory” (called confirmation bias) on the part of the reporter.
• We tend to remember when our hunches come true, and forget when they do not. We like to be right.
Research on ESP (“Extrasensory Perception”)
• Because of the problems described above, anecdotal evidence is not considered to be
acceptable as good evidence of the existence of ESP.
• Experiments done in controlled settings, such as
the ganzfeld procedure, along with careful
observation of some famous professional psychics, have shown results that were non-replicable, or
easily explainable by techniques of sleight of hand known well to experienced magicians.
Psychology as a Science
• Science does not deal with proof or certainty.
• The history of science is one of constant revision in the face of new and compelling evidence.
• Yet in psychology and all other sciences, we apply the rigorous and systematic methods of scientific study – hypothesis, methods, results, and
interpretation – to ensure that our claims are firmly grounded and our revisions reflect an improved
Module 2.2
General Principles of Research
• It is essential to your learning in psychology, and perhaps to your knowledge in general, to be able to evaluate the quality of the evidence presented in psychological research.
• What information do you need to know to be a good interpreter of psychological research?
General Principles of Research
• Definitions of Psychological Terms – The problems of measurement
• We need to measure the phenomena we are studying.
• Sometimes what we study in psychology is not tangible. It is not as if we are measuring weight or length of time.
General Principles of Research
• Definitions of Psychological Terms – The problems of measurements
• In order to accurately measure these concepts and phenomena, we develop behavioral or
observable definitions of them.
• We call these definitions operational definitions. • An operational definition is one that specifies the
operations or procedures used to produce or measure something. It’s a way to give an
General Principles of Research
• Definitions of Psychological Terms
– So if we are investigating the effect of watching violence on television on children’s aggressive behavior:
• We need to operationalize “violence” on television.
• We need to operationalize “aggressive behavior.”
General Principles of Research
• Definitions of Psychological Terms
– Violence might be operationalized as “the number of times in a one-hour show that one person
threatens or injures another person.”
– Aggressive behavior might be operationalized as “the number of insults, threats, and assaults by
the subject over a 24-hour period after watching a particular television program”. (There are other
versions of both of these operational definitions that would work well.)
Concept Check
• Operational definitions
– Which of the following might be used as an operational definition of “attraction”?
– A feeling of affection when two people are together. (1)
– The number of minutes during which two people are touching each other over a four-hour period. (2)
• The Answer is 2
• The number of minutes during which two
people are touching each other over a
Concept Check
• Which of the following might be used as an operational definition of “assertiveness?”
• The number of times a person makes requests or states his or her feelings over the course of a one-hour interaction. (1)
• An appearance of confidence and ease in social situations. (2)
• The Answer is 1
• The number of times a person makes
requests or states his or her feelings over
the course of a one-hour interaction. (1)
General Principles of Research
• Population Samples
– Usually in research we are asking questions that are pertinent to a large population of interest such as:
• seven- to ten-year-old children
General Principles of Research
• Population Samples
– But it is not practical to study all the individuals in the population.
– We take a relatively small number of
observations or individuals from the population, and we generalize from that small number.
– The small number of individuals or observations is called a sample.
General Principles of Research
• Population Samples
– There are several types of samples and sampling procedures:
• A convenience sample is a group chosen because of its ease of availability and study.
• A representative sample closely resembles the population in its percentage of males and
females, ethnic or racial groups, age levels, or whatever other characteristics might have
General Principles of Research
• Population Samples
– A random sample is one in which every individual in the population has an equal chance of being selected.
– A cross-cultural sample is one that contains groups of people from at least two distinct cultures.
General Principles of Research
• Population Samples
– How we go about obtaining a sample has to be carefully assessed in terms of our resources and goals. Sometimes it is acceptable and
appropriate to rely on a convenience sample.
Other times this strategy will produce results that are useless in helping us understand and
Concept Check
– Suppose I am interested in the attitudes of
college students towards using the Internet in their studies. I survey my students in one
Introductory Psychology class at my college.
• Can I assume that their attitudes are
representative of the attitudes of all college students in general?
General Principles of Research
• Experimenter Bias
– Because (fallible) humans do the research, we
need to keep in check the various tendencies that can work to create erroneous research findings or erroneous interpretations of findings.
– Experimenter bias is the tendency of an experimenter to unintentionally distort the
procedures or results of an experiment based on the expected or desired outcome of the research.
General Principles of Research
• Experimenter Bias
– For example, if you were a researcher testing the hypothesis that children who have been
diagnosed with learning disabilities are on
average more creative than children who have no diagnosis, you may find it hard to “ignore your
hypothesis” as you observe the children with an LD diagnosis going about whatever tasks you have devised to operationalize “creativity.”
General Principles of Research
• Experimenter Bias
– Methods have been devised to help counteract these normal human tendencies that create bias:
• Using blind observers who record data without knowing what the researcher is studying.
• Using a placebo control. A placebo is a sham treatment that makes it very difficult for the subjects (single-blind) or the subjects and
experimenter (double-blind) to know who has received the treatment and who has not.
Table 2.2
Figure 2.5
Figure 2.5 In experiments on sensory deprivation, a person who is deprived of most sensory stimulation becomes disoriented, loses track of time, and reports hallucinations. But do these results partly reflect the person’s expectation of having distorted experiences?
General Principles of Research
• Research Design
– There are many methods used to study psychological concepts and phenomena.
– We start by asking ourselves, What happens, and under what circumstances does it seem to occur? – We try to choose the best procedure. Each
General Principles of Research
• Observational (non-experimental) Research Design – Naturalistic Observation:
• Careful monitoring and examination of what people and animals do under more or less natural circumstances.
–Example: Dr. Jane Goodall’s decades-long observation of chimpanzees in the forest of Gombe, recording their social organization and biological functioning.
General Principles of Research
• Observational Research Design – Case History:
• A thorough observation and description of a
single individual, appropriate only when
done for an unusual condition or
circumstance.
–Example: The case of Phineas Gage,
whose bizarre and unfortunate accident
taught medical doctors and psychologists
much about the nature of the prefrontal
cortex of the brain.
General Principles of Research
• Observational Research Design – Survey:
• A survey is a study of the prevalence of certain beliefs, attitudes, or behaviors, based on
people’s responses to specific questions.
–Example: Albert Kinsey’s 1948 survey of the sexual preferences and habits of
Americans was groundbreaking, although not by any means beyond criticism.
General Principles of Research
• Observational Research Design – Surveys
• A Few Concerns About Survey Research: –Problems with obtaining a random or
representative sample
–Competence or honesty of those who respond
–The wording of the questions –Surveyor bias
General Principles of Research • Correlational Studies
– Correlation
• Correlation is a measure of the relationship
between two variables which are both outside of the investigator’s control.
• Examples of variables include aspects such as: height, weight, socio-economic level, number of years of education.
• The mathematical estimate of the strength and direction of a correlation is the correlation
General Principles of Research
• Correlational Studies
– The value of the correlation coefficient can range from –1.00 to +1.00.
– The higher the absolute value, the stronger the relationship is, regardless of the direction.
– A negative correlation (-) means that as one variable increases, the other decreases. An example of a negative correlation is: The more
absences a student has, the lower his or her grade in psychology is (more absences accompanied by fewer points on tests).
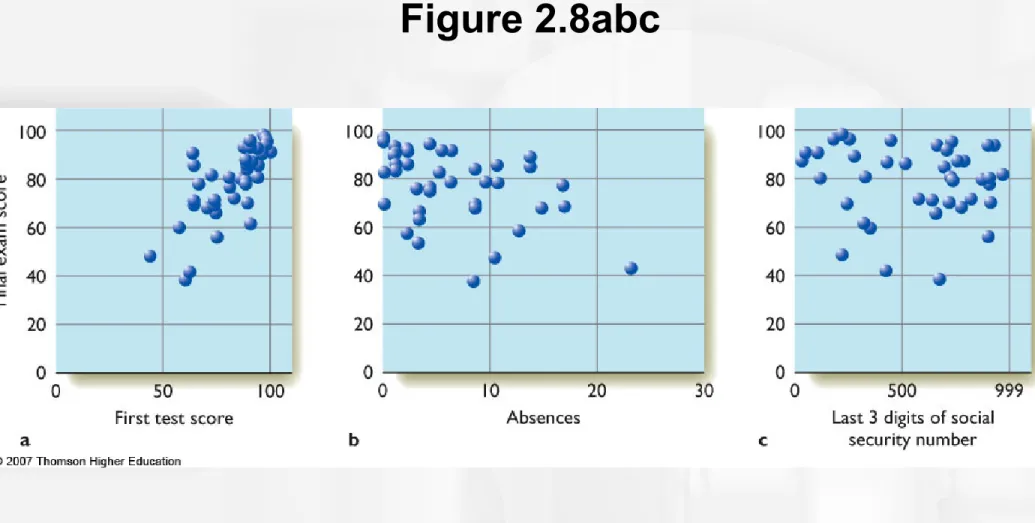
Figure 2.8abc
Figure 2.8abc In a scatterplot each dot represents data for one person; for example, each point in the center graph tells us one person’s weight and that person’s grade on the psychology final exam, in this case using hypothetical data. A positive correlation indicates that, as one variable increases, the other generally does also. A negative correlation indicates that, as one variable increases, the other generally decreases. The closer a correlation coefficient is to +1 or -1, the stronger the relationship.
General Principles of Research
• Correlational Studies
– A positive correlation (+) means that as one variable increases, so does the other. An example of a positive correlation would be the higher the annual income, the greater the amount and number of donations to charity (more income accompanied by more charitable giving). – A zero or near-zero correlation means that the variables
have no relationship, that changes in one are not related to any type of change in the other.
Concept Check
• What type of correlation?
Concept Check
– The greater the number of years of education, the higher the income
Concept Check
– The greater the score on a depression
Concept Check
• Which relationship is stronger?
+. 30 or -.90
General Principles of Research
• Correlational Studies
– Some Problems with Interpreting Correlational Research:
• Illusory Correlation: An apparent relationship based on casual observations of unrelated or weakly related events.
General Principles of Research
• Correlational Studies
– Some Problems with Interpreting Correlational Research:
• Correlation
Causation: Correlational
research tells only if and how two variables
are related. Two conditions can appear
together and not cause each other.
–Example: “The more someone weighs,
the larger his or her vocabulary is.”
W
eight and vocabulary
both increase with age.
Concept Check
• Interpreting correlational research
• A research study found a -0.75 correlation between frequency of exercise and level of depression.
• List the possible conclusions we might draw from this study.
Exercising makes depression less
likely.
Depression makes exercising less
likely.
A third variable increases exercise
Table 2.3
General Principles of Research
• Experiments – Experiment:
• A study in which the investigator manipulates at least one variable (independent) while
measuring at least one other variable (dependent).
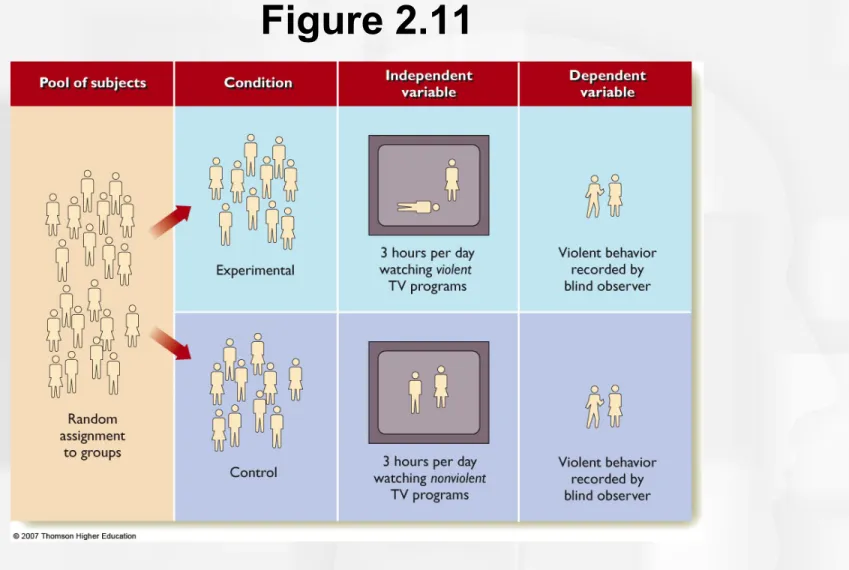
Figure 2.11
Figure 2.11 An experimenter manipulates the independent variable (in this case the programs people watch) so that two or more groups experience different treatments. Then the experimenter measures the dependent variable (in this case pulse rate) to see how the independent variable affected it.
General Principles of Research
• Experiments
– Example: To test whether the hormone
adrenaline enhances memory in mammals, a
researcher teaches rats to run a maze. She gives a randomly selected portion of the rats a drug to block production of adrenaline. She then times all the rats on the maze.
General Principles of Research
• Experiments
– Remember: In order for a study to be a true EXPERIMENT, one of the variables must be directly under the researcher’s control, and the other must be measurable in some scientific way.
Not an experiment – M/F is a subject variable,
not a true independent variable.
Concept Check
• Is it an experiment? If so, name the independent and dependent variables.
– A researcher wants to know if men or women are better at a particular set of spatial relationship
tasks. He compares a randomly selected group of 50 men and 50 women on a test of the task.
Concept Check
• A researcher wants to know if a particular herbal supplement is helpful for improving memory. She selects 100 college sophomores who achieved an average score on a memory test, gives half of
them the herb for one month, half of them an inert pill, and the re-tests them all.
Yes
IV = herb/no herb
General Principles of Research • Experiments
– Other important terminology:
• Experimental group: The set of individuals who receive the treatment being tested.
• Control group: The set of individuals who are
treated in the same way as the experimental group except for exposure to the treatment.
• Random assignment: A selection method in which the experimenter assigns subjects to either the
experimental or control group using a procedure based on chance.
General Principles of Research
• Experiments
– Possible problems in carrying out and interpreting the results of experiments:
• Demand Characteristics: Cues that tell a subject what is expected of him or her, and what the researcher hopes to find.
–Example: If the subject knows that the
drug being tested is supposed to improve mood, he or she may “feel better.”
General Principles of Research
• Experiments
– Possible problems in carrying out and interpreting the results of experiments:
• Ethical Considerations: In doing research with humans or animals, researchers must weigh possible harm that may be inflicted against the usefulness and other benefits that may be
General Principles of Research
• Ethical Concerns in Research Involving Human Subjects
– Safeguarding human subjects’ well-being:
• Use of informed consent: Subjects are advised on what to expect and explicitly state that they agree to continue.
• Institutional Research Board (IRB) Approval: A university or other reputable institution appoints a panel of qualified judges who review all research proposals before the actual study begins.
General Principles of Research
• Ethical Concerns in Research Involving Human Subjects
– American Psychological Association standards: The criteria for appropriate treatment of humans who are experimental subjects are well known to members of this largest professional organization in the science. Censure and expulsion are
possible consequences for those who do not follow these procedures.
General Principles of Research
• Ethical Concerns in Research Involving Animals
– Though highly controversial, research studies that use animals to help us understand the body and brain have been essential to progress in medicine and
psychology.
• Criteria for care and use of animals are established by professional organizations:
–APA
–The Neuroscience Society
General Principles of Research
• Ethical Concerns in Research Involving Animals
– Following the guidelines, animal care committees strive to:
• Ensure that research animals are treated humanely • Minimize discomfort and pain
• Ensure that all alternatives are examined before animals are subjected to potentially painful
procedures
– Nonetheless, this area continues to be one of great debate, and no compromise ever seems 100%
Psychological Research
Because of the challenges involved in studying
“intangible” mental processes and human behavior that is the product of diverse influences,
psychologists have developed procedures that are rigorous and inventive and very frequently do
increase our understanding of the phenomena in this complex and fascinating science!
Module 2.3
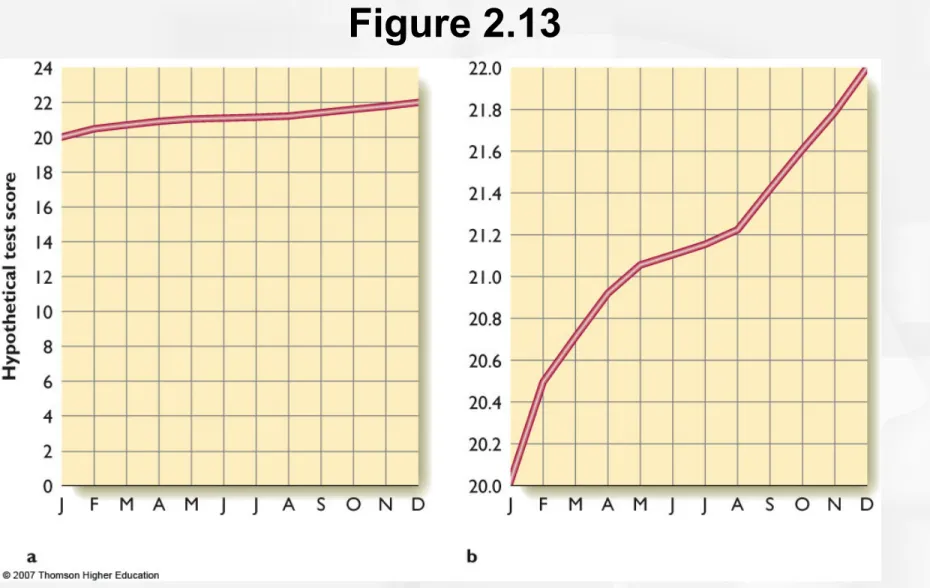
Figure 2.13
Figure 2.13 Why statistics can be misleading: Both of these graphs present the same data, an increase from 20 to 22 over 1 year’s time. But by ranging only from 20 to 22 (rather than from 0 to 22), graph (b) makes that increase look much more dramatic. (After Huff, 1954)
Descriptive Statistics
• Descriptive statistics are mathematical summaries of results. There are two broad categories of
descriptive statistics:
– Measurements of the central score
Figure 2.14
Figure 2.14 Results of an imaginary survey of study habits at one college. This college apparently has two groups of students—those who study as hard as they can and those who find other things to do. In this case both the mean and the median are misleading. This distribution is bimodal; its two modes are 0 and 8.
Descriptive Statistics
• Measurements of the Central Score: The Mode – The mode is the score that occurs most
frequently in a distribution.
– The least useful of the three measures of central score, it comes in handy when a distribution is very abnormally distributed (when the majority of scores are clustered at the low end or high end) or when working with non-numerical data
(categorical variables such as diagnostic classifications).
Descriptive Statistics
• Measurements of the Central Score: The Mean
– The mean is the sum of all the scores divided by the total number of scores. This measure is most useful when the scores are normally distributed. – A normal distribution, or normal curve, is a
symmetrical frequency of scores clustered around the mean.
Descriptive Statistics
• Measurements of the Central Score: The Median
– The median is the middle score when we arrange all the scores in order from lowest to highest.
– It is especially useful when the scores we are working with are very abnormally distributed.
– For example, if our distribution of scores is 2, 3, 5, 6, and 50, 5 is a more accurate description of the “middle” than the mean, which would be 13 for this set of scores.
Figure 2.15
Figure 2.15 The monthly salaries of the 25 employees of company X, showing the mean, median, and mode. (After Huff, 1954)
Concept Check:
• Calculate the mean, median and mode for this distribution of scores:
Mean = 5
Median = 4
Mode =
4
Concept Check
• What would be the best measure of central score for this distribution?
1, 2, 2, 3, 3, 20
Concept Check
• What would be the best measure of central score for this distribution?
4, 4, 4, 4, 4, 4, 7, 8, 10
Descriptive Statistics
• Measurements of Variation
– The range is a statement of the highest and lowest scores
– If our distribution has the following scores: 1, 2, 3, 5, 7, 9, 9, 10, the range is from 1 to 10.
Descriptive Statistics
• Measurements of Variation
– The standard deviation (SD) is a measurement of the amount of variation among scores in a normal distribution.
– The more closely the scores are clustered around the mean, the smaller the standard deviation is. – Standard deviations are used to make meaningful
comparisons on different tests or on different versions of the same kind of test.
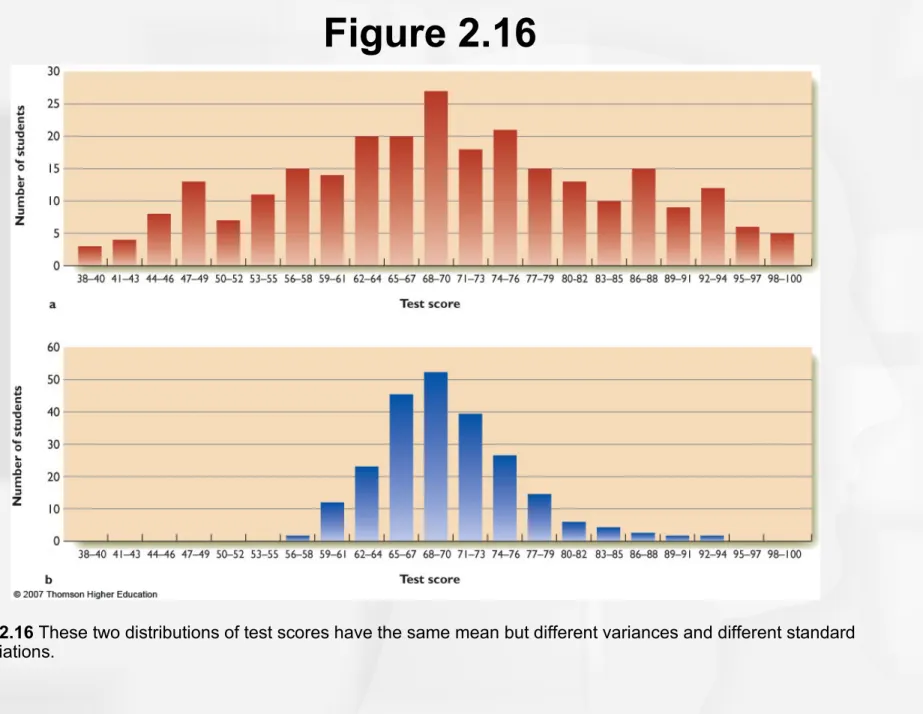
Figure 2.16
Figure 2.16 These two distributions of test scores have the same mean but different variances and different standard deviations.
Concept Check:
On your first statistics exam of the semester, you get a score of 90, the mean for the class is 70, and the standard deviation is 20. On the second exam of the semester, you get an 80. The mean for the class is 65 and the standard deviation is 5. Did you do
You did much, much better
on exam 2!
Evaluating Results: Inferential Statistics
As mentioned earlier in the module, we rarely are
certain in the world of research. To infer is to “guess based on evidence.” Inferential statistics are the
mathematical procedures we use for this educated guessing – a statement about a large population based on an inference from a small sample.
Figure 2.17
Figure 2.17 In a normal distribution of scores, the amount of variation from the mean can be measured in standard deviations. In this example scores between 400 and 600 are said to be within 1 standard deviation from the mean; scores between 300 and 700 are within 2 standard deviations.
Evaluating Results: Inferential Statistics
• Sometimes we infer where the “true mean” of the population of interest lies based on sample mean.
– We use a confidence interval to state how sure we are that the true mean lies within a certain range.
– The calculation of width of the confidence interval is based on the sample size (the larger the better) and the standard deviation (the smaller the better.)
• Example: “Based on analysis of this sample, I am 95% confident that the true population mean lies between 5.0 and 7.0.”
Evaluating Results: Inferential Statistics
• Confidence Intervals
– Confidence intervals are typically reported at the 90%, 95% or 99% levels of certainty.
– The higher the confidence level, the broader the range that is given by the researcher.
– If the standard deviation is small and the sample on which the confidence interval is based is large, we can increase our certainty without necessarily broadening the range.
Figure 2.18
FIGURE 2.18 The vertical lines indicate 95% confidence intervals. The pair of graphs in part a indicate that the true mean has a 95% chance of falling within a very narrow range. The graphs in b indicate a wider range and therefore suggest less certainty that reward is a more effective therapy than punishment.
Evaluating Results: Inferential Statistics
• Probability Values
– A probability value is a way to estimate if a score would be extremely rare given what we know
about the likely range in which the population mean falls.
– If the researcher says that there is a 95% certainty that the population mean falls between 5.0 and
7.0, and a particular score falls at 8.2, then that score has a probability value of less than 5% (p < . 05) and it is an exceptional score in some way.
Evaluating Results: Inferential Statistics
• Probability Values and Statistical Significance
– Often scores that are exceptional in this way are interpreted as being unlikely to have arisen by chance.
– A result that is unlikely to have occurred by
chance in a distribution is interpreted as being statistically reliable or statistically significant.
Statistics and Conclusions
Consistent, dependable, large effects do not require statistics for analysis and interpretation. They speak for themselves.
Psychologists are often dealing with small and fragile effects, or effects that only arise under a
certain set of circumstances. To do meaningful work in this science, we need a solid understanding of