Sharif University of Technology
Scientia IranicaTransactions B: Mechanical Engineering http://scientiairanica.sharif.edu
Evaluation of vehicle braking parameters by multiple
regression method
A. Demir
a;and A.
Oz
ba. Department of Automotive, Faculty of Technology, Marmara University, Goztepe Campus, Istanbul, Turkey.
b. Department of Motor Vehicles and Transportation Technologies, TBMYO, Mehmet Akif Ersoy University, Burdur, Turkey. Received 16 August 2018; received in revised form 6 May 2019; accepted 26 June 2019
KEYWORDS Braking parameters; Braking performance; Friction coecient; Brake disc-pad pair; Multiple regression method.
Abstract.This study uses two pairs of OEM brake disc-pads. One of these discs belongs to a passenger car and the other one to a light commercial vehicle. The disc-pad pair of the passenger car is subject to the global brake eectiveness test by a full-scale inertia dynamometer according to SAE J2522 test standard; the other one is subject to the tests by a full-scale inertia dynamometer according to Fiat 7-H4020 and 7-H2000 standards. During these tests, 13 variables for the passenger car disc-pad pair and 11 variables for light commercial vehicle disc-pad pair were measured and recorded. The interrelation of the parameters was analyzed by the multiple regression method, and importance levels were determined. In this study, dependent variables in the multiple regression method including braking time, friction coecient, disc nal temperature, brake speed, and brake pressure were selected for each braking pair. In multiple regression analysis concerning the passenger car, for each unit of increase in deceleration and friction coecient, braking time decreases with 7.3 and 60.9 units, respectively. Moreover, for each unit of increase in brake pressure and friction coecient for the light commercial vehicle, braking time increases with 1.267 and 91.887 units, respectively.
© 2019 Sharif University of Technology. All rights reserved.
1. Introduction
A braking system is one of the most important safety systems of a vehicle [1]. It enables controlled dissipa-tion of energy to slow down, stop, or control the speed of a vehicle [2-4]. The kinetic energy of the vehicle is converted into mechanical energy, while braking leads to heat dissipation and temperature rise of the disc and pads pairs [1]. Friction disc brakes are commonly used in vehicles as wheel brakes. With braking, the temper-ature of disc-pad interface and a change in speed have
*. Corresponding author. Tel.: +90 216 336 57 70 / 1366; Fax: +90 216 337 89 87
E-mail address: [email protected] (A. Demir) doi: 10.24200/sci.2019.51584.2262
eect on friction coecient (). drops with increasing temperature and sliding speed; therefore, brake fade (brake fading) and speed fade take place [2]. Brake fade is an occurrence that takes place in every vehicle with a friction brake system when signicantly drops based on the temperature [3,5,6]. High temperature values during braking cause brake fade, premature wear, brake uid vaporization, bearing failure, thermal cracking, and thermally-excited vibrations [7]. Ideal brake pads must ensure uniform and stable friction in every working condition without developing brake fade at any temperature. Brake friction materials comprise more than 10 ingredients required to achieve the desirable braking performance including stable friction coecients, low wear, and low noise generation in a wide range of braking conditions [8]. They are classied as organic, semi-metallic, metallic, synthetic,
and ceramic [9]. In another study, they were classied into semi-metallic, steel metallic, no-steel low-metallic (also known as non-asbestos organic-NAO), and European metallic depending on ferrous and non-ferrous metal content [10]. It was shown that value for braking ranged 0.30-0.35 for automobiles [6], 0.45 for automobiles, over 0.50 for sports cars, and around 0.35 for rail vehicles [11]. Another study detected that a couple of ventilated discs based on gray cast iron and semi-metallic pad had values of 0.246 and 0.412 between the temperatures of 98C and 632C [3].
Braking performance can be dened as the abil-ity of a vehicle to stop as soon as possible while maintaining its driving stability [12]. It is basi-cally evaluated according to braking distance, braking torque, or braking eciency (Carlos & Ferro, 2005). For this purpose, dynamometers are frequently used. Performance, durability, and noise tests are the most common tests for dynamometers. Most of the iner-tia dynamometer procedures (SAE, JASO, ISO, AK, FMVSS, and JIS) used by OEMs, pad suppliers, and component manufacturers are carried out with single-ended dynamometers [13].
Deterministic mathematical models that are de-voted to analyzing braking parameters of vehicles are frequently used [14]. However, the values of decel-eration and braking distance parameters are random values in practice. A number of studies have investi-gated the results of the evaluation of vehicle braking parameters, which are considered as random values with known possibility properties [15].
Tribological conditions of the braking components during operation have a dominant eect on brake fade [6]. Tribological analysis is one of the most important mechanical elds in the industry. The tri-bological properties of two contact surfaces of engines and machines generally depend on factors such as load, speed, temperature, sliding time, lubricant, and additive formulation [16]. Individual mechanisms of friction are dependent upon temperature, normal load, and sliding velocity; thus, it seems reasonable to assume that is dependent upon these parameters [17]. In many studies [17-21], is found to be dependent on temperature. In many studies [17,21-24], is found to be dependent on braking force and velocity. In most of these studies, shows a decreasing trend with increasing velocity, while it shows a mixed trend with the increasing load [25].
During the last decades, ever more sophisticated models have been developed. The techniques in the literature include static and dynamic models, neural networks, and state observers. The most commonly used model is the static model [26]. An analytical formulation considering only the friction dependence on the speed was proposed [27]. A very simple ana-lytical formulation based on steady-state experimental
tests that correlate pressure, speed, and temperature dependences to friction and wear was assessed [28]. An alternative formulation was put forth that, in addition to the sliding speed, involved thermal eects due to an increase in the temperature of the friction materials [29].
In this study, two pairs of an original brake disc-pad are used. One of these discs belongs to a Passenger Car (PC), and the other one belongs to a Light Commercial Vehicle (LCV). The PC disc-pad pair is subject to the global brake eectiveness test by a full-scale inertia dynamometer according to SAE J2522 test standard; the other one is subject to the tests by the full-scale inertia dynamometer according to FIAT 7-H4020 and 7-H2000 standards. For the PC disc-pad pair tests, 276 braking tests from 21 dierent cate-gories were performed including features such as green eectiveness, speed sensitivity, fade resistance, friction recovery, and friction stability; for the LCV disc-pad pair tests, a total of 130 braking tests were performed in 2 dierent categories including burnish and hot judder I-II procedures. During these tests, braking parameters such as the number of brakes performed, cycle time, brake speed, release speed, braking duration, deceler-ation, braking torque (min, avg, max), pad actuator pressure (min, avg, max), friction coecient (min, avg, max), and initial and nal temperatures (disc, inner and outer pads) were measured and recorded. By using all the data collected from these tests, braking parameters were evaluated according to a multiple re-gression method. This study is divided into four parts. The rst section includes an introduction and a short literature abstract. The second section includes the selection of the discs, braking test unit, test standards, multiple regression model, and dependent and inde-pendent variables examined by the model. The third section includes the equations of dependent braking parameters estimated according to multiple regression method such as braking time, friction coecient, disc nal temperature, brake speed, and braking pressure. Conclusions are presented in the nal section.
2. Materials and method 2.1. Selection of the discs
In this study, two pairs of front ventilated disc-pad pairs are used. Basic characteristics and material components of the disc-pad pairs are shown in Table 1. 2.2. Testing standard and brake test
mechanism
SAE-recommended practice denes an inertia-dynamometer test procedure to assess the eective behavior of friction material with respect to pressure, temperature, and speed for motor vehicles tting with hydraulic brake actuation [30,31]. The eciency
Table 1. Properties of the disc and pad.
PC LCV
Disc Pad Disc Pad
Thickness (mm) 22 12 21.805 17.663
Disc diameter (mm) 255 { 257 {
Mass (g) 5,004 292.2 5,328.73 335.43
Disc and pad materials 3.58C2.28Si0.572Mn
0.02P PN529H-FF NAC
83.2Fe4.9Si0.4Mn2. 8P0.9S0.2Cr1.8Al2. 4Cu2.5Zn0.1Sn0.2Zr
11.6Fe4Si2.7P2S11Cr 31.3Ni6Sn7.3Zr0.3Bi
8.9W13.8Hf0.6Ti
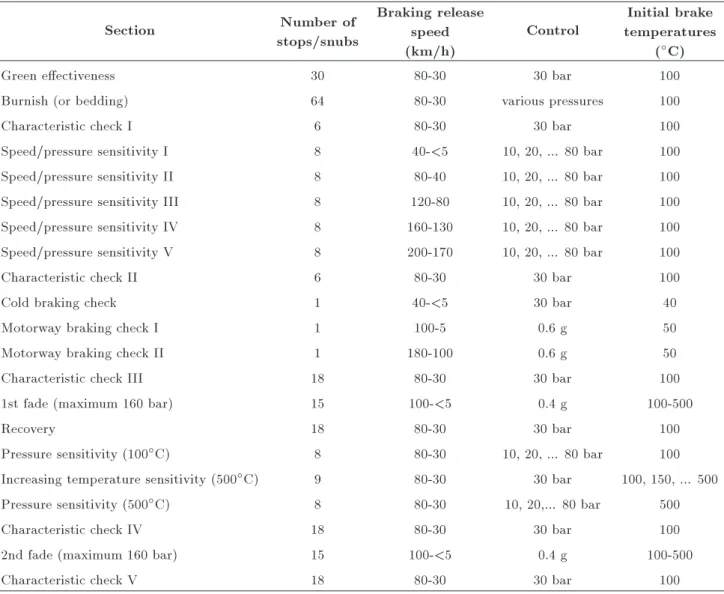
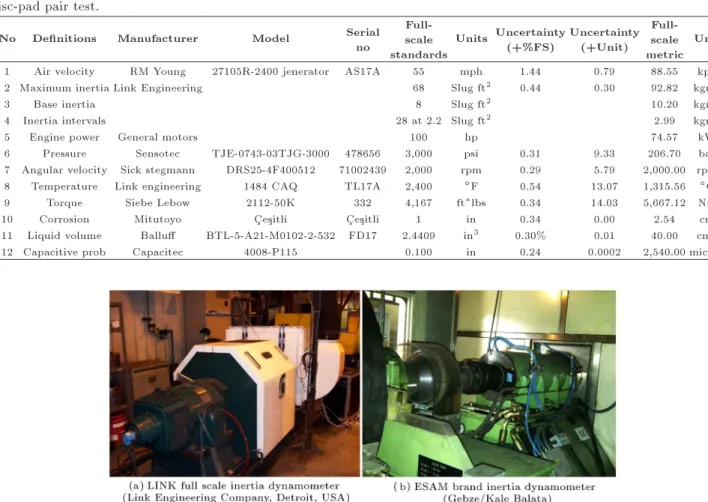
of brake systems is measured by braking distance depending on vehicle speed or deceleration and running-up time. This eciency can be determined by various experiments. Certain parameters are required for brake disc characteristics. SAE J2522 is a universal eectiveness test that is useful only when target friction levels in specic sections or a baseline material is available for comparison. The SAE J2522 has become the baseline for several test versions with cold temperature, wet eectiveness, parking brake evaluation, and ramp applications. It is a useful friction behavior evaluation regarding green eectiveness, speed sensitivity, fade resistance, friction recovery, and friction stability [30]. PC disc-pad pair is subject to the J2522 global brake eectiveness test of SAE with a full-scale inertia dynamometer (Table 2). In tests, such parameters as braking number, cycle time, brake speed, release speed, stop time, deceleration, braking torque, pad actuator pressure, coecient of friction, rotor, and input/output temperature were saved for 276-braking. While the total test time of disc was 41,400 s (11.5 h), averagely, 1,770 seconds (0.5 h) of this time was determined as the eective braking time. The test of the LCV disc-pad pair was carried out by a full-scale inertia dynamometer according to FIAT 7-H4020 and/or 7H2000 standard, as shown in Table 3. The braking tests were performed using an inertia dynamometer with a maximum resolution rate of 2400 rpm, a maximum moment of 166 kgm2, a max-imum power rate of 140 kW, and a maxmax-imum torque rate of 5000 Nm. The temperature of the rubbing interface was measured using K-type thermocouple on the disc surface. The inertia dynamometers used in the tests are shown in Appendix { Figure A.1; their technical specications and measurement parameters are provided in Tables A.1 and A.2.
2.3. Regression analysis
Detecting if there is a relation between two variables and, if so, determining the degree of this relation is a common problem in statistical analysis. Regression is the rst technique that comes to mind when analyzing the relation between variables. Regression analysis is to explain the relations between a dependent variable and an independent variable (simple regression) or more than one independent variable (multiple regression) by a mathematical equation. In regression analysis, the relationship between independent variables Xi and dependent variables Yi is expressed as a mathematical function. For example, if a linear relationship such as Yi = +Xi + "i (i = 1; 2; 3; :::; n) is foreseen between Y and X, the rst step is to predict the unknown parameters of the model. When the unknown param-eters of the model are predicted, to predict the value of the dependent variable for dierent values of the independent variables is another objective of regression analysis. In the multiple linear regression model, Yi= 0+ 1Xi1+ 2Xi2+ ::: + pXip+ "i (i = 1; 2; :::; n) can be written for p number of explanatory variables and n number of observations [33,34]. In order to make reliable parameter predictions for the regression model that will be obtained after the results of both simple and multiple linear regression analysis, some of the assumptions about the model must be ensured. Dependent and Independent Variables (DV and IV) in multiple regression method
In this study, braking time, friction coecient, disc nal temperature, brake speed, and brake pressure for each braking pair are examined with the multiple regression method. In the analysis of PC disc-pad pair, 13 variables are used as friction coecient (avg),
Table 2. SAE J2522 dynamometer global brake eectiveness [30].
Section Number of
stops/snubs
Braking release speed (km/h)
Control
Initial brake temperatures
(C)
Green eectiveness 30 80-30 30 bar 100
Burnish (or bedding) 64 80-30 various pressures 100
Characteristic check I 6 80-30 30 bar 100
Speed/pressure sensitivity I 8 40-<5 10, 20, ... 80 bar 100
Speed/pressure sensitivity II 8 80-40 10, 20, ... 80 bar 100
Speed/pressure sensitivity III 8 120-80 10, 20, ... 80 bar 100
Speed/pressure sensitivity IV 8 160-130 10, 20, ... 80 bar 100
Speed/pressure sensitivity V 8 200-170 10, 20, ... 80 bar 100
Characteristic check II 6 80-30 30 bar 100
Cold braking check 1 40-<5 30 bar 40
Motorway braking check I 1 100-5 0.6 g 50
Motorway braking check II 1 180-100 0.6 g 50
Characteristic check III 18 80-30 30 bar 100
1st fade (maximum 160 bar) 15 100-<5 0.4 g 100-500
Recovery 18 80-30 30 bar 100
Pressure sensitivity (100C) 8 80-30 10, 20, ... 80 bar 100
Increasing temperature sensitivity (500C) 9 80-30 30 bar 100, 150, ... 500
Pressure sensitivity (500C) 8 80-30 10, 20,... 80 bar 500
Characteristic check IV 18 80-30 30 bar 100
2nd fade (maximum 160 bar) 15 100-<5 0.4 g 100-500
Characteristic check V 18 80-30 30 bar 100
Table 3. Test parameters of a light commercial vehicle disc-pad pair [32]. Section Number of
brakes
Initial speed (km/h)
Release speed (km/h)
Initial brake temperatures (C)
Deceleration (m/s2)
Burnish 100 80 0 100 {
Hot Judder-I 15 152 0 100 1, 2, and 3
Hot Judder-II 15 152 0 300 1, 2, and 3
braking time (t), braking torque (Mavg), brake pressure (pavg), brake speed (BS), brake release speeds (BR), deceleration (a), disc initial and nal temperatures (TDI and TDF), inpad initial and nal temperatures (TIP Iand TIP F), outpad initial and nal temperatures (TOP I and TOP F); for LCV disc-pad pair, 11 variables are used as friction coecients (avg), braking time (t), braking torque (Mavg), brake pressure (pavg), brake speed (BS), brake release speeds (BR), deceleration (a), inertia (I), uid absorption (FB), and disc initial and nal temperatures (TDI and TDF). Dependent
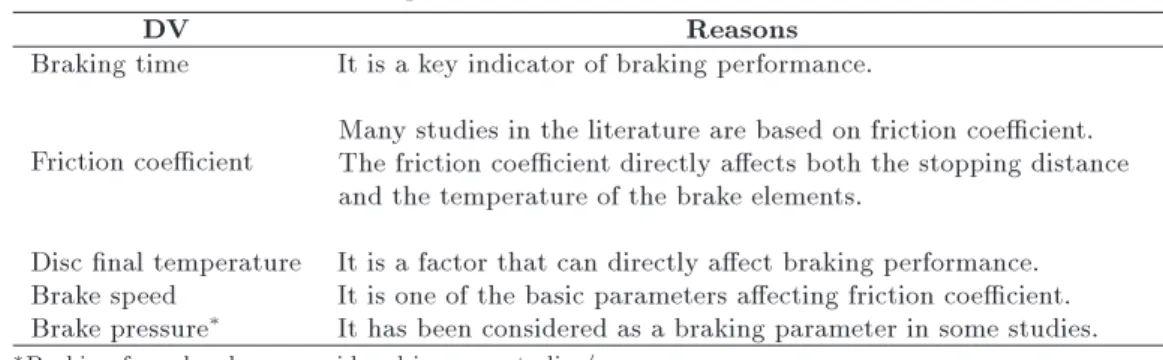
variables in the multiple regression method such as braking time, friction coecient, disc nal tempera-ture, brake speed, and brake pressure are selected for each braking pair. The reasons for choosing dependent variables are given in Table 4.
3. Results and discussion
In this study, two pairs of OEM disc-pad were used. The PC disc-pad pair was subjected to the global brake eectiveness test by a full-scale inertia dynamometer
Table 4. Dependent variables and reasons for selection.
DV Reasons
Braking time It is a key indicator of braking performance.
Friction coecient Many studies in the literature are based on friction coecient.The friction coecient directly aects both the stopping distance and the temperature of the brake elements.
Disc nal temperature It is a factor that can directly aect braking performance. Brake speed It is one of the basic parameters aecting friction coecient. Brake pressure It has been considered as a braking parameter in some studies. Braking force has been considered in some studies/papers.
Table 5(a). Summary of multiple regression analysis for PC.
DV O R square
IV
(p<0.05) Equation(s) The highest eect Braking time 276 0.917 10 t = 29:16 + 0:59vBS 0:06vBR 7:307a + 0:057Mavg 0:454pavg
60:868 + 0:012TDI 0:012TDF 0:182TOP I+ 0:181TOP F (#); a(#)
Friction coecient 276 0.962 11 = 0:338 + 0:0004v0:008pavg+ 0:0004TBS+ 0:0003vDI 0:0001TBS DF0:004t + 0:0005M0:0009TIP I+ 0:0004Tavg IP F
+0:001TOP I+ 0:0009TOP F
pavg(#); t(#)
Disc nal temperature 276 0.990 11 TDF = 149:972 + 1:549v4:011pavg 514:2 + 0:935TBS 0:602vDIBR 4:105t + 0:260Mavg
+4:699TIP I 3:776TIP F 7:038TOP I+ 6:09TOP F
(#); TOP I(#)
Brake speed 276 0.973 11
vBS= 78:11 + 0:730vBR+ 2:199t + 35:01a 0:264Mavg+ 1:914pavg
+225:76 0:255TDI+ 0:167TDF 1:724TIP I
+1:275TIP F+ 0:473TOP I
("); a(")
Brake pressure 276 0.997 9 pavg= 38:016 + 0:0517vBS 0:034vBR 0:452t + 0:062Mavg
112:26 + 0:034TDI 0:0117TDF+ 0:102TOP I 0:081TOP F (#); t(#)
Table 5(b). Summary of multiple regression analysis for LCV.
DV O R square
IV
(p<0.05) Equation(s)
The highest eect Braking time 130 0.964 8 t = 32:688 + 0:395I + 0:107vBS+ 1:267pavg
0:148Mavg+ 0:204a + 0:003F A + 91:887 0:012TDI
("); pavg(")
Friction coecient 130 0.984 8 = 0:289 0:00099I + 0:0044t + 0:0012Mavg
0:016pavg 0:0011a 0:00001F A + 0:0005TDI 0:00045TDF pavg(#)
Disc nal temperature 130 0.989 8 TDF= 119:027 + 2:051I + 1:651vBS+ 0:423Mavg
5:219pavg 0:951a + 0:0195F A 388:18 + 0:865TDI (#); pavg(#)
Brake speed 130 0.977 7 vBS= 130:12 1:276I 2:392vBR+ 0:977t
+0:190a 0:0198F A 0:266TDI 0:362TDF
BR(#)
Brake pressure 130 0.986 8 pavg= 16:186 0:0925I + 0:192t + 0:0656Mavg
0:0543a + 0:001F A 50:75 + 0:022TDI 0:019TDF (#)
according to SAE J2522 test standard; the other pair was subjected to the tests by a full-scale inertia dynamometer according to FIAT 7-H4020 and 7-H2000 standards. For the PC disc-pad pair tests, 276 braking tests from 21 dierent categories were performed; for the LCV tests, a total of 130 braking cases in 2 dierent categories consisting of burnishing and judder I-II
procedures were performed. During these tests, 13 vari-ables for the PC disc-pad pair and 11 varivari-ables for the LCV disc-pad pair were measured and recorded. The interrelation of these parameters was analyzed with the multiple regression method, and eects of the explana-tory variable(s) were determined. A summary of all regression analyses is given in Tables 5(a) and 5(b).
3.1. Evaluating braking time
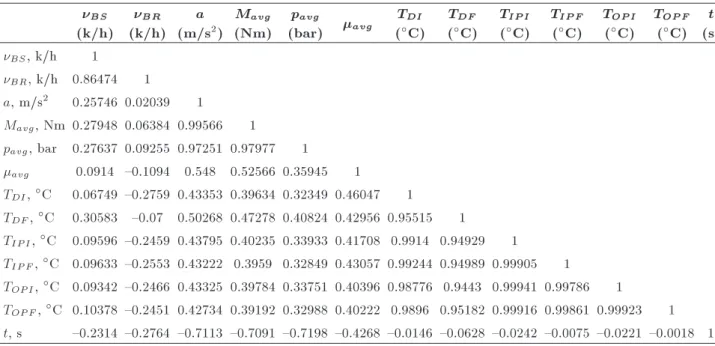
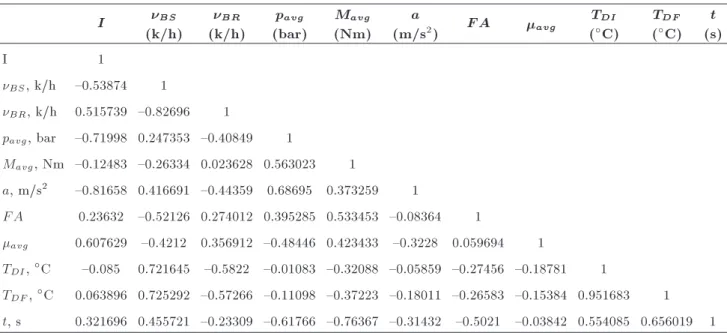
The correlation coecients between Independent Vari-ables (IV) and braking time (1) of the PC disc-pad pair are provided in Table A.3. The multiple regression output, prepared using Excel, is given in Table A.4. The R square for the braking time regression is 0.917, or 91.7% (R square, R2, varies from 0 to 1, and higher values indicate a better regression). One popular interpretation is that R2 is the percent explained variability [33]. This means that 91.7% of the change in the dependent variable is explained by the independent variables in the model. In simple words, the model is 91.7% good). Each predictor has a coecient, its standard error, a tratio, and the corresponding P -value. Ten of the coecients in the regression statistics have P -values less than 5%. Each of the variables (BS, BR, a, Mavg, pavg, avg, TDI, TDF, TOP I, and TOP F) is a signicant predictor of the braking time. The constant term (intercept) in the regression equation (1) is 29.16. For each unit of increase in BS, Mavg, TDI, and TOP F, the braking time is predicted to increase by 0.059, 0.057, 0.012, and 0.181 units, respectively. For each unit of increase in BR, a, pavg, , TDF, and TOP I, braking time decreases with 0.06, 7.307, 0.454, 60.868, 0.012, and 0.182 units, respectively. The other independent variables, TIP I and TIP F, are not statistically signicant (Table A.4).
The estimated regression equation for braking time of the PC is:
t =29:16 + 0:59vBS 0:06vBR 7:307a
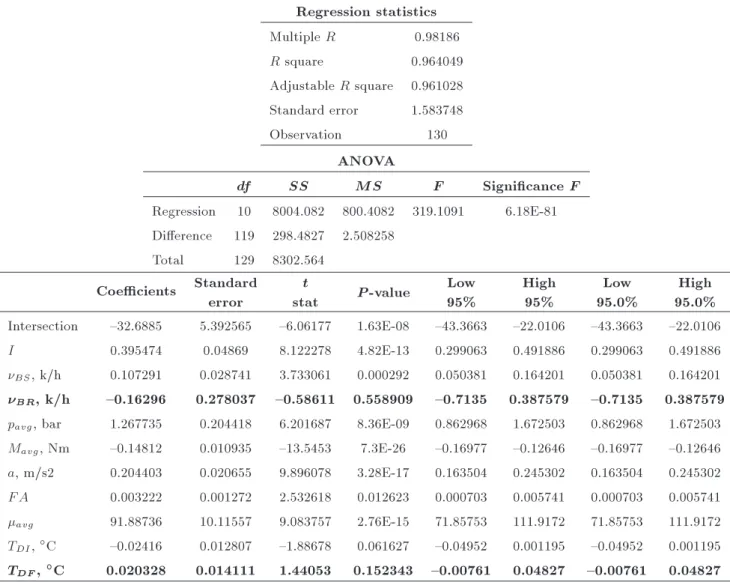
+ 0:057Mavg 0:454pavg 60:868 + 0:012TDI 0:012TDF 0:182TOP I+ 0:181TOP F: (1) The correlation coecients and the multiple regression output for the LCV disc-pad pair are given in Ta-bles A.5 and A.6. R square equals 0.964, which is a very good t. Then, 96.4% of the variations in braking time are explained by the independent variables. Eight of the coecients in the regression statistics have P -values less than 5%. The constant term is -32.688. For each unit of increase in I, BS, pavg, a, F A, and avg in Eq. (2), the braking time is predicted to increase by 0.395, 0.107, 1.267, 0.204, 0.003, and 91.887 units, respectively. For each unit of increase in Mavg and TDI, braking time decreases with 0.148 and 0.024 units, respectively. The other independent variables, BRand TDF, are not statistically signicant (Table A.6).
The estimated regression equation for the braking time of the LCV is as follows:
t = 32:688 + 0:395I + 0:107vBS+ 1:267pavg 0:148Mavg+ 0:204a + 0:003F A + 91:887
0:012TDI: (2)
3.2. Evaluating friction coecient
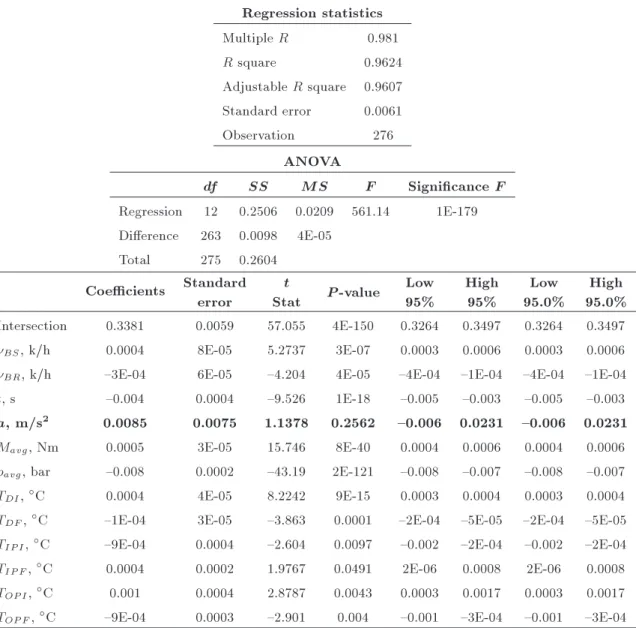
The correlation coecients and the multiple regression output for the PC disc-pad pair are given in Tables A.7 and A.8. R square equals 0.962, and 96.2% of the variations in avg are explained by the independent variables. Eleven of the coecients in the regression statistics have P -values less than 5%. Each of the variables (BS, BR, t, Mavg, pavg, TDI, TIP F, TIP I, TDF, TOP I, and TOP F) is a signicant predictor of the friction coecient. The constant term is 0.338. For each unit of increase in BS, Mavg, TDI, TIP F, and TOP I in Eq. (3), the friction coecient is predicted to increase by 0.0004, 0.0005, 0.0004, 0.0004, and 0.001 units, respectively. For each unit of increase in BR, t, pavg, TDF, TIP I, and TOP F, friction coecient decreases with 0.0003, 0.004, 0.008, 0.0001, 0.0009, and 0.0009 units, respectively. The other indepen-dent variable, a, is not statistically signicant (Table A.8).
The estimated regression equation for avg of the PC is as follows:
=0:338 + 0:0004vBS+ 0:0003vBS 0:004t + 0:0005Mavg 0:008pavg+ 0:0004TDI
0:0001TDF 0:0009TIP I+ 0:0004TIP F + 0:001TOP I+ 0:0009TOP F: (3) The correlation coecients and the multiple regression output for the LCV disc-pad pair are given in Ta-bles A.9 and A.10. R square equals 0.984, and 98.4% of the variations in avgare explained by the independent variables. Eight of the coecients in the regression statistics have P -values less than 5%. Each of the variables (I, t, pavg, Mavg, a, F A, TDI, and TDF) is a signicant predictor of the friction coecient. The constant term is 0.289. For each unit of increase in t, Mavg, and TDI in Eq. (4), the friction coecient is predicted to increase by 0.004, 0.0012, and 0.0005 units, respectively. For each unit of increase in I, pavg, a, F A, and TDF, friction coecient decreases with 0.00099, 0.016, 0.0011, 0.00001, and 0.00045 units, respectively. The other independent variables BS and BR are not statistically signicant (Table A.10).
The estimated regression equation for avg of the LCV is as follows:
= 0:289 0:00099I + 0:0044t + 0:0012Mavg 0:016pavg 0:0011a 0:00001F A
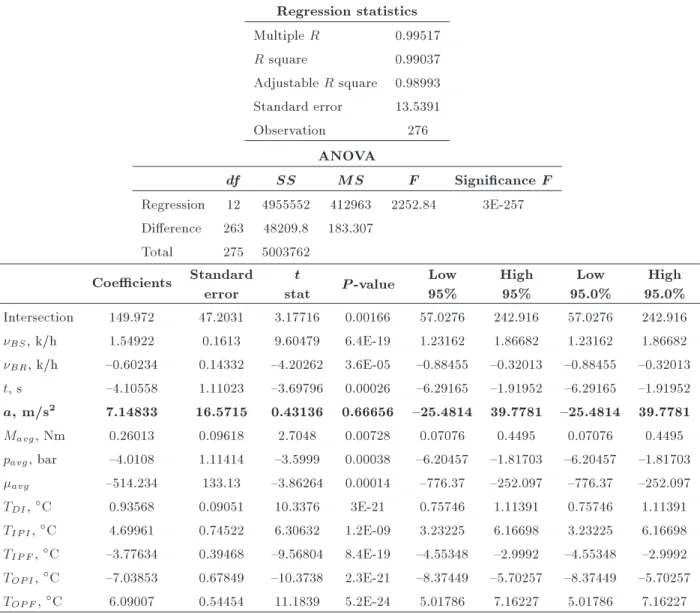
+ 0:0005TDI 0:00045TDF: (4) 3.3. Evaluating disc nal temperature
output of the PC disc-pad pair are given in Tables A.11 and A.12. R square equals 0.990, and 99% of the variations in TDF are explained by the independent variables. Eleven of the coecients in the regression statistics have P -values less than 5%. Each of the variables (BS, BR, t, Mavg, pavg, avg, TDI, TIP F, TIP I, TOP I, and TOP F) is a signicant predictor of TDF. The constant term is 149.972. For each unit of increase in BS, Mavg, TDI, TIP I, and TOP F in Eq. (5), TDF is predicted to increase by 1.549, 0.260, 0.935, 4.699, and 6.090 units, respectively. For each unit of increase in BR, t, pavg, TDF, avg, TIP F, and TOP I, the disc nal temperature decreases with 0.602, 4.105, 4.011, 514.234, 3.776, and 7.038 units, respectively. The other independent variable, a, is not statistically signicant (Table A.12).
TDF =149:972 + 1:549vBS 0:602vBR 4:105t + 0:260Mavg 4:011pavg 514:2 + 0:935TDI + 4:699TIP I 3:776TIP F
7:038TOP I+ 6:09TOP F: (5) The correlation coecients and the multiple regres-sion output for the LCV disc-pad pair are given in Tables A.13 and A.14. R square equals 0.989, and 98.9% of the variations in TDF are explained by the independent variables. Eight of the coecients in the regression statistics have P -values less than 5%. Each of the variables (I, BS, a, Mavg, pavg, F A, avg, and TDI) is a signicant predictor of TDF. The constant term is {119.027. For each unit of increase in I, BS, Mavg, F A, and TDI in Eq. (6), TDF is predicted to increase by 2.051, 1.651, 0.423, 0.0195, and 0.865 units, respectively. For each unit of increase in pavg, a, and avg, the disc nal temperature decreases with 5.219, 0.951, and 388.176 units, respectively. The other independent variables BR and t are not statistically signicant (Table A.14).
TDF = 119:027 + 2:051I + 1:651vBS + 0:423Mavg 5:219pavg 0:951a
+ 0:0195F A 388:18 + 0:865TDI: (6) 3.4. Evaluating brake speed
The correlation coecients and the multiple regres-sion output for the PC disc-pad pair are given in Tables A.15 and A.16. R square equals 0.973, and 97.3% of the variations in BS are explained by the independent variables. Eleven of the coecients in the regression statistics have P -values less than 5%. Each of the variables (BR, t, a, Mavg, pavg, avg, TDI, TDF,
TIP I, TIP F, and TOP I) is a signicant predictor of BS. The constant term is {78.110. For each unit of increase in BR, t, a, pavg, avg, TDF, TIP F, and TOP I in Eq. (7), BS is predicted to increase by 0.730, 2.199, 35.013, 1.914, 225.763, 0.167, 1.275, and 0.473 units, respectively. For each unit of increase in Mavg, TDI, and TIP I, the brake speed decreases with 0.264, 0.255, and 1.724 units, respectively. The other independent variable TOP F is not statistically signicant (Table A.16).
vBS= 78:11 + 0:730vBR+ 2:199t + 35:01a 0:264Mavg+ 1:914pavg+ 225:76 0:255TDI+ 0:167TDF 1:724TIP I
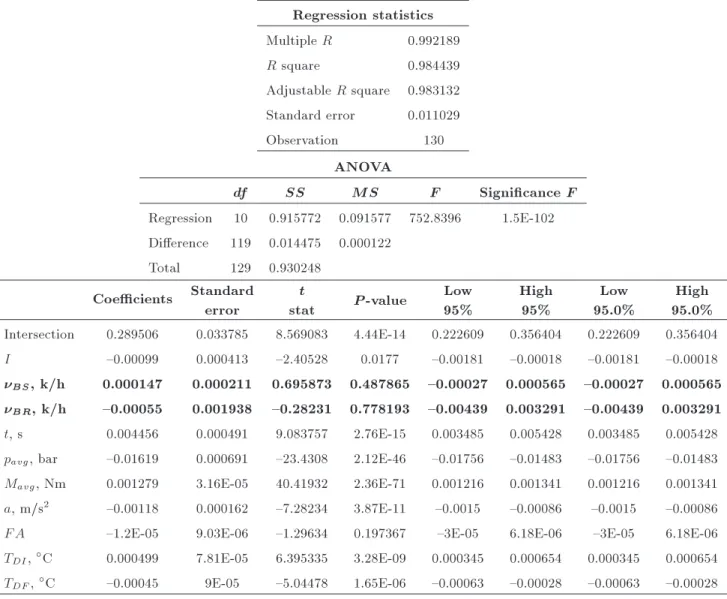
+ 1:275TIP F + 0:473TOP I: (7) The correlation coecients and the multiple regres-sion output for the LCV disc-pad pair are given in Tables A.17 and A.18. R square equals 0.977, and 97.7%. of the variations in BS are explained by the independent variables. Seven of the coecients in the regression statistics have P -values less than 5%. Each of the variables (I, BR, a, t, F A, TDI, and TDF) is a signicant predictor of BS. The constant term is 130.119. For each unit of increase in t and a in Eq. (8), BS is predicted to increase by 0.977 and 0.190 units, respectively. For each unit of increase in I, BR, F A, TDI, and TDF, brake speed decreases with 1.276, 2.392, 0.0198, 0.266, and 0.362 units, respectively. The other independent variables, pavg, Mavg, and avg, are not statistically signicant (Table A.18).
vBS=130:12 1:276I 2:392vBR+ 0:977t + 0:190a 0:0198F A 0:266TDI
0:362TDF: (8)
3.5. Evaluating average braking pressure The correlation coecients and the multiple regres-sion output for the PC disc-pad pair are given in Tables A.19 and A.20. R square equals 0.997, and 99.7% of the variations in pavg are explained by the independent variables. Nine of the coecients in the regression statistics have P -values less than 5%. Each of the variables (BS, BR, t, Mavg, avg, TDI, TDF, TOP I, and TOP F) is a signicant predictor of pavg. The constant term is 38.016. For each unit of increase in BS, Mavg, TDI, and TOP I in Eq. (9), pavgis predicted to increase by 0.0517, 0.062, 0.034, and 0.102 units, respectively. For each unit of increase in BR, t, avg, TDF, and TOP F, average braking pressure decreases with 0.034, 0.452, 112.26, 0.0117, and 0.0814 units, respectively. The other independent variables a, TIP I, TIP F are not statistically signicant (Table A.20).
pavg=38:016 + 0:0517vBS 0:034vBR 0:452t + 0:062Mavg 112:26avg+ 0:034TDI
0:0117TDF+ 0:102TOP I 0:081TOP F: (9) The correlation coecients and the multiple regres-sion output for the LCV disc-pad pair are given in Tables A.21 and A.22. R square equals 0.986, and 98.6% of the variations in pavg are explained by the independent variables. Eight of the coecients in the regression statistics have P -values less than 5%. Each of the variables (I, a, t, Mavg, F A, avg, TDI, and TDF) is a signicant predictor of pavg. The constant term is 16.186. For each unit of increase in t, Mavg, F A, and TDI in Eq. (10), pavgis predicted to increase by 0.192, 0.0656, 0.001, and 0.0221 units, respectively. For each unit of increase in I, a, avg, and TDF, the average braking pressure decreases with 0.0925, 0.0543, 50.750, and 0.0191 units, respectively. The other independent variables BS and BR are not statistically signicant (Table A.22).
pavg=16:186 0:0925I + 0:192t + 0:0656Mavg 0:0543a + 0:001F A 50:75 + 0:022TDI
0:019TDF: (10)
3.6. Discussion
The friction and wear behaviors of brake's friction materials are mainly aected by factors such as ma-terial characteristics, braking conditions, surrounding conditions, surface conditions, and structural parame-ters [35]. Friction is highly dependent on brake linings' chemical composition, environmental conditions, and operating conditions. The braking pair's model is to correlate the friction coecient to system inputs, such as brake pressure, and to system states such as brake temperature and disc speed [26].
From the information in the literature, the follow-ing points were identied:
In the analyses of both PC and LCV braking pairs, disc nal temperature has been aected positively by brake speed and negatively by pressure and the value. These results partially validate the study results of Verma [36]. The average temperature rise in the contact region due to sliding is directly proportional to the dissipated frictional power, given by the product of the friction coecient, the applied load, and the sliding velocity and is inversely pro-portional to the thermal conductivities of the mating materials [36];
An increase in in the braking pair aects the braking time in the PC negatively and in LCV
positively. Generally, an increase in friction co-ecient reduces braking time. This is probably due to a negative intercept coecient in the LCV-braking time equation and the eects of all other independent variables;
Luo and Yang [37] emphasized that the brake linings must be investigated at dierent pressures, speeds, and temperatures. In addition to the three parameters mentioned, motorway braking check I-II (0.6 g) and fade (maximum 160 bar) I-II (0.4 g) test procedures were carried out at dierent decelera-tions in this study;
Ricciardi et al. [26] stated that the value correlates with braking pressure, brake temperature, and disc speed at brake linings' model. When the correla-tion tables (Table A.7) in the study are examined, brake pressure, disc initial and nal temperatures, brake speed, and release speed coecients of the PC brake pair are determined as 0.359, 0.460, 0.429, 0.0914, and {0.109, respectively. Coecients of the same parameters for the LCV brake pair are determined as {0.484, {0.187, {0.153, {0.421, and 0.356, respectively (Table A.9). The correlation stated by Ricciardi et al. [26] was provided positively by the PC and negatively by the LCV;
Rhee [17] stated that can be dependent upon temperature, load, and sliding velocity. In this study, three additional parameters including braking time, deceleration, and braking torque are added to the list of the other parameters. Further, in the studies [18-21], was found to be dependent on temperature. In this study, eect levels of 6 additional parameters for the PC and 8 additional parameters for the LCV on the friction coecient were determined;
Heussa et al. [21], El-Tayeb and Liew [22], Saar et al. [23], and Liew and Nirmal [24] individually stated that was found to be dependent on braking force and velocity. In this study, the eects of additional 9 parameters were investigated.
4. Conclusions
In this study, two pairs of OEM brake disc-pad were used. One of these pairs belongs to a Passenger Car (PC) and the other one to a Light Commercial Vehicle (LCV). The PC disc-pad pair was subject to the global brake eectiveness test according to SAE J2522 test standard; the other one was subject to the tests according to FIAT 7-H4020 and 7-H2000 standards. For the PC disc-pad pair, 276 braking tests from 21 dierent categories were performed; in addition, for the LCV, a total of 130 braking tests were performed in 2 dierent categories. The basic brake parameters in the tests were measured and recorded. The interrelation of the parameters was analyzed with a multiple regression
method, and eect levels were determined. In this study, dependent variables in the multiple regression method including braking time, friction coecient, disc nal temperature, brake speed, and brake pressure for both PC and LCV were selected. In this analysis of PC disc-pad pair, 13 variables such as friction coecient, avg. braking torque, avg. brake pressure, brake speed, brake release speeds, deceleration, disc initial and nal temperatures, inpad initial and nal temperatures, outpad initial and nal temperatures, and braking time were used; in the regression model of LCV disc-pad pair, 11 variables such as brake speed, brake release speeds, deceleration, inertia, avg. braking torque, avg. brake pressure, uid absorption, disc initial and nal temperatures, friction coecient, and braking time are used. From these analyses, the conclusions below were obtained:
The R square in this study ranges from 0.917 to 0.997. The interpretation is that about 91.7% to 99.7% of the variability in the dependent variables can be explained by variations in the explana-tory/independent variables;
In the literature, 1, 2, or 3 variable approaches are generally used to examine the braking parameters. In this study, the predictor coecients of at least 9 to 11 independent variables in the regression statistics for PC braking pair have P -values less than 5%. Furthermore, the coecients of 7 to 8 independent variables in the regression statistics for LCV braking pair have P -values less than 5%. The statistical signicance of each individual independent variable has been determined;
According to the estimated regression equations for PC, for each unit of increase in deceleration and friction coecient, braking time decreases with 7.3 and 60.9 units, respectively. For each unit of increase in braking time and brake pressure, friction coecient decreases with 0.004 and 0.008 units, respectively. For each unit of increase in friction coecient and outpad initial temperature, disc nal temperature decreases with 514.2 and 7.03 units, respectively. For each unit of increase in friction coecient and deceleration, brake speed increases with 225.8 and 35 units, respectively. For each unit of increase in friction coecient, braking pressure decreases with 112.3 units;
According to the estimated regression equation for LCV, for each unit of increase in brake pressure and friction coecient, braking time increases with 1.267 and 91.887 units, respectively. For each unit of increase in brake pressure, friction coecient decreases with 0.016 units. For each unit of increase in friction coecient and brake pressure, disc nal temperature decreases with 388.2 and 5.219 units,
respectively. For each unit of increase in brake release speed, brake speed decreases with 2.4 units. For each unit of increase in friction coecient, braking pressure decreases with 50.8 units.
Note
Data of the passenger car brake disc-pad pair used in regression analysis are taken from the doctoral thesis by Demir (2009), and from the doctoral thesis by Oz (2012) for the light commercial vehicle.
Nomenclature
D Disc
DV Dependent Variable DV Dummy Variable
F MV SS Federal Motor Vehicle Safety Standards ISO International Organization for
Standardization IV Independent Variable
JASO Japan Automobile Standards Organization
JIS Japanese Industrial Standard LCV Light Commercial Vehicle
O Observation
OEM Original Equipment Manufacturer P C Passenger Car
SAE Society of Automotive Engineers Symbols
" Error term
Hz
Linear function constant Linear function elevation Friction coecient a Deceleration FA Fluid Absor
I Inertia
M Torque
p Pressure
t Braking time
T Temperature
X Independent variable Y Dependent Variable Subscript
avg Average
BR Brake Release speed BS Brake speed
DF Disc Final temperature DI Disc Initial temperature IP F Inpad nal temperature IP I Inpad initial temperature LCV Light Commercial Vehicle n Number (1, 2, 3, ...) OP I Outpad initial temperature OP F Outpad nal temperature p Exploratory variable References
1. Dhir, D.K. \Thermo-mechanical performance of au-tomotive disc brakes", Materials Today: Proceedings, 5(1-1), pp. 1864-1871 (2018).
2. Goktan, A., Guney, A., and Ereke, M. \Vehicle brakes", Alliedsignal Automotive, Panel Publishing, p. 48, Istanbul, Turkey (1995).
3. Demir, A. \An experimental investigation on the brak-ing performance of coated brake discs/rotors", Doc-toral Thesis, Kocaeli University, Institute of Science and Technology, Department of Machine Training, Kocaeli, Turkey (2009).
4. Childs, P.R.N. \Clutches and brakes", Mechanical Design Engineering Handbook, Second Edition, pp. 599-655 (2019).
5. Limpert, R., Brake Design and Safety, Society of Auto-motive Engineers, Third Edition, Warrendale (2001). 6. Bijwe, J., Dureja, N., Majumdarb, N., and Satapathy,
B.K. \Inuence of modied phenolic resins on the fade and recovery behavior of friction materials", Wear, 259(7), pp. 1068-1078 (2005).
7. Lee, K. \Numerical prediction of brake uid temper-ature rise during braking and heat soaking", SAE Technical Paper Series, 1999-01-0483 (1999).
8. Chang, Y.H., Joo, B.S., Lee, S.M., and Jang, H. \Size eect of tire rubber particles on tribological properties of brake friction materials", Wear, 394-395, pp. 80-86 (2018).
9. Owen, C., Automotive Brake Systems, Classroom Manual, Today's Technician, Delmar Cengage Learn-ing (2010).
10. Hiller, M.B. \Correlation between parameters of the tribosystem and automotive disc brake squeal", PhD Thesis, University of Paderborn, pp. 1-203 (2006). 11. Dmitriev, A.I., Yu Smolin, A., Psakhie, S.G., et al.
\Computer modelling of local tribological contact by the example of the automotive brake friction pair", Physical Mesomechanics, 11(1-2), pp. 73-84 (2008). 12. Wu, D., Li, J., Shu, X., et al. \Test analysis and
theoretical calculation on braking distance of automo-bile with ABS", Part IV, International Federation for Information Processing - IFIP AICT 347, D. Li, Y. Liu, and Y. Chen (Eds.): CCTA 2010, pp. 521-527 (2011).
13. BEEP, \How to read and understand the aftermar-ket standard SAE J2430/brake eectiveness evalua-tion procedure test report", Link Testing Laboratories B.E.E.P. Task force (2002).
14. Noon, R.K., Engineering Analysis of Vehicular Acci-dents, ISBN 9780849381041, pp. 1-205, CRC Press, Florida, USA (1994).
15. Nagurnas, S., Mitunevicius, V., Unarski, J., et al. \Evaluation of veracity of car braking parameters used for the analysis of road accidents", Transport, 22(4), pp. 307-311 (2007).
16. Syahrullail, S., Izhan M.I., and Mohammed Raq, A.K. \Tribological investigation of RBD palm olein in dierent sliding speeds using pin-on-disk tribotester", Scientia Iranica, Transactions B: Mechanical Engi-neering, 21(1), pp. 162-170 (2014).
17. Rhee, S.K. \Friction properties of a phenolic resin lled with iron and graphite - sensitivity to load, speed and temperature", Wear, 28(2), pp. 277-281 (1974). 18. Filip, P., Weiss, Z., and Rafaja, D. \On friction layer
formation in polymer matrix composite materials for brake applications", Wear, 252(3), pp. 189-198 (2002). 19. Cho, M.H., Kim, S.J., Kim, D., et al. \Eects of ingredients on tribological characteristics of a brake lining: An experimental case study", Wear, 258(11-12), pp. 1682-1687 (2005).
20. Hong, U.S., Jung, S.L., Cho, K.H., et al. \Wear mech-anism of multiphase friction materials with dierent phenolic resin matrices", Wear, 266(7-8), pp. 739-744 (2009).
21. Heussa, A., Dubar, L., Tison, T., et al. \A methodol-ogy for the modelling of the variability of brake lining surfaces", Wear, 289, pp. 145-159 (2012).
22. El-Tayeb, N.S.M. and Liew, K.W. \On the dry and wet sliding performance of potentially new frictional brake pad materials for automotive industry", Wear, 266(1-2), pp. 275-287 (2009).
23. Saar, A., Shojaei, A., and Arjmand, M. \Theoretical and experimental analysis of the thermal, fade and wear characteristics of rubber-based composite friction materials", Wear, 269(1-2), pp. 145-151 (2010). 24. Liew, K.W. and Nirmal, U. \Frictional performance
evaluation of newly designed brake pad materials", Materials & Design, 48, pp. 25-33 (2013).
25. Rashid, A. \Overview of disc brakes and related phe-nomena - a review", International Journal of Vehicle Noise and Vibration, 10(4), pp. 257-301 (2014). 26. Ricciardi, V., Augsburg, K., Gramstat, S., et al.
\Sur-vey on modelling and techniques for friction estimation in automotive brakes", Appl. Sci., 7(873), Review, pp. 1-23 (2017).
27. Behrendt, J., Weiss, C., and Homann, N. \A numeri-cal study on stick-slip motion of a brake pad in steady sliding", J. Sound Vib., 330, pp. 636-651 (2011).
28. Grkic, A., Muzdeka, S., Arsenic, Z., et al. \Model for estimation of the friction coecient in automotive brakes under extremely high temperatures", Int. J. Eng. Tech. Res., 2, pp. 290-294 (2014).
29. Lee, N. and Kang, C. \The eect of a variable disc pad friction coecient for the mechanical brake system of a railway vehicle", PLoS ONE, 10(8), e0135459 (2015). 30. Carlos, E.A. and Ferro, E. \Technical overview of
brake performance testing for original equipment and aftermarket industries in the US and European mar-kets", Link Technical Report FEV 2005-01, pp. 15-16 (2005).
31. Demir, A., Samur, R., and Kilicaslan, I. \Investigation of the coatings applied onto brake discs on disc-brake pad pair", Metalurgija, 48(3), pp. 161-166 (2009). 32. Oz, A. \Experimental research on reuse of worn brake
discs by coating with powders", PhD Thesis, Suleyman Demirel University, Isparta, Turkey (2012).
33. Newbold, P., Carlson, W.L., and Thorne, BM., Statis-tics for Business and Economics, 8th Ed., ISBN 13: 978-0-13-274565-9, Pearson Education, Prentice Hall (2013).
34. Ataee, O., Moghaddas, N.H., Lashkaripour, G.R., et al. \Predicting shear wave velocity of soil using
multiple linear regression analysis and articial neural networks", Scientia Iranica, 25(4), pp. 1943-1955 (2018).
35. Xiao, X., Yin, Y., Bao, J., et al. \Review on the friction and wear of brake materials", Advances in Mechanical Engineering, 8(5), pp. 1-10 (2016).
36. Verma, P.C. \Automotive brake materials: Charac-terization of wear products and relevant mechanisms at high temperature", Department of Industrial Engi-neering, PhD Thesis, University of Trento, Italy, pp. 1-134 (2016).
37. Luo, Y. and Yang, Z. \Eect of dierent-condition parameters on frictional properties of non-asbestos phenolic resin-based friction material", Advances in Mechanical Engineering, 9(5), Research Article, pp. 1-14 (2017).
Appendix
In this section, some technical information about dy-namometers used in experiments, as well as regression analysis and correlation matrices were included.
Table A.1. Technical specications and measurement parameters of the inertia dynamometer used in the automobile disc-pad pair test.
No Denitions Manufacturer Model Serial no
Full-scale standards
Units Uncertainty (+%FS)
Uncertainty (+Unit)
Full-scale metric
Unit 1 Air velocity RM Young 27105R-2400 jenerator AS17A 55 mph 1.44 0.79 88.55 kph 2 Maximum inertia Link Engineering 68 Slug ft2 0.44 0.30 92.82 kgm2
3 Base inertia 8 Slug ft2 10.20 kgm2
4 Inertia intervals 28 at 2.2 Slug ft2 2.99 kgm2
5 Engine power General motors 100 hp 74.57 kW 6 Pressure Sensotec TJE-0743-03TJG-3000 478656 3,000 psi 0.31 9.33 206.70 bar 7 Angular velocity Sick stegmann DRS25-4F400512 71002439 2,000 rpm 0.29 5.79 2,000.00 rpm 8 Temperature Link engineering 1484 CAQ TL17A 2,400 F 0.54 13.07 1,315.56 C
9 Torque Siebe Lebow 2112-50K 332 4,167 ftlbs 0.34 14.03 5,667.12 Nm
10 Corrosion Mitutoyo C esitli C esitli 1 in 0.34 0.00 2.54 cm 11 Liquid volume Ballu BTL-5-A21-M0102-2-532 FD17 2.4409 in3 0.30% 0.01 40.00 cm3
12 Capacitive prob Capacitec 4008-P115 0.100 in 0.24 0.0002 2,540.00 micron
Table A.2. Specications of the inertia dynamometer used in the light commercial vehicle disc-pad pair test. Technical specication parameters Units Value
Maximum engine revolutions rpm 2,400
Maximum inertia moment kgm2 166
Maximum braking torque Nm 5,000
Max, speed for both directions (hardware limit) rpm 2,400 Max, speed for both directions (software limit) rpm 2,160
Ventilation maximum speed rpm 2,600
Test equipment weight DA.N 13,000
Maximum dynamometer load kgmsq 166
Minimum revolutions stopping engine rpm 20 Hydraulic system power unit pressure limit bar 160 Hydraulic system applicable pressure size bar 150 Hydraulic system pressure alarm limit bar 152
Maximum body movement mm 1,900
Maximum and minimum torque weight Nm 4; 500
Torque meter mechanic accuracy Nm 2:5
Thermocouple temperature range C 0...1000
Thermocouple telemetry channel precision C 3
Pressure transformation scale bar 200
Pressure transformation precision bar 0; 1
Flowmeter ow range l/min 0.004 - 4
Flowmeter precision mm3 10
Ventilation pipe diameter mm 255
Maximum air ow m3/h 2,200
Engine power kW 140
Height mm 2,250
Flywheel N 4
Length mm 6,950
Table A.3. The correlation coecients between independent variables and braking time (for PC). BS
(k/h) BR
(k/h) a (m/s2)
Mavg
(Nm) pavg
(bar) avg TDI
(C)
TDF
(C)
TIP I
(C)
TIP F
(C)
TOP I
(C)
TOP F
(C)
t (s) BS, k/h 1
BR, k/h 0.86474 1
a, m/s2 0.25746 0.02039 1
Mavg, Nm 0.27948 0.06384 0.99566 1
pavg, bar 0.27637 0.09255 0.97251 0.97977 1
avg 0.0914 {0.1094 0.548 0.52566 0.35945 1
TDI,C 0.06749 {0.2759 0.43353 0.39634 0.32349 0.46047 1
TDF,C 0.30583 {0.07 0.50268 0.47278 0.40824 0.42956 0.95515 1
TIP I,C 0.09596 {0.2459 0.43795 0.40235 0.33933 0.41708 0.9914 0.94929 1
TIP F,C 0.09633 {0.2553 0.43222 0.3959 0.32849 0.43057 0.99244 0.94989 0.99905 1
TOP I,C 0.09342 {0.2466 0.43325 0.39784 0.33751 0.40396 0.98776 0.9443 0.99941 0.99786 1
TOP F,C 0.10378 {0.2451 0.42734 0.39192 0.32988 0.40222 0.9896 0.95182 0.99916 0.99861 0.99923 1
Table A.4. Multiple regression model statistics of the factors that contributed to the stopping/braking time (for PC). Regression statistics
Multiple R 0.95796
R square 0.91769
Adjustable R square 0.91393 Standard error 0.73315
Observation 276
ANOVA
df SS MS F Signicance F
Regression 12 1576.03 131.336 244.343 6E-135 Dierence 263 141.365 0.53751
Total 275 1717.4 Coecients Standard
error
t
Stat P -value
Low 95%
High 95%
Low 95.0%
High 95.0% Intersection 29.1689 1.88393 15.483 7.1E-39 25.4593 32.8784 25.4593 32.8784 BS, k/h 0.0596 0.00946 6.29804 1.3E-09 0.04096 0.07823 0.04096 0.07823
BR, k/h {0.06 0.00711 {8.4325 2.3E-15 {0.074 {0.046 {0.074 {0.046
a, m/s2 {7.3079 0.77638 {9.4128 2.5E-18 {8.8366 {5.7791 {8.8366 {5.7791
Mavg, Nm 0.05709 0.00394 14.506 2E-35 0.04934 0.06483 0.04934 0.06483
pavg, bar {0.4543 0.05509 {8.2472 7.8E-15 {0.5628 {0.3458 {0.5628 {0.3458
avg {60.868 6.38996 {9.5256 1.1E-18 {73.45 {48.287 {73.45 {48.287
TDI,C 0.01249 0.00576 2.16807 0.03105 0.00115 0.02383 0.00115 0.02383
TDF,C {0.012 0.00326 {3.698 0.00026 {0.0184 {0.0056 {0.0184 {0.0056
TIP I, C {0.0081 0.0433 {0.1868 0.85194 {0.0933 0.07716 {0.0933 0.07716
TIP F,C 0.00932 0.02481 0.37557 0.70754 {0.0395 0.05816 {0.0395 0.05816
TOP I,C {0.1823 0.04214 {4.325 2.2E-05 {0.2652 {0.0993 {0.2652 {0.0993
TOP F,C 0.1815 0.03403 5.33411 2.1E-07 0.1145 0.24849 0.1145 0.24849
Table A.5. The correlation coecients between independent variables and braking time (for LCV).
I BS
(k/h)
BR
(k/h)
pavg
(bar)
Mavg
(Nm) a
(m/s2) F A avg
TDI
(C)
TDF
(C)
t (s)
I 1
BS, k/h {0.53874 1
BR, k/h 0.515739 {0.82696 1
pavg, bar {0.71998 0.247353 {0.40849 1
Mavg, Nm {0.12483 {0.26334 0.023628 0.563023 1
a, m/s2 {0.81658 0.416691 {0.44359 0.68695 0.373259 1
F A 0.23632 {0.52126 0.274012 0.395285 0.533453 {0.08364 1
avg 0.607629 {0.4212 0.356912 {0.48446 0.423433 {0.3228 0.059694 1
TDI,C {0.085 0.721645 {0.5822 {0.01083 {0.32088 {0.05859 {0.27456 {0.18781 1
TDF,C 0.063896 0.725292 {0.57266 {0.11098 {0.37223 {0.18011 {0.26583 {0.15384 0.951683 1
Table A.6. Multiple regression model statistics of the factors that contributed to the stopping/braking time (for LCV). Regression statistics
Multiple R 0.98186
R square 0.964049
Adjustable R square 0.961028 Standard error 1.583748
Observation 130
ANOVA
df SS MS F Signicance F
Regression 10 8004.082 800.4082 319.1091 6.18E-81 Dierence 119 298.4827 2.508258
Total 129 8302.564 Coecients Standard
error
t
stat P -value
Low 95%
High 95%
Low 95.0%
High 95.0% Intersection {32.6885 5.392565 {6.06177 1.63E-08 {43.3663 {22.0106 {43.3663 {22.0106 I 0.395474 0.04869 8.122278 4.82E-13 0.299063 0.491886 0.299063 0.491886 BS, k/h 0.107291 0.028741 3.733061 0.000292 0.050381 0.164201 0.050381 0.164201
BR, k/h {0.16296 0.278037 {0.58611 0.558909 {0.7135 0.387579 {0.7135 0.387579
pavg, bar 1.267735 0.204418 6.201687 8.36E-09 0.862968 1.672503 0.862968 1.672503
Mavg, Nm {0.14812 0.010935 {13.5453 7.3E-26 {0.16977 {0.12646 {0.16977 {0.12646
a, m/s2 0.204403 0.020655 9.896078 3.28E-17 0.163504 0.245302 0.163504 0.245302 F A 0.003222 0.001272 2.532618 0.012623 0.000703 0.005741 0.000703 0.005741 avg 91.88736 10.11557 9.083757 2.76E-15 71.85753 111.9172 71.85753 111.9172
TDI,C {0.02416 0.012807 {1.88678 0.061627 {0.04952 0.001195 {0.04952 0.001195
TDF,C 0.020328 0.014111 1.44053 0.152343 {0.00761 0.04827 {0.00761 0.04827
Table A.7. The correlation coecients between independent variables and friction coecient (for PC). BS
(k/h) BR
(k/h) t (s)
a (m/s2)
Mavg
(Nm) pavg
(bar) TDI
(C)
TDF
(C)
TIP I
(C)
TIP F
(C)
TOP I
(C)
TOP F
(C) avg
BS, k/h 1
BR, k/h 0.8647 1
t, s {0.231 {0.276 1
a, m/s2 0.2575 0.0204 {0.711 1
Mavg, Nm 0.2795 0.0638 {0.709 0.9957 1
pavg, bar 0.2764 0.0926 {0.72 0.9725 0.9798 1
TDI,C 0.0675 {0.276 {0.015 0.4335 0.3963 0.3235 1
TDF,C 0.3058 {0.07 {0.063 0.5027 0.4728 0.4082 0.9552 1
TIP I,C 0.096 {0.246 {0.024 0.438 0.4023 0.3393 0.9914 0.9493 1
TIP F,C 0.0963 {0.255 {0.008 0.4322 0.3959 0.3285 0.9924 0.9499 0.9991 1
TOP I,C 0.0934 {0.247 {0.022 0.4333 0.3978 0.3375 0.9878 0.9443 0.9994 0.9979 1
TOP F,C 0.1038 {0.245 {0.002 0.4273 0.3919 0.3299 0.9896 0.9518 0.9992 0.9986 0.9992 1
Table A.8. Multiple regression model statistics of the factors that contributed to the friction coecient (for PC). Regression statistics
Multiple R 0.981
R square 0.9624
Adjustable R square 0.9607 Standard error 0.0061
Observation 276
ANOVA
df SS MS F Signicance F
Regression 12 0.2506 0.0209 561.14 1E-179 Dierence 263 0.0098 4E-05
Total 275 0.2604 Coecients Standard
error
t
Stat P -value
Low 95%
High 95%
Low 95.0%
High 95.0% Intersection 0.3381 0.0059 57.055 4E-150 0.3264 0.3497 0.3264 0.3497 BS, k/h 0.0004 8E-05 5.2737 3E-07 0.0003 0.0006 0.0003 0.0006
BR, k/h {3E-04 6E-05 {4.204 4E-05 {4E-04 {1E-04 {4E-04 {1E-04
t, s {0.004 0.0004 {9.526 1E-18 {0.005 {0.003 {0.005 {0.003
a, m/s2 0.0085 0.0075 1.1378 0.2562 {0.006 0.0231 {0.006 0.0231
Mavg, Nm 0.0005 3E-05 15.746 8E-40 0.0004 0.0006 0.0004 0.0006
pavg, bar {0.008 0.0002 {43.19 2E-121 {0.008 {0.007 {0.008 {0.007
TDI,C 0.0004 4E-05 8.2242 9E-15 0.0003 0.0004 0.0003 0.0004
TDF,C {1E-04 3E-05 {3.863 0.0001 {2E-04 {5E-05 {2E-04 {5E-05
TIP I,C {9E-04 0.0004 {2.604 0.0097 {0.002 {2E-04 {0.002 {2E-04
TIP F,C 0.0004 0.0002 1.9767 0.0491 2E-06 0.0008 2E-06 0.0008
TOP I,C 0.001 0.0004 2.8787 0.0043 0.0003 0.0017 0.0003 0.0017
TOP F,C {9E-04 0.0003 {2.901 0.004 {0.001 {3E-04 {0.001 {3E-04
Table A.9. The correlation coecients between independent variables and friction coecient (for LCV).
I BS
(k/h) BR
(k/h) t (s)
pavg
(bar)
Mavg
(Nm) a
(m/s2) F A
TDI
(C)
TDF
(C) avg
I 1
BS, k/h {0.5387 1
BR, k/h 0.51574 {0.827 1
t, s 0.3217 0.45572 {0.2331 1
pavg, bar {0.72 0.24735 {0.4085 {0.6177 1
Mavg, Nm {0.1248 {0.2633 0.02363 {0.7637 0.56302 1
a, m/s2 {0.8166 0.41669 {0.4436 {0.3143 0.68695 0.37326 1
F A 0.23632 {0.5213 0.27401 {0.5021 0.39528 0.53345 {0.0836 1
TDI,C {0.085 0.72165 {0.5822 0.55409 {0.0108 {0.3209 {0.0586 {0.2746 1
TDF,C 0.0639 0.72529 {0.5727 0.65602 {0.111 {0.3722 {0.1801 {0.2658 0.95168 1
Table A.10. Multiple regression model statistics of the factors that contributed to the friction coecient (for LCV). Regression statistics
Multiple R 0.992189
R square 0.984439
Adjustable R square 0.983132 Standard error 0.011029
Observation 130
ANOVA
df SS MS F Signicance F
Regression 10 0.915772 0.091577 752.8396 1.5E-102 Dierence 119 0.014475 0.000122
Total 129 0.930248 Coecients Standard
error
t
stat P -value
Low 95%
High 95%
Low 95.0%
High 95.0% Intersection 0.289506 0.033785 8.569083 4.44E-14 0.222609 0.356404 0.222609 0.356404 I {0.00099 0.000413 {2.40528 0.0177 {0.00181 {0.00018 {0.00181 {0.00018 BS, k/h 0.000147 0.000211 0.695873 0.487865 {0.00027 0.000565 {0.00027 0.000565
BR, k/h {0.00055 0.001938 {0.28231 0.778193 {0.00439 0.003291 {0.00439 0.003291
t, s 0.004456 0.000491 9.083757 2.76E-15 0.003485 0.005428 0.003485 0.005428 pavg, bar {0.01619 0.000691 {23.4308 2.12E-46 {0.01756 {0.01483 {0.01756 {0.01483
Mavg, Nm 0.001279 3.16E-05 40.41932 2.36E-71 0.001216 0.001341 0.001216 0.001341
a, m/s2 {0.00118 0.000162 {7.28234 3.87E-11 {0.0015 {0.00086 {0.0015 {0.00086
F A {1.2E-05 9.03E-06 {1.29634 0.197367 {3E-05 6.18E-06 {3E-05 6.18E-06 TDI,C 0.000499 7.81E-05 6.395335 3.28E-09 0.000345 0.000654 0.000345 0.000654
TDF,C {0.00045 9E-05 {5.04478 1.65E-06 {0.00063 {0.00028 {0.00063 {0.00028
Table A.11. The correlation coecients between independent variables and disc nal temperature (For PC). BS
(k/h) BR
(k/h) t (s)
a (m/s2)
Mavg
(Nm) pavg
(bar) avg TDI
(C)
TIP I
(C)
TIP F
(C)
TOP I
(C)
TOP F
(C)
TDF
(C)
BS, k/h 1
BR, k/h 0.8647 1
t, s {0.231 {0.276 1
a, m/s2 0.2575 0.0204 {0.711 1
Mavg, Nm 0.2795 0.0638 {0.709 0.9957 1
pavg, bar 0.2764 0.0926 {0.72 0.9725 0.9798 1
avg 0.0914 {0.109 {0.427 0.548 0.5257 0.3594 1
TDI,C 0.0675 {0.276 {0.015 0.4335 0.3963 0.3235 0.4605 1
TIP I,C 0.096 {0.246 {0.024 0.438 0.4023 0.3393 0.4171 0.9914 1
TIP F,C 0.0963 {0.255 {0.008 0.4322 0.3959 0.3285 0.4306 0.9924 0.9991 1
TOP I,C 0.0934 {0.247 {0.022 0.4333 0.3978 0.3375 0.404 0.9878 0.9994 0.9979 1
TOP F,C 0.1038 {0.245 {0.002 0.4273 0.3919 0.3299 0.4022 0.9896 0.9992 0.9986 0.9992 1
Table A.12. Multiple regression model statistics of the factors that contributed to disc nal temperature (for PC). Regression statistics
Multiple R 0.99517
R square 0.99037
Adjustable R square 0.98993 Standard error 13.5391
Observation 276
ANOVA
df SS MS F Signicance F
Regression 12 4955552 412963 2252.84 3E-257 Dierence 263 48209.8 183.307
Total 275 5003762 Coecients Standard
error
t
stat P -value
Low 95%
High 95%
Low 95.0%
High 95.0% Intersection 149.972 47.2031 3.17716 0.00166 57.0276 242.916 57.0276 242.916 BS, k/h 1.54922 0.1613 9.60479 6.4E-19 1.23162 1.86682 1.23162 1.86682
BR, k/h {0.60234 0.14332 {4.20262 3.6E-05 {0.88455 {0.32013 {0.88455 {0.32013
t, s {4.10558 1.11023 {3.69796 0.00026 {6.29165 {1.91952 {6.29165 {1.91952 a, m/s2 7.14833 16.5715 0.43136 0.66656 {25.4814 39.7781 {25.4814 39.7781
Mavg, Nm 0.26013 0.09618 2.7048 0.00728 0.07076 0.4495 0.07076 0.4495
pavg, bar {4.0108 1.11414 {3.5999 0.00038 {6.20457 {1.81703 {6.20457 {1.81703
avg {514.234 133.13 {3.86264 0.00014 {776.37 {252.097 {776.37 {252.097
TDI,C 0.93568 0.09051 10.3376 3E-21 0.75746 1.11391 0.75746 1.11391
TIP I,C 4.69961 0.74522 6.30632 1.2E-09 3.23225 6.16698 3.23225 6.16698
TIP F,C {3.77634 0.39468 {9.56804 8.4E-19 {4.55348 {2.9992 {4.55348 {2.9992
TOP I,C {7.03853 0.67849 {10.3738 2.3E-21 {8.37449 {5.70257 {8.37449 {5.70257
TOP F,C 6.09007 0.54454 11.1839 5.2E-24 5.01786 7.16227 5.01786 7.16227
Table A.13. The correlation coecients between independent variables and disc nal temperature (for LCV).
I BS
(k/h)
BR
(k/h) t (s)
pavg
(bar)
Mavg
(Nm) a
(m/s2) F A avg (TDIC)
TDF
(C)
I 1
BS, k/h {0.53874 1
BR, k/h 0.51574 {0.82696 1
t, s 0.3217 0.45572 {0.23309 1
pavg, bar {0.71998 0.24735 {0.40849 {0.61766 1
Mavg, Nm {0.12483 {0.26334 0.02363 {0.76367 0.56302 1
a, m/s2 {0.81658 0.41669 {0.44359 {0.31432 0.68695 0.37326 1
F A 0.23632 {0.52126 0.27401 {0.5021 0.39528 0.53345 {0.08364 1
avg 0.60763 {0.4212 0.35691 {0.03842 {0.48446 0.42343 {0.3228 0.05969 1
TDI,C {0.085 0.72165 {0.5822 0.55409 {0.01083 {0.32088 {0.05859 {0.27456 {0.18781 1
Table A.14. Multiple regression model statistics of the factors that contributed to disc nal temperature (for LCV). Regression statistics
Multiple R 0.994744
R square 0.989515
Adjustable R square 0.988634 Standard error 10.1997
Observation 130
ANOVA
df SS MS F Signicance F
Regression 10 1168328 116832.8 1123.027 9.9E-113 Dierence 119 12380.03 104.0339
Total 129 1180708 Coecients Standard
error
t
stat P -value
Low 95%
High 95%
Low 95.0%
High 95.0% Intersection {119.027 38.20344 {3.11562 0.002301 {194.674 {43.3807 {194.674 {43.3807 I 2.0512 0.342761 5.984351 2.35E-08 1.3725 2.729901 1.3725 2.729901 BS, k/h 1.651812 0.123874 13.33464 2.26E-25 1.40653 1.897095 1.40653 1.897095
BR, k/h 0.673467 1.792139 0.37579 0.707742 {2.87515 4.222081 {2.87515 4.222081
t, s 0.843133 0.585294 1.44053 0.152343 {0.31581 2.002073 {0.31581 2.002073 pavg, bar {5.21942 1.436801 {3.63266 0.000415 {8.06443 {2.37441 {8.06443 {2.37441
Mavg, Nm 0.423476 0.105351 4.019661 0.000103 0.21487 0.632081 0.21487 0.632081
a, m/s2 {0.95167 0.156992 {6.06186 1.63E-08 {1.26253 {0.64081 {1.26253 {0.64081
F A 0.019543 0.008218 2.377933 0.019003 0.00327 0.035816 0.00327 0.035816 avg {388.176 76.94604 {5.04478 1.65E-06 {540.537 {235.815 {540.537 {235.815
TDI,C 0.865545 0.026665 32.45975 5.83E-61 0.812746 0.918345 0.812746 0.918345
Table A.15. The correlation coecients between independent variables and brake speed (for PC). BR
(k/h) t (s)
a (m/s2)
Mavg
(Nm) pavg
(bar) avg TDI
(C)
TDF
(C)
TIP I
(C)
TIP F
(C)
TOP I
(C)
TOP F
(C)
BS
(k/h) BR, k/h 1
t, s {0.276 1
a, m/s2 0.0204 {0.711 1
Mavg, Nm 0.0638 {0.709 0.9957 1
pavg, bar 0.0926 {0.72 0.9725 0.9798 1
avg {0.109 {0.427 0.548 0.5257 0.3594 1
TDI,C {0.276 {0.015 0.4335 0.3963 0.3235 0.4605 1
TDF,C {0.07 {0.063 0.5027 0.4728 0.4082 0.4296 0.9552 1
TIP I,C {0.246 {0.024 0.438 0.4023 0.3393 0.4171 0.9914 0.9493 1
TIP F,C {0.255 {0.008 0.4322 0.3959 0.3285 0.4306 0.9924 0.9499 0.9991 1
TOP I,C {0.247 {0.022 0.4333 0.3978 0.3375 0.404 0.9878 0.9443 0.9994 0.9979 1
TOP F,C {0.245 {0.002 0.4273 0.3919 0.3299 0.4022 0.9896 0.9518 0.9992 0.9986 0.9992 1
Table A.16. Multiple regression model statistics of the factors that contributed to brake speed (for PC). Regression statistics
Multiple R 0.986615
R square 0.97341
Adjustable R square 0.972196 Standard error 4.453452
Observation 276
ANOVA
df SS MS F Signicance F
Regression 12 190949.7 15912.47 802.3133 2.3E-199 Dierence 263 5216.141 19.83324
Total 275 196165.8 Coecients Standard
error
t
stat P -value
Low 95%
High 95%
Low 95.0%
High 95.0% Intersection {78.1101 15.07086 {5.18286 4.36E-07 {107.785 {48.4352 {107.785 {48.4352 BR, k/h 0.730576 0.018504 39.48298 1.5E-112 0.694142 0.76701 0.694142 0.76701
t, s 2.199016 0.349159 6.298038 1.26E-09 1.511513 2.886518 1.511513 2.886518 a, m/s2 35.01316 5.007219 6.992536 2.23E-11 25.15382 44.87249 25.15382 44.87249
Mavg, Nm {0.26449 0.027616 {9.5774 7.83E-19 {0.31886 {0.21011 {0.31886 {0.21011
pavg, bar 1.914492 0.356352 5.372471 1.71E-07 1.212825 2.616158 1.212825 2.616158
avg 225.7637 42.8092 5.273718 2.79E-07 141.4713 310.0561 141.4713 310.0561
TDI,C {0.25524 0.031605 {8.07606 2.42E-14 {0.31747 {0.19301 {0.31747 {0.19301
TDF,C 0.16762 0.017452 9.604791 6.43E-19 0.133257 0.201983 0.133257 0.201983
TIP I,C {1.72456 0.240553 {7.16914 7.63E-12 {2.19821 {1.2509 {2.19821 {1.2509
TIP F,C 1.275339 0.128595 9.917485 6.69E-20 1.022132 1.528545 1.022132 1.528545
TOP I,C 0.473436 0.263319 1.797955 0.073331 {0.04505 0.991917 {0.04505 0.991917
TOP F,C 0.121407 0.21745 0.558322 0.577099 {0.30676 0.549573 {0.30676 0.549573
Table A.17. The correlation coecients between independent variables and brake speed (for LCV).
I BR
(k/h) t (s)
pavg
(bar)
Mavg
(Nm) a
(m/s2) F A avg (TDIC)
TDF
(C)
BS
(k/h)
I 1
BR, k/h 0.51574 1
t, s 0.3217 {0.2331 1
pavg, bar {0.72 {0.4085 {0.6177 1
Mavg, Nm {0.1248 0.02363 {0.7637 0.56302 1
a, m/s2 {0.8166 {0.4436 {0.3143 0.68695 0.37326 1
F A 0.23632 0.27401 {0.5021 0.39528 0.53345 {0.0836 1
avg 0.60763 0.35691 {0.0384 {0.4845 0.42343 {0.3228 0.05969 1
TDI,C {0.085 {0.5822 0.55409 {0.0108 {0.3209 {0.0586 {0.2746 {0.1878 1
TDF,C 0.0639 {0.5727 0.65602 {0.111 {0.3722 {0.1801 {0.2658 {0.1538 0.95168 1
Table A.18. Multiple regression model statistics of the factors that contributed to the brake speed (for LCV). Regression statistics
Multiple R 0.988557
R square 0.977245
Adjustable R square 0.975333 Standard error 4.779327
Observation 130
ANOVA
df SS MS F Signicance F
Regression 10 116736.8 11673.68 511.0629 9.9E-93 Dierence 119 2718.194 22.84197
Total 129 119455 Coecients Standard
error
t
stat P -value
Low 95%
High 95%
Low 95.0%
High 95.0% Intersection 130.1191 14.29389 9.103124 2.48E-15 101.8157 158.4224 101.8157 158.4224 I {1.27612 0.140974 {9.05215 3.28E-15 {1.55526 {0.99697 {1.55526 {0.99697 BR, k/h {2.39205 0.811133 {2.94902 0.003839 {3.99817 {0.78592 {3.99817 {0.78592
t, s 0.977068 0.261734 3.733061 0.000292 0.458809 1.495327 0.458809 1.495327 pavg, bar 0.595826 0.707493 0.842166 0.401384 {0.80508 1.996732 {0.80508 1.996732
Mavg, Nm 0.020714 0.052575 0.393986 0.694296 {0.08339 0.124818 {0.08339 0.124818
a, m/s2 0.190521 0.082325 2.314246 0.022369 0.027509 0.353534 0.027509 0.353534
F A {0.0198 0.003499 {5.65948 1.07E-07 {0.02673 {0.01287 {0.02673 {0.01287 avg 27.58663 39.64322 0.695873 0.487865 {50.9109 106.0842 {50.9109 106.0842
TDI,C {0.26623 0.030705 {8.67055 2.58E-14 {0.32703 {0.20543 {0.32703 {0.20543
TDF,C 0.362677 0.027198 13.33464 2.26E-25 0.308822 0.416531 0.308822 0.416531
Table A.19. The correlation coecients between independent variables and average braking pressure (for PC). BS
(k/h) BS
(k/h) t (s)
a (m/s2)
Mavg
(Nm) avg TDI
(C)
TDF
(C)
TIP I
(C)
TIP F
(C)
TOP I
(C)
TOP F
(C)
pavg
(bar BS, k/h 1
BR, k/h 0.8647 1
t, s {0.2314 {0.2764 1
a, m/s2 0.2575 0.0204 {0.7113 1
Mavg, Nm 0.2795 0.0638 {0.7091 0.9957 1
avg 0.0914 {0.1094 {0.4268 0.548 0.5257 1
TDI,C 0.0675 {0.2759 {0.0146 0.4335 0.3963 0.4605 1
TDF,C 0.3058 {0.07 {0.0628 0.5027 0.4728 0.4296 0.9552 1
TIP I,C 0.096 {0.2459 {0.0242 0.438 0.4023 0.4171 0.9914 0.9493 1
TIP F,C 0.0963 {0.2553 {0.0075 0.4322 0.3959 0.4306 0.9924 0.9499 0.9991 1
TOP I,C 0.0934 {0.2466 {0.0221 0.4333 0.3978 0.404 0.9878 0.9443 0.9994 0.9979 1
TOP F,C 0.1038 {0.2451 {0.0018 0.4273 0.3919 0.4022 0.9896 0.9518 0.9992 0.9986 0.9992 1
Table A.20. Multiple regression model statistics of the factors that contributed to average braking pressure (for PC). Regression statistics
Multiple R 0.9987
R square 0.9974
Adjustable R square 0.9973 Standard error 0.7315
Observation 276
ANOVA
df SS MS F Signicance F
Regression 12 53554 4462.8 8339.7 0 Dierence 263 140.74 0.5351
Total 275 53694 Coecients Standard
error
t
stat P -value
Low 95%
High 95%
Low 95.0%
High 95.0% Intersection 38.016 1.1221 33.879 6E-98 35.806 40.225 35.806 40.225 BS, k/h 0.0517 0.0096 5.3725 2E-07 0.0327 0.0706 0.0327 0.0706
BR, k/h {0.0347 0.0077 {4.4995 1E-05 {0.0499 {0.0195 {0.0499 {0.0195
t, s {0.4523 0.0548 {8.2472 8E-15 {0.5603 {0.3443 {0.5603 {0.3443 a, m/s2 1.3339 0.8919 1.4956 0.136 {0.4222 3.0901 {0.4222 3.0901
Mavg, Nm 0.0622 0.0036 17.222 5E-45 0.0551 0.0693 0.0551 0.0693
avg {112.26 2.5994 {43.188 2E-121 {117.38 {107.14 {117.38 {107.14
TDI,C 0.034 0.0054 6.2958 1E-09 0.0234 0.0447 0.0234 0.0447
TDF,C {0.0117 0.0033 {3.5999 0.0004 {0.0181 {0.0053 {0.0181 {0.0053
TIP I,C {0.0395 0.0431 {0.9148 0.3611 {0.1244 0.0455 {0.1244 0.0455
TIP F,C {0.0121 0.0247 {0.49 0.6245 {0.0609 0.0366 {0.0609 0.0366
TOP I,C 0.1019 0.0431 2.3673 0.0186 0.0172 0.1867 0.0172 0.1867
TOP F,C {0.0814 0.0354 {2.3013 0.0222 {0.1511 {0.0118 {0.1511 {0.0118
Table A.21. The correlation coecients between independent variables and average braking pressure (for LCV).
I BS
(k/h) BR
(k/h) t (s)
Mavg
(Nm) a
(m/s2) F A avg
TDI
(C)
TDF
(C)
pavg
(bar)
I 1
BS, k/h {0.5387 1
BR, k/h 0.51574 {0.827 1
t, s 0.3217 0.45572 {0.2331 1
Mavg, Nm {0.1248 {0.2633 0.02363 {0.7637 1
a, m/s2 {0.8166 0.41669 {0.4436 {0.3143 0.37326 1
F A 0.23632 {0.5213 0.27401 {0.5021 0.53345 {0.0836 1
avg 0.60763 {0.4212 0.35691 {0.0384 0.42343 {0.3228 0.05969 1
TDI,C {0.085 0.72165 {0.5822 0.55409 {0.3209 {0.0586 {0.2746 {0.1878 1
TDF,C 0.0639 0.72529 {0.5727 0.65602 {0.3722 {0.1801 {0.2658 {0.1538 0.95168 1
Table A.22. Multiple regression model statistics of the factors that contributed to average braking pressure (for LCV). Regression statistics
Multiple R 0.993268
R square 0.986581
Adjustable R square 0.985454 Standard error 0.61742
Observation 130
ANOVA
df SS MS F Signicance F
Regression 10 3335.259 333.5259 874.9183 2.3E-106 Dierence 119 45.36376 0.381208
Total 129 3380.623 Coecients Standard
error
t
stat P -value
Low 95%
High 95%
Low 95.0%
High 95.0% Intersection 16.18699 1.892729 8.5522 4.87E-14 12.4392 19.93478 12.4392 19.93478 I {0.09253 0.022093 {4.18834 5.42E-05 {0.13628 {0.04879 {0.13628 {0.04879 BS, k/h 0.009944 0.011807 0.842166 0.401384 {0.01344 0.033323 {0.01344 0.033323
BR, k/h {0.11271 0.108055 {1.04312 0.299009 {0.32667 0.101246 {0.32667 0.101246
t, s 0.192672 0.031068 6.201687 8.36E-09 0.131155 0.254189 0.131155 0.254189 Mavg, Nm 0.065653 0.003158 20.79209 1.98E-41 0.0594 0.071905 0.0594 0.071905
a, m/s2 {0.05438 0.009662 {5.62858 1.23E-07 {0.07351 {0.03525 {0.07351 {0.03525
F A 0.001019 0.000501 2.036694 0.0439 2.83E-05 0.002011 2.83E-05 0.002011 avg {50.7501 2.165956 {23.4308 2.12E-46 {55.0389 {46.4613 {55.0389 {46.4613
TDI,C 0.022117 0.004644 4.762815 5.44E-06 0.012922 0.031312 0.012922 0.031312
TDF,C {0.01913 0.005265 {3.63266 0.000415 {0.02955 {0.0087 {0.02955 {0.0087 Biographies
Abdullah Demir was born in Trabzon, Turkey in 1973. He received an MS degree from Marmara University in 1997 and PhD degree from Kocaeli University in 2009. He is now an Assistant Professor at the Mechanical Engineering Department of Marmara University. His research interests include power-train, vehicle test technique, transportation, and car-parking management.
Ali Oz was born in Pozanti, Turkey in 1969. He completed his undergraduate education at Gazi Uni-versity in 1993. He received his MS degree in 1997 and PhD degree in 2012 from Suleyman Demirel University, Turkey. He is currently an Assistant Professor at the Transportation Technologies Department of Mehmet Akif Ersoy University. His research interests include internal combustion engines, renewable energy, and occupational health and safety.