ABSTRACT
CHARLES E. MAPLES. Survey Of Tritium In Soil In An Assessment Of A
University Low-Level Radioactive Waste Facility. (Under The Direction
of Dr. DOUBLAS CRAWFORD-BROWN)Soil samples from two low-level radioactive waste facilities
belonging to the University of North Carolina at Chapel Hill were
evaluated for their tritium content. The interstitial soil water
and associated tritium activity was separated from the soil by
distillation at high temperatures. Condensed water from the soil
samples was then counted in a liquid scintillation counter. At
the Horace Williams Airport site, no detectable tritium activity
was found. At the Mason Farm site, no tritium activity was found
off site but trace amounts (less than 30 pCi/g of soil) were found
in soil between individual burial pits inside the site
boundaries. Soil sampled from the pits at the Mason Farm site had
TABLE OF CONTENTS
111
Title
Abstract . . . .
Table of Contents
List of Figures and Tables
Acknowledgements
Section I Introduction Section II Data Sources
2.1 Personal Conversations .
2.2 Airport Site Burial Records
2.3 Mason Farm Site Burial Records
Section III Tritium , ...
3.1 Tritium Properties .
3.2 Tritium as an Assessment Tool
Section IV Methodology ....
4.1 Method of Site Surveys
4.2 Method of Tritium Extraction and Counti
4.3 Calculations
Section V Physical Observations
5.1 Airport Site Observations
5.2 Mason Farm Site Observations
Section VI Results of Soil Analysis
6.1 Airport Site Results
6.2 Mason Farm Site Results .
Section VII Summary and Conclusions
7.1 Summary for the Airport Site
7.2 Summary for the Mason Farm Si
7.3 Closing Statements .
References . . , . . .
Appendix A - Burials at the Airport Site
Appendix B - Burials at the Mason Farm Site
Appendix C - Airport Site Sample Results
Appendix D - Mason Farm Site Sample Results
XV
FIGURES
Map Showing Location of The Two UNC Burial Sites . . . .2
Scale Drawing of Airport Site With Position of Steel Pegs . . 6
Relative Position of Mason Farm Burial Pits Based On Scaled Map . 9
Estimated Number and Position of Mason Farm Burial Pits. . . 11
Airport Site Drawing Showing Position of Sample Holes . . .19
Mason Farm Site Drawing Showing Position of Sample Holes . . 20
Graph of Recovery Efficiency For Tritium Extraction Process . . 24
Quench Curve As Calculated By The Liquid Scintillation Counter . 26
Activity by Depth for Series 11 to 14 Sample Hole . . . .28
Diagram of Volume For Calculated Activity in Pit #30 . . .31
Effect of Burial Pits On Water Table Levels at Mason Farm . . 37
TABLES
List of Radionuclides Buried at the Airport Site . . . .7
ACKNOULEDGEMENTS
I would like to thank Dr. Douglas Crawford-Brown for helping in
this project. I am very grateful to Dr. James E. Watson for his moral
support as well as securing the traineeship that allowed me to come
here. Dr. Donald Uillhoit allowed me to have complete access to the
Health and Safety Office, and for that I am very thankful.
A special thanks goes to Bob Wilson, RSO at the Health and Safety
Office. He took time out of his busy schedule almost daily to assist me
in this project.
Section I
INTRODUCTION
In past years, many institutions maintained their own burial site
for the disposal of their low-level radioactive waste. The University
of North Carolina has two such waste sites. One site is located on
University property known as Horace Williams Airport. The other is
located on University property known as Mason Farm. Figure 1 shows the
location of these sites in relationship to Chapel Hill, North Carolina.
As the understanding of the consequences of low-level radioactive
waste burials has increased over the years, it has become increasingly
important to examine these sites. Many such sites have allowed movement
of the buried radionuclides into the soil and groundwater around the
sites. This movement brings with it a concern for public health in
areas surrounding the sites.
In this study, an examination of tritium migration will be made in
the assessment of the University's two low-level radioactive waste
(LLRW) burial sites. In the examination, it will be necessary to
determine what was buried, the quantities buried, as well as how it was
CHAPEL
J/
7
J
Farm
Figure 1
Location of the two LLRW sites belonging to
the University of North Carolina at Chapel Hill
SCALE :
Section II
DATA SOURCES
There were two different sources of data used in the preliminary
investigation into the two LLRW sites. The first was a series of
personal conversations (8)13) with people who were associated with the
burials. The second source was written burial records which includedsome Radiation Safety Office Annual Reports (9).
There were a few problems associated with each method, since these
burials were made from 19 to H8 years ago. Over the years the burial
sites were used? different people were responsible for the management
of records and the disposal process itself. The records on file (9)
show the differing methods used for record keeping by different people.
Some methods were not as detailed as others, leaving blanks in the
retrievable data. There were also blanks and gray areas in the
memories of people associated (8,13) with the burials.
8.1 Personal Conversations
An attempt was made to get information from people who had
participated in the burials. Two people were very helpful. They were:
Ray Pfleger, Radiation Safety Officer from 1961 to 1965 and Kay
Slaughter, Radiation Technician from 1968 to the end of the burial
method of burial was obtained. Also? information on some of the forms
of materials that were buried was received from these sources.
It was learned that a backhoe was used to dig the pits in both
sites (8). When the backhoe finished digging a pit for that days
burial) it was removed. A waste collection vehicle was then backed to
the pit and the waste was thrown or pushed in. There were usually no
special containers used for the waste (13). Sometimes glass containers
(such as scintillation vials or gallon jugs) were broken as they were
thrown in. Other times they remained intact. Some vials were placed in
cardboard boxes that held up to 8 flats (800 vials), some individually
tossed in. In latter years at the Mason Farm Site, some plastic jugs
were used for a portion of the liquid waste.
Dry waste was treated in much the same manner. It was often
thrown into the pits in plastic collection bags or in cardboard boxes.
Often there was no special care taken to see that the bags remained
sealed when placed in the pits. Dry waste included rubber gloves, empty
vials, paper, hyperdermic needles, etc.
Animals were buried at both sites. This continued for all but the
last couple of years of operations. These carcasses were usually
wrapped in plastic, but the plastic would sometimes be torn in the
transportation and burial process. These animals included mice, rats,
cats, pigs, sheep, and dogs. Also buried was their bedding and waste.
The depth of the burial depended on the amount to be buried: the
more waste, the deeper the hole. The pits varied from 5 feet to over 8
feet in depth. This seemed to be a problem at the Mason Farm Site as
S feet or more of water in the pit before the waste was thrown in.
S.a Airport Site Burial Records
The Airport Site is the smaller of the two burial sites. This site
was in use from May, 1961 through July, 1963. The fence surrounding the
site measures 20 feet by 30 feet. The records (9) show seven burials
were made in this area (Appendix A). The records do not show the
relationship of the location of an individual pit to a burial date.
The individual pits were marked by steel pegs on the corners
(Figure E). They all vary in length and width. The pits were as close
as six inches apart, with some pits using a common corner peg. Their
depth was determined by the then current guide to burial of carbon-1^
(IE), which gave a recommended depth of h feet of compacted soil on top
of the waste.
From Appendix A, a list of radionuclides with remaining activity
can be determined (Table 1). The original buried activity in this site
was approximately 40 mCi. Of this activity, 35*/. was carbon-14 and
tritium. The total remaining activity after radioactive decay cannot be
precisely determined. Some nuclides were listed together in burial
records. Appendix A shows this co-listing. One burial lists chlorine-36
and carbon-14 as one radionuclide and another burial lists carbon-14
• •
30 feet
gate
20 feet
Table 1
Radionuclides Buried at the Airport Site
Nuclide T'^
Type Decay
ProductAmt Deposited
Amt Remaining
Buried <mCi) as of 5/1/89
Ba-133
7.Ey
€,T stable 0.E75 0,044C-1^
5730y
(3 stable 5.969 5.950C-14/H-3* 5730y
ll/d stable 2.000 1.993Ca-^5 163d a stable 6.900 0.000
Ce-1^1 3E.5d li stable 1X10-* 0.000
CI-36
3X10=y
(3 stable 0.053 0.053Cl-36/*
3X10=y
(J//J stable 0.020 0.020C-1^
Cr-51 27.8d € stable 0.178 0.000
Cs-134
E.ly
(5,T stable 0.290 0.000Fe-55
S.4y
e stable 0.100 0.000H-3
lE.3y
(J stable 5.890 1.361Hq-203
^6.6d (S stable 0.010 0.0001-131 8.Id (3 stable 6.062 0.000
Na-ES
S.6y
(J+»T stable 2.320 0.002P-3E 1^.3d (3 stable ^.662 0.000
Pm-1^7
S.6y
(J,T Sm-1^7** 5.000 0.004Se-75 lS0d € stable 0.040 0.000
Sr-85 65d € stable 0.010 0.000
* When two radionuclides were buried without distinction of amounts of
each, the longer half-life of the two was used for calculations.
** Sm-147 is a naturally occuring isotope with a half-life of
1 X 1( years
the activity of Sm-147 would be 1.21 X 10-"' mCi after all of the
8
The ratio of carbon-l^ to tritium cannot be determined. This is
because of the one co-listing of the two radionuclides. Those burials
that list the two separately show a 4 to 1 ratio, carbon-1^ to tritium.
Records of this site were not as complete as they were of the
Mason Farm site. Log books (9) of incoming material were not kept
untill 1966. There was no way to check the types and quantities of
materials that may have been buried at the Airport site. Records that
are available do show that the site was no longer used after the Mason
Farm site was established. The exact beginning date of the Airport site
is of question.
S.3 Nason Far* Site Burial Records
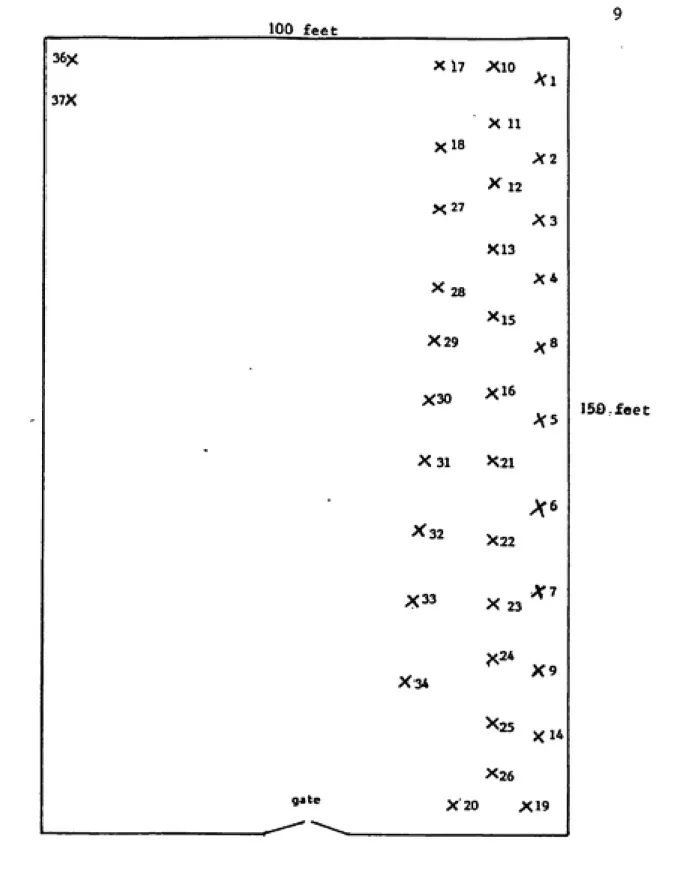
The Mason Farm site is the larger of the two sites. The fenced
area measures 100 feet by 150 feet. In the site are 5S to 56 (or more)
individual burial pits (Appendix B). This site was used from November,
1963 to 1970 (the exact month of the final burial is not clear). A
drawing of this site can be seen in Figure 3. This site is also in the
flood pool of Jordan Lake (S).
There is some confusion as to the exact number of burials at this
site. There is a scaled map showing the location of the first 36
burials (Figure 3 is a scale drawing of this map). A rough hand drawing
of the site indicates 56 burials, while a detailed listing of burials
stops at 52. Burial 5S was listed as November, 1968. There are
references in Radiation Safety Office Annual Reports that burials
100 feet
36X
X 17
XlO .
>fl
37X
X 11
Xl8
X2
X12
X27X3
X13
^ 28
X4
Xl5
X29^«
X30
X16
>C5
X31 X21
X32
X22
X33
X23A'7
X34
X9
X26
gate
X 20 X19
,_---^ "--^^
150 feet
FIGURE 3 : Relative position of the Mason Farm pits
based on a scale drawing on file.
X - center of a pit
numbers are the burial number on record
10
buried through June, 1970. Figure 4 shows a probable location pattern
of additional pits, assuming this additional 7S2 mCi is correct. This
pattern is based on the burial pattern of the scaled drawing, the
pattern given in the rough hand drawing, the pits with visible top
subsidence, and the probable number of monthly burials from November,
1968 to June, 1970.
This site used the standards set by the state of North Carolina as
an agreement state (7). The pits were at least 6 feet apart and covered
by at least 4 feet of compacted earth. As in the Airport site, the pits
varied in length and width as well as depth, depending on amounts to be
buried. There were no pegs or other markings on the surface to show
individual pit locations.
The types and amounts of radionuclides buried can be seen in
Table 2. The total activity buried at this site was approximately 1.16
Ci (this does not include the 722 mCi of unlisted burials). The
remaining activity after decay, as of May, 1989, is approximately 331
mCi. Of this remaining activity, 99.9*/. is carbon-1^ and tritium.
Looking at the total remaining activity of tritium and carbon-14, the
ratio of tritium to carbon-1^ is 1.7 to 1.
For this study, it is assumed the unlisted burials are of the same
types of materials and at the same ratios as the knowns. A search
through the log books <9) on record show no unusual shipments of
radionuclides during this period. Of the total quantity given in the
original burials, carbon-l^t comprised 10.5*/. while tritium made up
67.6*/.. By applying these percentages to the additional 722 mCi, there
11 -xse \37 X38? "XSQ? -/.AO?
^41?
47? X48? X49? X 50? 51?^ 52?
X42?^53?
X43? ͣ ^44? ^56?ͣ
^55?
>C45?
X 54?
Jf46?
•X
XX7Xio
XI
*%
Xn
Xl8X2
*x
X12X27
•^^.X
X13X28
X*
X
Xi5 ??x ^29 X8>C30
X 16?? X
^5
»x
gate
X 31 X 21
X32
X34
X22
X33 ^
23r24
X25
.26X6
X7 X9Xi4
X20 X19FIGURE 4 : Estimated number and position of Mason Farm
burial pits. Pits 1-37 from scale drawing.
Pits 38-56 (?) from hand drawing in burial
log book. Exact position is unknown. Pits
listed as * are estimated from additional
burials . ?? are two pits that can be seen
12
Table S
Radionuclides Buried at the Mason Farm Site
Nuclide Vi
Type Decay
ProductAmt Deposited
Amt Remaining
Buried (mCi) as of 5/1/89
Ag-110
253d |2»T stable 0.026 0.000Au-198 2.7d |3,T stable 11.145 0.000
Ba-133
7.2y
€,T stable 0.070 0.008C-14
5730y
<i stable 121.892' 121.597
Ca-^5 163d (S stable 4.585 0.000
Cd-115 44.Id (3,T In-115** 0.015 0.000
Ce-141/* 32.5d/ (i,T/ stable/ 3X10--'* 0.000 -l'^^ 284.4d (J.T stable
CI-36
SXlO^y
{i stable 0.157 0.157Co-60
5.3y
(i,T stable 0.278 0.012Cr-51 27. Bd G stable 45.884 0.000
Cs-13^
2.1y
|S,T stable 0.077 0.000Cs-137
30.2y
|2,T stable 0.100 0.060Fe-59 45.6d |3,T stable 1.859 0.000
H-3
12.3y
(S stable 786.609 209.276Hf-lBl 42.4d (S,T stable 0.021 0.000
Hg-197
65h €,T stable 0.357 0.000Hg-197/*
65h/ €,T/ stable/ 0.228 0.000-203 46.6d a stable
Hg-203
46.6d |3 stable 0.602 0.0001-125 59.7d €,T stable 6.738 0.000
1-125/* 59.7d/ €,T/ stable/ 2.800 0.000
-131 8.Id a stable
1-131 8.Id a stable 73.097 0.000
Na-22
2.6y
(3+.T stable 1.B40 0.003Na-2^ 15h (3»T stable 0.150 0.000
P-32 14.3d (3 stable 69.366 0.000
S-35 87.2d IS stable 33.218 0.000
Se-75 120d e stable 0.822 0.000
sr-es 65d € stable 0.078 0.000
Sr-89 50. Bd (3,T stable 0.015 0.000
Tc-99m 6h e,T Tc-99*** 0.585 0.000
Y-91 58. Bd (J,T stable 0.001 0.000
Zn-65 243.7d (X+,e,T stable 0.164 0.000
* When two radionuclides were buried without distinction of amounts of
each, the longer half-life of the two was used for calculations.
** In-115 is a naturally occuring isotope with a half-life of 5 X 10^"
years. The In-115 present would have an activity of 3.62 X 10-'-^ mCi
*** Tc-99 is a naturally occuring isotope with a half-life of
13
buried at the site. After 19 years of decay, this would lead to an
additional 76 mCi of carbon-1^ and 167 mCi of tritium. This would make
Section III
TRITIUM
The tritium atom has many distinguishing properties that allow for
it's detection and activity measurement in soil. This study will use
some of these properties in an assessment process of the LLRW sites.
3.1 Tritiua Properties
The tritium atom is a beta emitter» decaying to helium-3. Its beta
particle has an 18.6 keV maximum energy with an average energy of 5.67
keV. The half-life of tritium is given as 12.3 years (10). The
biological half-life is given as 10 days.
Tritium is produced naturally in the atmosphere by the
interaction of high energy cosmic rays with nitrogen (5) and is
produced by man in nuclear reactors and in nuclear weapons testing. The
natural production is estimated to be about 0.20 ± 0.05 tritons per cm^
per sec (6). About 90*/, of the natural tritium is found in the
hydrosphere, 10*/. in the stratosphere, and 0.1'/. in the troposphere (11).
The natural production rate yields a steady state inventory of 26
MCi in the biosphere (3). The annual absorbed dose from tritium of
natural origin is estimated to be 0.001 mrem/yr (3).
The concentration of tritium in rainwater is 130 to 185 pCi/1 (6).
15
processes. At room temperature> tritium will readily replace hydrogen
in water molecules forming tritiated water (HT + H^O * HTO + H.) <5).
Tritium follows the movement of water> constantly dispersing as it
moves. The dryer the soil the slower the tritium movement* but
conversely, an over abundance of soil water will slow the movement of
tritium due to lateral molecular diffusion (1^).
Bonding of tritium molecules to micas in the soil is found at room
temperature (1^). The water of hydration reaches equilibrium with it's
environment in a short time. The removal of this bonded molecule can be
accomplished by heating the micas to the 100 to 500'C range (5, 14).
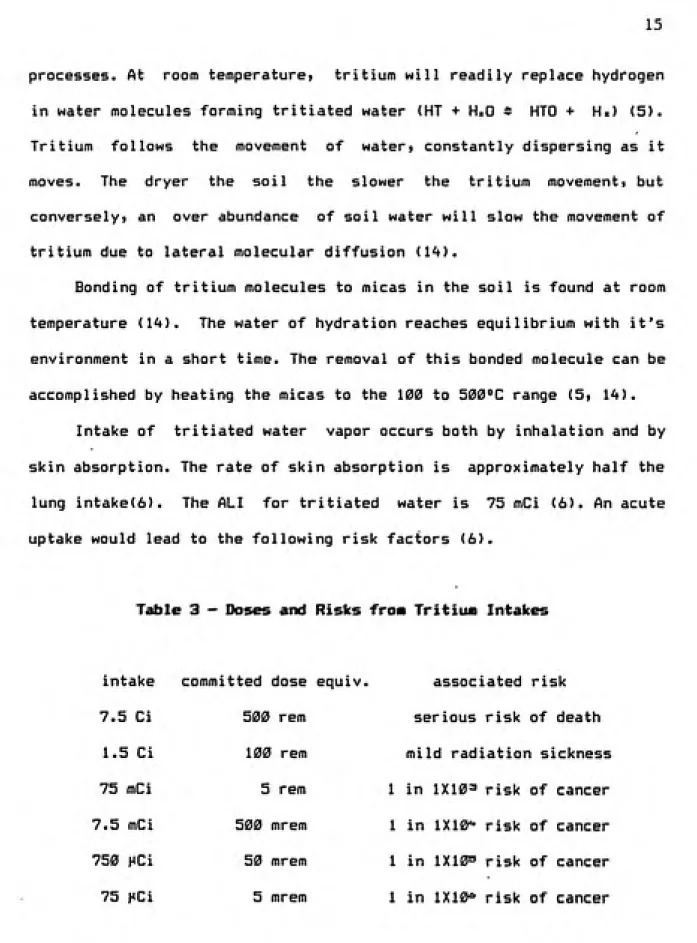
Intake of tritiated water vapor occurs both by inhalation and by
skin absorption. The rate of skin absorption is approximately half the
lung intake(6). The ALI for tritiated water is 75 mCi (6). An acute
uptake would lead to the following risk factors (6).
Table 3 - Doses and Risks froa Trititia Intakes
intake committed dose equiv. associated risk
7.5 Ci 500 rem serious risk of death
1.5 Ci 100 rem mild radiation sickness
16
3.S Trititia as an Assessaent Tool
The use of tritium as a tool in the assessment of the two LLRW
sites arises from two facts. First the high mobility of tritium and
secondly, the amount of tritium buried at the sites. Associated with
the high tritium mobility, is the possibility that over the years most,
if not all, of the tritium may have migrated from the burial pits and
dispersed to non-detectable levels.
At the Airport Site, of the 9.^ mCi of remaining inventory, as
much as 1.5 mCi may be tritium. If the tritium has dispersed to
non-detectable levels, only 7.5 mCi of total activity (primarily carbon-l^)
would remain buried on the site. This would be a 20*/. reduction in
activity.
At the Mason Farm Site, tritium was the major radionuclide buried.
Tritium is also the major remaining radionuclide at this site. Of the
574 mCi of total remaining inventory buried at the site, 376 mCi is
tritium. If the tritium has dispersed to non-detectable levels, this
would leave 198 mCi total activity, a reduction of approximately 63*/..
Section IV
nETHQDGLOGY
This study examined the soil in and around the burial pits for
tritium movement. The interstitial soil water, as well as ground water,
provides pathways for tritium movement. In order to examine the soil,
a soil sampling criteria was established. That is, what method was to
be used to collect samples, and at what locations will the samples be
taken. To examine these soil samples for tritium activity, extraction
and counting processes were established.
4.1 ftethod of Site Surveys
The samples were taken using a boring tool. This was twisted into
the ground bringing up a a to 10 inch section of soil when the tool was
extracted. Two opposing blades on the tool cut through the soil leaving
a 3 inch diameter hole. The cutting action mixed the slices of soil in
the holding chamber of the tool. The result was that no exact depth of
samples was possible. There was a range in depth for each of the soil
samples. This range was about h inches.
Soil samples were taken at 3 or more different depths from each
individual test hole. Top soil and vegetation samples were not taken in
this study. They have been taken and analyzed by the North Carolina
18
detection of radionuclides (^). The first sample of each hole was
selected to be approximately 1 foot deep. Since the burials were
reported to be covered with 4 feet of earth, another sample was taken
at a depth of ^ feet. A third sample from about 2.5 feet was taken to
check for upward movement of the tritium. Additional samples were taken
at lower depths whenever actual pits were entered or in test holes
close to these pits. This usually resulted in samples from 5.5, 6, or6.5 feet. The equipment used was limited to 6 feet 10 inches.
The first set of samples taken was at the fence perimeter
surrounding each site. A series of 10 test holes was dug within S feet
of the outside of the fence. This can be seen in figures 5 & 6.
Although the Airport site is much smaller than the Mason Farm site, the
same number of holes was used because of the lack of exact burial
records. At the Mason Farm site, most of the burials along the fence
were plotted and recorded.
The strategy for sampling inside the two sites differed slightly.
The pegs at the Airport site identified pits and gave a starting point
for soil sampling (Figure 5). Test holes were dug in the pits and in
the soil around them. Many extra holes were dug to determine if the old
burial records were complete and to check for movement of tritium.
At the Mason Farm site, the scale drawing of the first 37 burials
along with the burial record book (9) were used to establish a slightly
different pattern for sample holes. A search through the records gave 3
pits having the greatest amount of tritium and/or carbon-14 buried in
them. These were pits number 9, S2, and 30. The amounts buried here can
19
9
®
(S)
®
®
iX)
®
®
®
^
®
/
ͣ
/
®
16
®
BKG
AO yds away
FIGURE 5 : Airport site drawing showing position of
sample holes. Numbers are the same as in
7®
®
state 38®
9®
BKG0^-//-150 yds
'X36 >< 37X38?
X39? 47? X A8? X49? X 50? ͣ A40?)^A1?
X42? X"? 51? 52? 53?>C44? 5^56?
0 0®
series 14
V45?
^46?
'55?
X 54?
10 ®
®
srate 2
•X
.X
gate
Figure 3
®:
20X17 X10
Xl8 27
Xn
X12 13 XIXl
®*
X3® ® ®
series 13X28
X*
• X
X29 Xi5 X ??x?? X
300 ® ®
series 12
X 16
X
*x
X 31 X 21
®1
state 1® 3
>^"®S®
^6
series 11X33 ^
23>< 34
'24X25
X7 X9 14 X26X20 X 19
® 1
®
FIGURE 6
: Mason Farm drawing showing position of sample
holes. Numbers are individual burial pits.
?, ??, and * represent pits in which the exact
center is unknown. ? from burial log book, ??
visible from surface, * based on unlisted burials
X - center of a pit. @- position of sample
Sample site listed as state is position of
ground water samples taken by the state of
21
on the scale drawing on file) of the pit. At about 5.5 feet to the left
and right of this center holej another hole was dug to test for
movement of tritium out of the pits (Figure 6)..
An additional set of holes was dug to check an area of the site
where the pits were not so carefully marked (series 14 on Figure 6).
The placement of series 14 was based on the rough hand drawing in the
burial log book on file (9). Contact with buried material in this area
would prove that there were more than 52 burials at the site.
Ground water from the test holes was also examined. This was
taken in all holes except those in the center of the pits. Mud and
particulate matter was filtered out before counting to reduce
quenching. The method used for counting was the same as for the
interstitial water.
Background soil samples were taken to compare with soil samples
from the sites. At the Airport site, a hole was dug about 40 yards
uphill (towards the runway) from the burial site. Samples were taken at
1.5 and 3.5 feet. At the Mason Farm site, the same method was used withbackground samples coming from approximately 150 yards from the site.
These background samples were processed in the same manner as site
samples. The background value for soil (an average of both depths) at
the Airport site was 59.75 ± 1.54 dpm/ml of interstitial water. The
background value at the Mason Farm site was 49.79 ± 1.62 dpm/ml of
interstitial water. The site background values include counter
background. The error given is counting error only.
22
used for the preparation of a set of control samples. Using 1 ml of
water gave a counter background value of 36.19 ± 1.44 dpm. Using the
count rate of this sample? and a counting time of 180 minutes, a MDA of
1.68 pCi/ml is obtained. The MDA was calculated by first using the
formula LLD = 2.71 + 4.65 Vb" , where LLD is the lower limit of
detection and B is the background in counts. Next? the LLD was divided
by 180 minutes to give counts per minute. This value was divided by the
counting efficiency (32*/.) to get a MDA in decays per minute. Dividing
the dpm value by 2.22 dpm/pCi gives the MDA in pCi. All of the samples
counted were 1 ml aliquots» resulting in a MDA in pCi/ml.
4.2 Hethod of Tritiua Extraction and Counting
After the samples were collected} they were brought back to the
lab for processing. The soil was placed in a flask with a ground glass
top. This was attached to a Graham condensing coil with a ground glass
connector. The flask was placed on a hot plate to drive off the
interstitial soil water. When the vapor condensed, the water was
collected in a small beaker and transferred to scintillation vials forstorage. Soil samples were kept frozen while waiting to be processed.
All samples were processed within 2 to 3 days. This method of
extraction was used by the state of Kentucky when examining the Maxey
Flats burial site (1). NCRP 47 states any method that is feasible in
the laboratory that will yield reasonably pure interstitial water from
soil samples is potentially useful, one of which is distillation at
23
by weight for each sample.
A 1 ml aliquot of the condensed water was then used for counting
in a liquid scintillation counter. The water was placed in 10 ml of
scintillation cocktail (ScintiVerse BD - Fisher Chemicals). The water
and cocktail was shaken to completely mix the solution. The sample was
allowed to dark adapt for 30 minutes and then counted for 180 minutes
by a Packard MINAXI, Tri-Carb model 4430 liquid scintillation counter.
A control group of tritiated soil samples was made to test the
efficiency of this method of extraction and counting. Dried soil from
background holes and holes where no activity had been found was mixed
together to make a composite sample of the site. To this dried soil, an
amount of water was added to bring the soil to a moisture content which
was the average (21*/. interstitial water to soil by weight) for the
site.
24
FIGURE § : Recovery efficiency for the tritium
extraction process. Variations are due
to counting error.
105
95..
85 •ͣ
recovery ( •/. )
<' ^ f
75 ͣ•
65..
. 1
r
I
f
ͣ
I ! I I I // t I I I t I—//—r
10 50 100 150
S80I I t-f
3E025
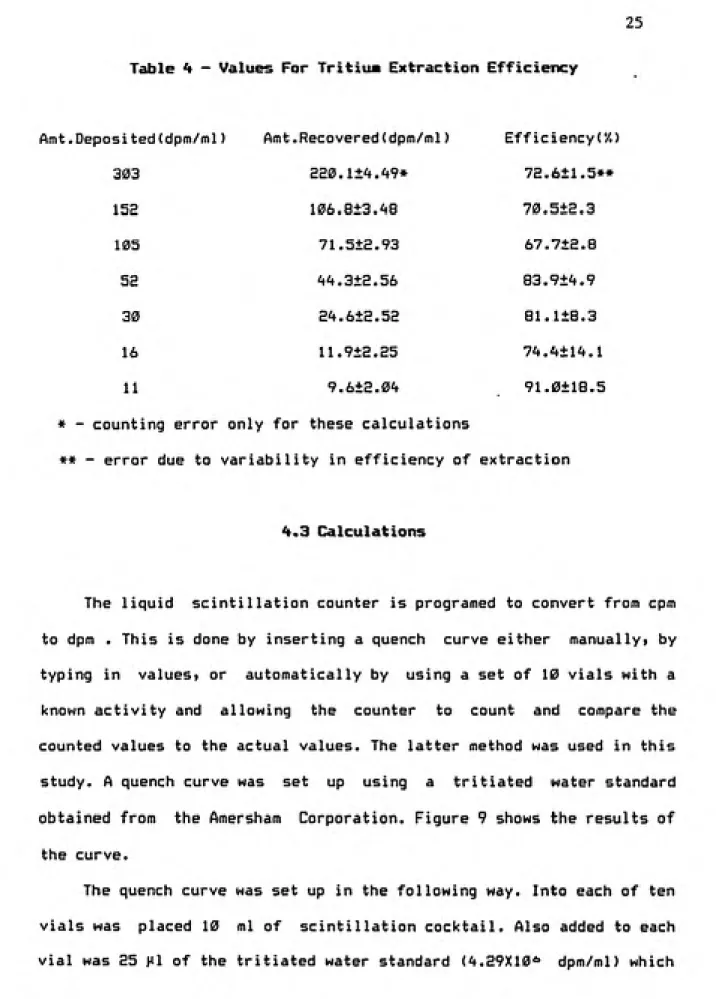
Table 4 - Values For Tritiiui Extraction Efficiency
Amt .Deposi ted(dpm/ml) Amt .Recovered<dpm/ml) Eff iciency ('/.)
303 220.1+4.49* 72.6+1.5**
152 106.a±3.48 70.5±2.3
105 71.5+2.93 67.7+2,8
52 44.3+2.56 83.9±4.9
30 24.6+2.52 81.1±8.3
16 11.9±2.25 74.4±14.1
11 9.6+2.04 91.0±18.5
* - counting error only for these calculations
** - error due to variability in efficiency of extraction
<^.3 Calculations
The liquid scintillation counter is programed to convert from cpm
to dpm . This is done by inserting a quench curve either manually? by
typing in values, or automatically by using a set of 10 vials with a
known activity and allowing the counter to count and compare the
counted values to the actual values. The latter method was used in this
study. A quench curve was set up using a tritiated water standard
obtained from the Amersham Corporation. Figure 9 shows the results of
the curve.
The quench curve was set up in the following way. Into each of ten
vials was placed 10 ml of scintillation cocktail. Also added to each
,. t F F I t; 1 E f-i c V
.00 10.0 20.0
Q
u
E N
c:
1-1
OOi I
120.
•+
240. O
3o0., u
+ .
+
30. t
+
40. O SO. o
26
4130. O
^ • + .
M . * - „ . . 4- .
•• • +
. ., + «
•• M .^ ..
H « .. „ -f- ,
600.. 0 " ... ...,-*ͣ... ...
QUFI-iCH
L-1. rt i;^UtK!CM
El rtliUEIMCII
E.I..A 574..33 .,2 52?.,
32.0 529,. 31.7S,?7. :r-2-.. 6 47 7,, 2b. y 420.. i 9.. ii 3Drb.. .14..3 34 6., ] O.e 2B3,., B. 20
196..
JO'v
FIGURE 9: Quench
curve as calculated by
the liscintillation counter. This curve is for
27
yields 10,725 dpm per vial. Nothing more was added to vial 1. Vial 2
had 0.8 ml of pure water added. Vial 3 had 1.0 ml of water added. Vial
h had 1.2 ml of water added. Vials 2 through 4 generated part of the
curve that examined the quenching of water on the cocktail. Vials 5
through 10 all had 1.0 ml of water plus a stronger quenching agent to
finish the curve. Vial 5 had 10 Hi of CClc^ added. The amount of CClt^
was increased to 25» 50, 75, 100, 200 Hi corresponding to the remaining
vials 6 through 10.
The quench curve represents the counting efficiency in the tritium
window in a dual label counting mode. The window was from channels 0 to
12. These channels are automatically used in the preprogrammed
tritium/carbon-1^ dual label counting mode of the scintillation
counter. Most samples ran at about 32'/. efficiency using this method.
Soil activities of tritium were calculated in the following
method. First the gross dpm was determined by the liquid scintillation
counter. The net dpm was obtained by subtracting the appropriate
(Airport or Mason Farm) background soil sample values from the gross
count rate. A conversion factor was used to convert dpm to pCi (1 pCi
equals 2.22 dpm). All values were determined using 1 ml aliquots of
interstitial water. Figure 10 shows the tritium activity in pCi/ml of
interstitial water for the four series of test holes at the Mason Farm
site. Given that the density of water is 1 g/ml, the concentration of
tritium in pCi/ml of water is multiplied by the water density to give
pCi/g of water. Since there was determined to be a 77'/. extraction
efficiency of the interstitial water and its related activity, the net
series 11
BKG BKG 1
BKG
BKG '
r " -BKe
---^ _
• »'^Gi
1 buried material._ J
51 293 BKG BKG BKG 2.5.BKG - 5.! 6.!
ce
series 12
ft
BKG
, »
1 1
7
ft .50 178
<MDA
ft 150
r- _-556_
buried material ͣ
87
ft BKG 1225
88 I
ft 2403
1 series 13
BKG BKG
BKG-7 BKG BKG
19 1 1 buried BKG material
1
BKG1 2A
u
-I
• BKG 1
116
surface
1 --ft
2. ft
ft
BKG . 5.5u_ft J 260
series 14
BKG
1 33
BKG
28
, . 16.3
73128
1---160-
---^
60 buried material1 260
I 176
t261
FIOniE 10: Activity (pCi/ml of interstitial water) by depth
for the 11-14 series of sample holes. Each series
29
activity of interstitial water in pCi/g.
The final step involved the percentage of water by weight in the
sample. By removing the interstitial water and its associated activity
from the soil sample, there was a concentration effect in the activity
of the water. The interstitial water was spread over a larger volume
while in the soil. Thereforej to examine the activity in the soil, the
water activity must be related back to the activity in the larger
volume of the soil itself. This is accomplished by multiplying the
percentage of water by weight in the soil by the activity of the
interstitial water. It is assumed that the interstitial water is
uniformly spread in a soil sample.
This leads to the equation :
A = N X C X Dw X Pw X e-^ (1)
Where A is soil activity in pCi/g, N is the net activity of the
extracted water in dpm/ml, C is a conversion factor (lpCi/2.2Sdpm), Dw
is the density of water (Iml/g), Pw is the percentage of interstitial
water by weight in the soil, and
€
is the efficiency of the
interstitial water and tritium extraction process.
The results of these calculations can be seen in Appendix C for
the Airport site and Appendix D for the Mason Farm site.
One pit in the Mason Farm site was chosen to make a comparison
between the measured activity found in the soil and the amount buried
in the pit (according to burial records). Pit #30 was used for this
30
The soil surrounding the three test holes at pit #30 was divided
into 13 sections (volumes)? corresponding to the 13 samples taken from
this area (See Figure 11). The areas corresponding to the center hole
differed from that of the left and right test holes. The center area
was taken as b feet by 6 feet> the assumed pit dimensions. The left and
right areas used were 6 feet by 5 feet. This smaller area was used to
keep the effects of adjacent pits to a minimum.
The thickness of a section depended on the depth of the
corresponding soil sample. The top section (for the 1 foot sample) was
taken from 0.5 feet below the surface to half the distance from the 1
foot sample to the 5.5 feet sample» a distance of 1.25 feet. Boing from
the midpoint between the 1 foot and E.5 feet sample to the midpoint of
the 2.5 feet and 4 feet sample gives the thickness of the section for
the 2.5 feet sample as 1.5 feet. Using the same method, the thickness
for the 4 feet sample is 1.5 feet. The 5.5 and 6.5 feet sample depths
both have section thicknesses of 1 foot.
The activity in a section of soil is assumed to be uniformly
spread in that volume. The activity used for a section is that of the
soil sample from the center of that section. This activity, the soil
volume, and the density of the soil is used to calculate the activity
in one section. The 13 sections are then added together for the total
activity of the pit.
The density of the soil is given as 137.4 oz/ft= (2). By
converting to g/ft^, multiplying by the volume in the section and
multiplying again by the activity in that section, the activity for
BKG
12.4at0.4A
3 4A.A510.73
BEG
8.2410.43
51.63±0.77
160.03±1.25
8 363.%±1.87
734.51±2.68
10 2.32±0.43
II 0.1610.34
12 26.9510.64
13 27.8610.65
FIGURE 11 : Diagram showing volumes used for activity calculations '
for pit #30 at the Mason Farm site. Sample hole goes
through center of volume. Values given are that of soil
samples from center of each section.(pCi/g). Tritium
32
This relation is given by;
Av = V X D X As (E)
Where Av is the volume activity in mCi, V is the volume of a section in
ft^, D is the density of the soil in g/ft^? and As is the sample
activity for that section of soil in pCi/g. The total activity for the
Section V
PHYSICAL OBSERVATIONS
In many ways the physical observations are as important as the
measured findings. Many such sites exist, therefore information as to
how the materials buried at the sites may have reacted becomes of
interest. This includes the amount of decay, both physical and
radioactive, that has occurred and the overall condition of the site
itself.
5.1 Airport Site Observations
The Airport site is about 100 yards past the present end of the
airport runway, off to the right at about a 30° angle. It is located on
the side of a hill. About 30 feet from the back side of the site, there
is a very steep incline to the woodland below. The soil is classified
as being Wilkes gravelly loam (2).
A visual inspection of the area gave clues as to the number of
burial pits. Besides the array of metal pegs, most pits show a concave
top. This aided in associating pits with a particular grouping of pegs.
The soil in the site area was probably fill dirt from the airport
construction. Although the dirt was mostly clay, it varied in texture
slightly from test hole to test hole. Occasionally, a small amount of
34
The depths of the soil samples from each test hole were kept as
constant as possible. There were some variations. The position of the
test holes can be seen in figure 5. Hole # 1 only went down 3.5 feet
when it struck rock. Hole # 18 and # 20 had a muddy layer at 6.5 feet
and 5.5 feet, respectively. This was the only indication of any ground
water on the site. No other holes had this muddy layer. Hole # S3 hit
rock at 3 feet. Attempts to go deeper were made at two locations for
this hole with the same result. Hole # El and # 26 both hit a burnt log
at 5 feet and 6 feet, respectively. Since these two holes lie in a
straight line, this may be the same log.
The following holes brought up buried waste material with the soil
samples: In hole # 24, contact was made at about 49 inches. At that
point the boring tool moved about 1 foot in an air space. A very strong
odor of decay escaped. Soil samples from this depth included hair (fur)
and broken scintillation vials. Nothing was found after 5.5 feet. In #
25, at about 4.75 feet, an animal carcass was found. This carcass was
still intact enough to stop the progress of the boring tool. Soil
containing animal skin, fat, and fur was taken. In # 27, a metal can
was breached. The tool would not go through the bottom, but planchettes
buried in the can were recovered and analyzed. In # 28, at 4 feet a
gallon glass jug was met. The boring tool broke through and pressed
into the clay below the jug. This allowed a sample of the fluid inside
the jug to be trapped in the tool. Also found under the jug was straw
bedding that had not completely decayed in the 26 or so years since
burial.
35
organic material buried had not decayed. It is conjectured that
anaerobic conditions caused by the depth of burial in this clay soil
and the fact there was no appreciable water table slowed the decay
processes.
5.8 Nason Far* Site Observations
The Mason Farm site is located about 2 miles behind the Finley
Golf Course. It is located in "bottom land" on the old Mason Farm
property. The soil has a thick clay texture and holds water on the
surface when it rains. The soil is classified as Chewacla loam (2).
Over the years, the surface water has changed at the site. There
is a standing body of water at the back of the site that goes up to the
fence. During a rainy period, this water will rise into the burial site
and cover pits located near the fence.
Except for 2 of the pits, there is generally no standing water on
the site. The tops of these E pits have sunken so that they hold rain
water. The clay is thick enough to keep most of the water on top. One
of the pits will dry up after a period of no rain but the other has
sunken enough that it appears to be fed by ground water (which is no
more than 2.5 feet below the surface). During the last year of
observation, this pit has not been dry.
The pits were not marked in the site itself. Except for a few of
the pits, there was no major sinking of their tops. The scale drawing
of the first 37 pits and the rough hand drawing were relied on in most
36
By using the two drawings to locate test holes in and around the
pits, contact with waste material was easily accomplished. Hole # H
(figure 6) made contact at ^ feet. A chemical odor was noticed at about
3.5 feet. Rubber gloves, pieces of cardboard, and vials were exhumed.
Hole # 11-left also made contact. After 5 feet in both holes, no more
material was found. Hole # 12 also made contact at ^ feet. A very
strong odor of chemicals and decay was noticed. Animal bones (rabbit or
cat), cardboard, vials, and gloves were extracted. There was still
material below the 6.5 foot level. Hole # 13 made contact at 3.5 feet.
Again a strong chemical odor was noticed. There was nothing buried
below 5 feet.
Hole # 14 also made contact with buried material. Material was
found beginning at a depth of 4 feet. Downward progress was stopped at
b feet because of the amount of glass encountered. This pit was burial
55 or 56 (from the rough hand drawing). It could not be determined
which from the available records on file.
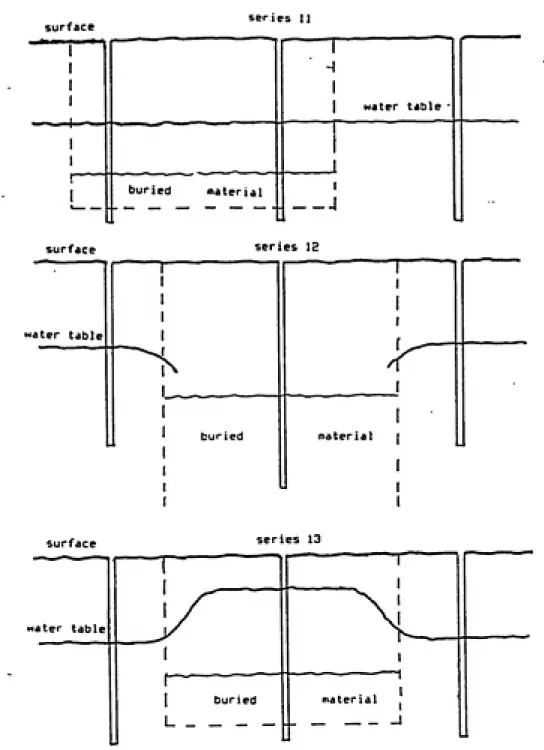
As a point of interest, the first 3 test hole series (11, 12, 13)
demonstrated changes in the water table level at the individual pit
sites (Figure 12). The normal water table is very high here. A test
hole would hit water at about 2.5 feet. At that depth, water would run
into the hole fast enough to be audible in several instances.
The 3 holes denoted # 11 showed no effect of the pit on the
ground water level. The # 12 series of test holes did show an effect.
This pit had material deposited at a deeper level. While the left and
right hole of this series showed the normal table height, the hole in
surface
series 11 1
^
1
1 water table '
1
buried material 1
4
1
U
37
surface series 12
ater table
1
bur ied material
-surface
water table
series 13
(—---~-I buried
material__________-1
FIGURE 12: Effects of burial pits on water table
38
got soupy in the pit from about 4.5 feet on but no there was no running
water. The water may be going to a lower water table or may be
collecting in the pit and welling up.Hole series # 13 had a different
outcome. The left and right holes of this series also showed normal
water levels. The center hole in the pit had ground water at about 1
Section VI
REStA.TS OF SOIL ANALYSIS
The two sites vary greatly in their physical characteristicsj and
in the amount of their use. They also vary in the results of their soil
analysis.
6.1 Airport Site Results
An initial assessment was made on the first 10 test holes around
the perimeter of the fence. The tritium values for interstitial water
from these samples was compared to the tritium values for the
interstitial water of the background soil taken above the site. The
background value for this water was 59.75 ± 1.54 dpm/ml (26.91 ± 0.69
pCi/ml). This background value was subtracted from all values of the
tritium window coming from site samples. The results of this
calculation and the calculations given in equation 1 are listed in
Appendix C. '^
All but two of the perimeter samples yielded values in the
tritium window of less than 5 pCi/ml of water (above background).
40
Because of this relatively high value in the #4 hole (over background
sample values) it was assumed there was detectable tritium activity in
this sample. No other values above 1.6 pCi/g were found. These lower
values were to close to soil background values to make a definitive
statement as to actual tritium activity.
Holes #11 through 16 were dug to examine the possible tritium
dispersion thought to be found in #4 (Figure 5). This series of holes
gave no samples above 1.1 pCi/g of soil (above background) except #16
at 1 foot. It's initial value was 7.9 pCi/g. Both samples (#4, #16)
with the higher values for tritium came from the 1. foot depth and in a
straight line. Samples were again taken from these two places. This
time, both resulted in tritium values below the soil background value.
Some other samples taken in the site at the same time as the repeat of
#4 and #16 also gave values much below the background level.
Occasionally, other samples gave results that changed dramatically
over time. In order to examine the reproducability of the counting
system, the samples were counted again 2 to 4 days after the initial
count. Certain of the samples increased in counts by as much as a
factor of 10. This increase was in steps. After a period of a few days,
there was no further increase, but a stabilization at the higher count
rate. This seemed to indicate some sort of equilibrium process.
Looking back at the time of the sample collection, the samples
with the highest (which included background soil) and/or changing
results were collected on days when there was rain either that morning
41
rain, was affecting values in the tritium window. This greatly
increased the variability of the tritium values between samples.
Samples taken soon after a rain had tritium levels generally in the
50'5 dpm/ml (including background) of interstitial water', while values
taken during a dry period were generally in the 30's dpm/ml (many at
counter background levels: 36.19 ± l.^k dpm/ml). This included soil
collected both inside and outside of the site boundary.
Sample holes 17 through 31 were inside the site boundary. The
tritium values of these samples were all less than the background soil
sample value for tritium. This included values taken from the soil
around the extracted broken vials, the planchettes, the animal remains,
burnt logs, etc. The lower than background values may be explained by
the variability of samples due to the rain effect.
Certain samples were also analyzed for carbon-14. This was done
using a combustion method. The service was preformed by Peter Mertens
of the Packard Instrument Company, Chicago. The results can be found in
Appendix C. One sample had higher values for carbon-14 than the others.
This was the sample from hole # S5 at the 5.5 feet level. This sample
gave readings of 176 dpm/g (79 pCi/g) of soil over counter background
(^3.7 dpm).
The scintillation cocktail recovered at this site was also
analyzed. The cocktail itself showed no activity when an aliquot was
42
This is all consistent with scintillation cocktails and lab procedures
from this time period.
Selected samples were also examined using gamma spectroscopy. A
sodium iodide counting system was used (The Nucleus, Personal Computer
Analyzer with a 2 inch crystal). The samples selected were from the
burial pits. They were allowed to count for 12 hours. In no case was
any activity above a background level of the system found.
6.2 Mason Far* Site Results
An initial assessment of the first 10 perimeter holes was made.
These were compared to tritium values from interstitial water of a
background soil sample. This background value (which includes counter
background) for 1 ml of water is 49.79 ± 1.62 dpm (22.43 ± 0.73
pCi/ml). This background was subtracted from all tritium window values
of interstitial water obtained from soil samples at this site. This
calculation and the calculation results using equation 1 are given in
Appendix D. Figure 10 shows the tritium values for the interstitial
water obtained from the four sets of sample holes.
In all but one hole» values for the perimeter samples are less
than 3 pCi/g of soil (above background). The higher readings are in
hole #5. At the 4 foot level the value is 9.75 ± 0.41 pCi/g, while at
5.5 feet it is 18.82 ± 0.52 pCi/g of soil. Because of its location,
further outward dispersion of tritium could not be examined at this
43
reflect the 26 mCi of tritium buried in pit #10, just a few feet from
the hole (Figure 6).
The tritium values for samples taken inside the site boundary did
show some activity. All subsequent tritium values given are above the
background value. In the #11 series? activity was found at the 5.5 foot
level both in the center and left test holes. The center hole had a
value of 86.37 ± 0.96 pCi/g while the left had a value of 17.22 ± 0.59
pCi/g. Both of these holes are in the burial pit itself.
Series #1S exhibited higher values for tritium. The center hole
into the pit gave increasing values in a downward direction. This
ranged from about 8 pCi/g of soil at 1 foot to about 735 pCi/g at the
6.5 feet level (See Figure 11). Some activity was found in the soil on
both sides of the pit. In the left hole, about 12 and ^5 pCi/g of soil
was found at 2.5 and ^ feet levels, respectively. On the right, 2 pCi/g
was found at 1 foot while 27 and 28 pCi/g of soil was be found at the ^
and 5.5 feet levels.
Series #13 had results similar to those of #11. The center hole
into the pit had detectable tritium at the 5.5 foot level. This was
4.2't ±0.37 pCi/g of soil. The left hole of this series had values of
about 2 pCi/g at 2.5 foot, 5 pCi/g at ^ foot, and 6 pCi/g of soil at
5.5 foot. ,Series #14 was somewhat similar to series #12. The center hole was
in the burial pit. The tritium values of the center hole started out at
about 8 pCi/g of soil and increased to 43, 44, and 57 pCi/g at the 2.5,
3.5, and 6 feet depths. The left hole of this series yielded about 8,
44
hole yielded tritium values of about SS> 2S, and 6 pCi/g of soil at
2.5, 4, and 5.5 feet depths.
The ground water at this site was also evaluated. The ground water
was counted in the same method as interstitial water. The tritium
window was used for results. Background ground water was taken from the
same hole as the background soil. The activity of 1 ml of this
background water was 49.27 ± 2.09 dpm. This background value was
subtracted from the tritium window values of the water taken from the
sample holes. The results of this calculation and the conversion to
pCi/ml are displayed in Appendix D.
Ground water samples were taken from holes not bored into the pits
themselves. The water in these holes was came into direct contact with
the buried material in the pits and was considered contaminated by the
material and not representative of the ground water at the 2.5 feet
level. Only six samples yielded values above MDA. The higher activity
values of ground water came from the pit areas with the higher
interstitial water activity values. Holes 12-right and 14-right had the
highest values at 25 and 43 pCi/ml of water respectively.
In the area where hole #6 (Figure 6) should have been, only
surface water was obtainable. No test hole was drilled at this
location. The surface water tritium value at this location was compared
to tritium values of surface water near the background soil sample
hole. The water at # 6 was lower in tritium activity than the
background sample.
An unbroken scintillation vial was retrieved from hole #11
45
tritium window gave a value of 826 dpm, but most of the counts were in
the carbon-1^ window. This window gave 1587 cpm. The counter did not
have a quench curve set for carbon-14. Assuming a 50*/. (from the Packard
Instuments manual) counting efficiency for this nuclide, 317^ dpm would
be the activity for the carbon-1^. This would give about 1.^3 nCi per
ml. This vial contained about 18 ml, which would result in a total
activity of about 25.7 nCi of carbon-14. This vial was in a pit that
contains 25 mCi of buried carbon-14. If the pit contained all vials of
carbon-14 with this amount of activity, there would need to be
approximately 10* vials buried in the pit. The estimated dimensions of
the pit would not hold this volume.
No sample of interstitial water in this site gave any values over
background in the carbon-14 window. This included soil that surrounded
bones, broken vials, rubber gloves, and fragments of cardboard.
Certain samples were selected for analysis by gamma spectroscopy.
These were selected from soil samples coming from the pits. In no
instance was any value over the system background obtained. The method
used was the same as for the Airport site samples.
The calculated activity of the soil in and around pit #30 was
lower than that given in the inventory of the pit (See Figure 11). The
total tritium activity remaining in pit #30 was given as 30 mCi. The
amount of tritium in the soil at the area of the pit was calculated as
0.22 mCi. The calculated activity is a little more than two orders of
Section VII
SUHHARY AND CONCLUSIONS
The results of the tritium examination vary to some extent
between the two sites. This variation supports some differences in the
conclusions that were drawn on the different sites.
7.1 Airport Site Suaaary
At the Airport site, no tritium could be found. The differences in
tritium values from site samples and those of background soil were
either very small or negative in value (less than background). The
variation in sample and background values was due in part to rain
causing an unknown confounding factor to be added to the samples.
There could be several possibile explanations for not finding
tritium dispersion. One possible reason is that the tritium buried here
has dispersed to non-detectable levels. Another possibility is the
tritium may still be in the containers it was buried in. The scope of
this study cannot determine if one of these possibilities is the true
reason or if there is another reason or reasons that lead to these
findings.
The carbon-14 buried at the site seems to be remaining in the pits
it was placed in. This comes from the Packard Company's soil analysis.
47
This animal was relatively intact after 26 years.
The organic material at this site has not completely decayed. This
was proven by the animal carcass that stopped the boring tool progress
as well as samples of straw bedding and fur from other pits. The lack
of a water table that enters the pits and the depth of burial in the
clay soil has combined to slow the decay process.
7.2 Mason Fara Site Su—ary
The Mason Farm site findings lead to many avenues of thought. One
of the findings that arouses interest is the different effects on the
water table level by the different pits (Figure 8). Pits #13 and #22
had burials to about the same depth, and yet the water table rose to a
higher level in #13 and remained unchanged in #22. This may be due to
compaction differences at the time of burial or differences in the
material buried in the pits. In the one pit (#30) that seems to act as
a sump for the ground water, the water may be moving to a lower table
or the pit may be filling and acting as a kettle boiling over, mixing
with the water at the 2.5 foot level. The equipment used in this study
could not determine which might be the case.
In two of the pits (#22 and #13) that were examined, the only
tritium values above background were at the bottom of the burial pit
itself. These values were relatively small. The majority of the
tritium may still be in the containers it was buried in or it may have
48
In the other two pits examined, it is easier to see tritium
dispersion. Pit #30, examined by series #12, shows a slight movement
upward of tritium (Figure 10). The value at the 1 foot depth may be a
result of dispersion of the large amount of tritium buried in this pit.
The 2400 pCi/ml of interstitial water value at the bottom (6.5 feet) of
this pit was the largest found in any of the samples. This value for
interstitial water equated to 735 pCi/g of soil in that sample. Soil 1
foot above this sample had only one-half it's activity (364 pCi/g).
The #14 series of holes (pit #55/56) has results similar to those
of series #12. Again there appears to be some small upward dispersion.
The left sample hole (in the soil beside the pit) in this series has a
tritium window value greater than any from inside pit the itself. This
may be the result of tritium dispersion in a path away from the pit.
The similar findings of pits #13 and #22 along with similarities
in pits #30 and #55/56 brings out another point. The two pits with very
little traceable activity (#13, #22) had burial depths of about 5 feet,
while the pits with more traceable activity (#30, #55/56) had burial
depths in excess of 6.5 feet. This could mean it took longer for the
tritium to disperse from the deeper pits, allowing it to be found now,
while it is below detectable levels in the shallow pits because of less
travel distance to ground water (2.5 feet vs 4 feet)or the surface (5
feet vs greater than 6.5 feet). It cannot be determined if this is the
case or if the containers of these deeper pits happened to allow escape
of the tritium while containers in the shallow pits are not allowing
49