. i
PASSING AND SHOOTING ZONES: WHICH AREAS OF THE FIELD ARE THE MOST SUCCESSFUL FOR THE UNC WOMEN’S SOCCER TEAM
Frank Silva
An honors thesis submitted to the faculty of the Kenan-Flagler Business School at the
University of North Carolina at Chapel Hill
Chapel Hill 2016
Approved by________________________
. ii ABSTRACT
Frank Silva
Passing and Shooting Zones: Which areas of the field are the most successful for the UNC Women’s Soccer Team
(Under the direction of Professor Wendell Gilland)
. iii
TABLE OF CONTENTS
ABSTRACT...ii
LIST OF TABLES...v
LIST OF FIGURES...vi
Chapter I. INTRODUCTION...1
A. Background...1
B. Methodology...2
1. Data Collection...2
2. Data Analysis...6
3. Limitations...8
II. LITERATURE REVIEW...9
A. Passing Strategies...9
1. Number of Passes...10
2. Location of Passes...11
3. Type of Passes...12
B. Shooting Characteristics...13
1. Location of Shots...13
2. Frequency of Shots...14
C. Summary...14
. iv
A. Location of Shots...20
IV. PASS LOCATION ANALYSIS...26
A. Does Pass Location Affect Shot Quality?...28
B. Considering Shot Location, does Pass Location Affect Shot Quality?...30
V. NUMBER OF PASSES ANALYSIS...34
VI. CONCLUSION...39
A. Future Work...40
. v
LIST OF TABLES
Table 1.1 Amount of Shots Taken in each Zone by Quality Level...5
Table 3.1 Amount of Shots and Goals for each Shot Quality Category...17
Table 3.2 Side of the Field each Zone is Located in...19
Table 3.3 Proportion of High Quality Shots in each Side of the Field...20
Table 4.1 Amount of Passes from each Zone Prior to Shots...27
Table 4.2 Proportion of High/Low Quality Shots coming off Passes from each Zone...27
Table 4.3 Amount and Proportion of High/Low Quality Shots coming off Passes from each Third of the Field...28
Table 4.4 Amount and Proportion of High/Low Quality Shots taken in the Penalty Box from each Third of the Field...31
. vi
LIST OF FIGURES
Figure 1.1 Zones of a soccer field in which shots and passes completed were
labeled...4
Figure 1.2 Average Shot Quality in each Zone...6
Figure 3.1 Thirds of the Field...20
1
INTRODUCTION
Of all the major global sports, soccer is likely the most difficult to try to analyze using statistics. In baseball and football, every offensive play occurs in discrete events that are simple to categorize. Other sports, such as basketball and hockey, are like soccer and have more of a continuous flow to the game; thus making a game much harder to analyze due to the vast amount and variety of individual player and team actions. Basketball and hockey, however, have fewer players and less playing time than soccer. Besides the nature of the sports itself, soccer analytics is also held back by some of the people who work in the field.
To add to the difficulty of statistical soccer analysis, many of the people who work on soccer analytics, like those who work in analytics in most sports, do so behind closed doors for the club or team they work for. These people are trying to give their teams a competitive advantage over other clubs, so they keep their work private. Despite this obstacle and the difficult nature of the sport, plenty of work has been posted online and published in research journals attempting to explain and describe the intricacies of soccer. This paper will try to build upon previous soccer analytics work by using data collected from the UNC Women’s Soccer team’s 2015 season.
2
characteristics made some shots more successful than others. The next section will go into more detail regarding what specific shot and pass characteristics were collected and examined. Using the findings, the paper will then make a few concluding remarks regarding which aspects of shooting and passing were the most and least successful for the team.
Methodology
This paper is an empirical analysis of the UNC Women’s Soccer Team
passing and shooting characteristics. The methodology for this project was completed in two major steps. First, data of the team’s passes and shots were collected from all official games in the 2015 season. Next, the data was analyzed to see if statistically robust conclusions could be made about the team’s passing and shooting
characteristics. This paper’s data collection limitations will be addressed at the end of this section.
Data Collection
The data for this paper came from all eighteen regular season games the UNC Women’s Soccer Team played in 2015 plus three postseason games they played in the ACC and NCAA tournament. Video from all of these games was analyzed using Sportscode, a video analysis program that was provided by the UNC Women’s
3
One of the key data elements that was recorded was the quality of each shot. Shot quality is determined based on standards created by the UNC Women’s Soccer Head Coach, Anson Dorrance. He created four categories of shots: Awesome, Good, Shot, and Bad. A shot would be categorized into one of these categories based on how many of four benchmarks a shot met. These benchmarks depend on where the shot was taken. According to the four benchmarks for shots taken inside the penalty box, the optimal shot would:
1. Be on frame;
2. Be low (knee-height or lower);
3. Be across the goal (i.e. if a shot was taken on the left side of the penalty box, then the ball would go towards the right side of the goal); and
4. Be bent.
According to the four benchmarks for shots taken from outside the penalty box, the optimal shot would:
1. Be on frame; 2. Be powerful;
3. ‘Move’ the goalie (i.e. the goalie had to dive or jump to reach the ball); and 4. Be bent.
For a shot to be considered an Awesome shot, the shot had to meet all four
4
benchmarks. This category was simply named Blocked. In addition, the outcome of the shot does not impact the quality category the shot falls into. In other words, if a Bad shot results in a goal, then it is still considered a Bad shot.
Shot and pass locations were recorded as well. More specifically, every shot and the two passes prior to every shot were labeled according to the area of the field they were taken in. The field is divided up into zones based on the area of the field’s proximity to the goal. More distinction is needed in areas closer to the goal because the opposing team will apply more pressure (thus reducing open space) as the
attacking team approaches the goal. Therefore, as shown in Figure 1.1, the closer the area of the field is to the goal, the more zones the area is split into. Finally, the total number of passes completed from the beginning of the team’s possession until the shot was recorded for every shot.
5
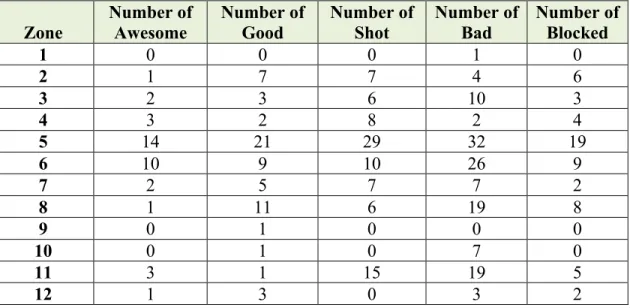
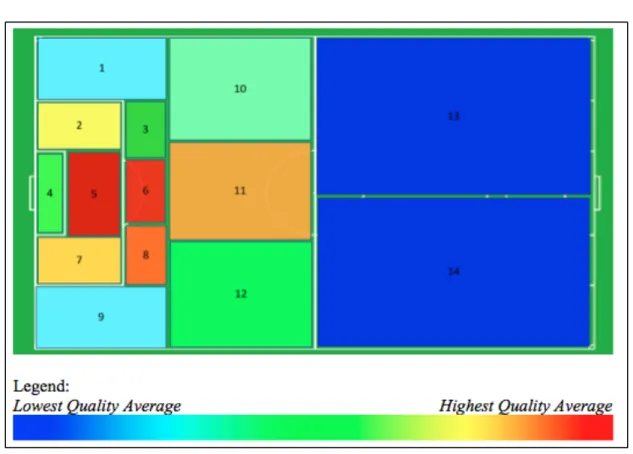
Shots were categorized based on which zone they were taken in. Table 1.1 shows the number of shots taken in each zone for each quality level. Figure 1.2 visually represents the average quality of shots taken in each zone. Once all of this information was compiled, hypothesis tests were performed on different population proportions.
Table 1.1 Amount of Shots Taken in each Zone by Quality Level
Zone
Number of Awesome
Number of Good
Number of Shot
Number of Bad
Number of Blocked
1 0 0 0 1 0
2 1 7 7 4 6
3 2 3 6 10 3
4 3 2 8 2 4
5 14 21 29 32 19
6 10 9 10 26 9
7 2 5 7 7 2
8 1 11 6 19 8
9 0 1 0 0 0
10 0 1 0 7 0
11 3 1 15 19 5
6
Figure 1.2 Average Shot Quality in each Zone
Data Analysis
7
To conduct the hypothesis tests, first the standard error (SE) was calculated by using the formula given below:
SE(𝑝1 – 𝑝2) = !!!!!! ! !!!
! !!
(1.1)
Next, the test statistic (z-value) was calculated using the following formula: z-value = !"(!!!!!!
!!!!) (1.2)
Finally, the corresponding p-value for the tests were found by using the =1-NORMSDIST(z-value) function on Microsoft® Excel. This p-value was multiplied by 2 when the hypothesis test was two-tailed.
According to Rosner’s (2016) procedure for a two-sample test for proportions outlined in his book Fundamentals of Biostatistics, a normal approximation is valid to estimate the p-value if the following equations are satisfied (375):
(𝑝!(1−𝑝!))𝑛! ≥ 5 (1.3) and
8 Limitations
The data collection methodology contains a few limitations. Since Sportscode does not give Cartesian coordinates or any other exact measure of player and ball location, the zones for shots and passes were recorded based on my best judgment. Similarly, deciding if a shot meets the criterions assigned to the quality levels depended on my best judgment.
9
LITERATURE REVIEW
Skeptics of sports analytics will commonly say that the only number that matters in sports is the final score. However, these skeptics fail to realize that other numbers can help discover the best strategies for scoring. This literature review specifically examines work done in the field of soccer analytics that tries to decipher which strategies lead to goals and wins. More specifically, the literature review will examine particular passing strategies and shooting characteristics and how each relate to scoring and winning.
Passing Strategies
Analyzing ideal passing strategies is imperative for all soccer teams. Chris Anderson and David Sally (2013) wrote in their book, The Numbers Game: Why Everything You Know About Football is Wrong, “The single most common action
players perform are passes in all shapes and sizes: short, long, with the head or the foot, crosses, goal kicks, flick-ons, lay-offs – passes account for well over 80 per cent of events on the pitch” (254). This section will examine three distinct passing
10 Number of Passes
According to Hughes and Franks (2005), longer pass sequences have more shots and goals per possession than shorter pass sequences. In other words, the more passes a team completes in a possession, the more likely the team is to shoot in that possession. However, the conversion rate of goals per shot is higher for possessions of four or less passes than possessions of five or more passes. This finding is
supported by Lucey (2015), who determined that shots taken during counter-attacks, which are quick transition possessions with few passes, have the highest conversion rate amongst all types of attacks excluding penalty kicks. All of these findings beg the following questions:
• Is it more beneficial for teams to complete shorter sequences of passes because more shots are converted to goals in shorter pass sequences?
• Is it more beneficial for them to complete longer sequences of passes because more total shots are created in longer pass sequences?
Castellano, Casamichana, and Lago (2012) and Jones, James, and Mellalieu (2004) answer these questions by finding that the longer teams can keep possession of the ball, the more likely the teams are to win the game. This finding indicates that teams would benefit more from completing longer sequences of passes than shorter
11
sequences is a driver of winning, the total number of passes completed before a shot is only one of a few critical aspects of passing strategies.
Location of Passes
The point of origin of passes and where the passes end up are vital in soccer because an underlying principle of the sport is to keep the ball on the opponent’s side of the field for as long as possible. Using NCAA women’s soccer data, Heiner, Fellingham, and Thomas (2013) found that out of thirty-five different offensive actions, successful passes into the penalty box and corner kicks were associated with higher probability of scoring than the other actions. Caley’s article (2015) takes this finding one step further. He found that passes played from within the penalty box to another area of the penalty box lead to a higher probability of scoring than passes from outside the penalty box. These findings make sense intuitively because
successful passes completed close to the goal are more likely to lead to shots close to the goal.
Despite the intuition supporting Heiner, Fellingham, and Thomas’ and Caley’s work, Scoulding, James, and Taylor (2004) found conflicting results. More
12 Type of Passes
A pass can be made in a variety of ways. For example, a pass can be in the air, on the ground, from a close distance, or from a far distance. Passes can also come from open-play (regular possession of the ball) or set pieces (passes coming after a rule infringement by the opposing team). Mara, Wheeler, and Lyons (2012) found some key insights regarding the type of passes that lead to the highest frequency of goals. For instance, they determined that most goals (around 60%) came from
conventional passes played on the ground. However, balls crossed in the air from the wide areas of the field were more likely to result in goals than conventional passes. In other words, balls crossed in the air have a higher success rate than conventional passes played on the ground. These findings support Heiner, Fellingham, and Thomas’ (2013), Lucey’s (2015), and Caley’s (2015) work because the final destination of the balls crossed from wide areas is typically inside the penalty area. The final destination of conventional passes, on the other hand, is usually just an open teammate, not a certain area of the field. The ultimate goal of passes is to find a teammate who can take a high-quality shot on goal. The next section will detail how certain shooting characteristics relate to scoring and winning.
Shooting Characteristics
13
eleven percent chance of going in is overly simplistic. This section examines how the location of the shot and the frequency of shots play a crucial role in determining a team’s scoring and winning ability.
Location of Shots
Previous research regarding the location of shots supports an intuitive conclusion: the closer the shot is to the goal, the more likely the shot will go in. However, this intuition is not as clear-cut as one would imagine. Armatas and Yiannakos (2010) analyzed every game from the 2006 World Cup and found that only about 15% of goals came from outside of the penalty area. Of the 85% that came within the penalty area, however, only about 32% of those goals came inside of the goal area, which is the small box immediately in front the goal. In other words, most goals come from inside the penalty area, but outside of the area closest to the goal. This finding supports the idea that there could be such a thing as a shot taken too close to the goal. If a shot is taken at such a close distance, then it is perhaps easier for the goalie to defend.
Regardless of the location of the shot, every single shot has a certain probability of going in the goal. As a consequence, different teams have different strategies regarding whether they should simply take the as many shots as possible or if they should try to take the best shots possible. In other words, teams have to
14 Frequency of Shots
Castellano, Casamichana, and Lago (2012) determined that volume of shots is a key indicator of winning. They analyzed games from three separate World Cups and found that the metrics with the greatest discriminatory power (i.e. metrics that best distinguish between winning and losing teams) are total shots and total shots on goal. Essentially, teams that take more shots and put more shots on target are more likely to win. Ward (2015) took this analysis one step further and determined that the volume of shots taken within 15-yards of the goal is one of the best indicators of winning. He found a positive correlation between number of shots taken in this area and winning, and a negative correlation between number of shots allowed in this area and winning.
No research could be found that breaks down shots into different quality levels. Therefore, an analysis of shot quality versus shot quantity could not be performed. However, enough literature has been written to make general comments about ideal passing strategies and shooting characteristics.
Summary
My research will include a component of shots that has never been examined in previous soccer analytics journals. More specifically, my research will differentiate shots by different quality levels. Previous research has only ever examined shot locations, frequencies, and conversion rates. Based on some of the previous research examined in this literature review, a couple of key passing strategies have been found:
15
• Passes successfully completed inside the penalty area lead to the best opportunities for scoring goals
Based on these two findings, my research strives to discover whether longer sequences of passes lead to higher quality shots and which areas of the field are leading to the most successfully completed passes inside of the penalty area for the UNC Women’s Soccer Team.
16
SHOT ANALYSIS
Before addressing the main results of this paper and the analysis completed to come to those results, a few areas should be addressed. First, some terminology that will be used for the rest of the paper needs to be introduced. Any shot referred to as a ‘high quality’ shot means that the shot was categorized as either an Awesome or a Good shot. Any shot referred to as a ‘low quality’ shot means that the shot was
categorized as either a Shot or a Bad shot. Second, the use of shot quality instead of goals for all the analysis performed needs to be validated.
17
Table 3.1 Amount of Shots and Goals for each Shot Quality Category Shot Quality Shots Goals Proportion of Goals per Shot
Awesome 31 28 0.90
Good 56 12 0.21
Shot 86 2 0.02
Bad 129 0 0.00
The first hypothesis test for population proportions examined the difference in proportion of goals for Awesome versus Good shots. The following null and
alternative hypothesis were used:
Ho: Proportion of Awesome shots converted into goals ≤ Proportion of Good shots converted into goals
H1: Proportion of Awesome shots converted into goals > Proportion of Good shots converted into goals
The hypothesis test was conducted by inserting the following parameter values into Equations 1.1 and 1.2:
n1 = 31, n2 = 56, 𝑝1 = 0.90, 𝑝2 = 0.21, 𝑝c = 0.46 The standard error, test statistic, and p-value were found to be:
SE = 0.1116; z-value = 6.1750; p-value = 3.308*10-10
This p-value is much smaller than the significance value (𝛼 = 0.05). Therefore, the null hypothesis is rejected and the alternative is accepted. In other words, goals were significantly more likely to occur from Awesome shots than from Good shots.
Similar analysis was done comparing the proportion of goals coming from Good shots to the proportion of goals coming from Shot shots:
18
H1: Proportion of Good shots converted into goals > Proportion of Shot shots converted into goals
The variables used in Equations 1.1 and 1.2 were as follows:
n1 = 56, n2 = 86, 𝑝1 = 0.21, 𝑝2 = 0.02, 𝑝c = 0.10 The standard error, test statistic, and p-value were found to be:
SE = 0.0512; z-value = 3.7318; p-value = 9.5054*10-5
This p-value is also smaller than the significance value (𝛼 = 0.05). Therefore, the null hypothesis is again rejected and the alternative is accepted. In other words, the
proportion of goals for Good shots is significantly greater than the proportion of goals for Shot shots.
Finally, the proportion of goals for Shot shots is compared against the proportion of goals for Bad shots:
Ho: Proportion of Shot shots converted into goals ≤ Proportion of Bad shots converted into goals
H1: Proportion of Shot shots converted into goals > Proportion of Bad shots converted into goals
The variables used in Equations 1.1 and 1.2 were as follows:
n1 = 86, n2 = 129, 𝑝1 = 0.02, 𝑝2 = 0.00, 𝑝c = 0.009 The standard error, test statistic, and p-value were found to be:
SE = 0.0134; z-value = 1.7402; p-value = 0.0409
19
The last two hypothesis tests conducted were in violation of Equations 1.3 and 1.4. In other words, the normal approximation is invalid for these tests. However, in order to still justify the use of high quality shots as a proxy for goals, a hypothesis test comparing the proportion of goals for high quality shots to the proportion of goals for low quality shots is conducted as follows:
Ho: Proportion of high quality shots converted into goals ≤ Proportion of low quality shots converted into goals
H1: Proportion of high quality shots converted into goals > Proportion of low quality shots converted into goals
The variables used in Equations 1.1 and 1.2 were as follows:
n1 = (31 + 56), n2 = (86 +129), 𝑝1 = 0.46, 𝑝2 = 0.01, 𝑝c = 0.14 The standard error, test statistic, and p-value were found to be:
SE = 0.0440; z-value = 10.2455; p-value = 0.0000
The p-value is obviously lower than the significance value (α = 0.05). Therefore, the null hypothesis is rejected and the alternate hypothesis is accepted. In other words, the proportion of goals for high quality shots is significantly greater than the proportion of goals for low quality shots. In addition, this hypothesis test is in accordance with Equations 1.3 and 1.4.
20 Location of Shots
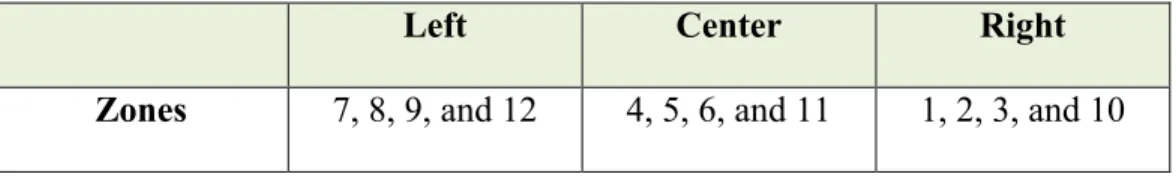
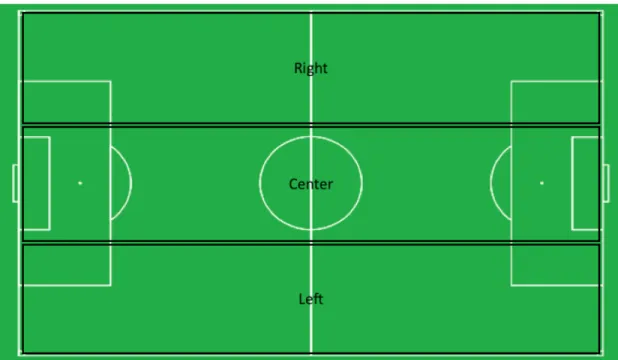
As covered in the second chapter, every shot taken by the UNC Women’s Soccer team during the 2015 season was categorized based on which zone it was taken in and its quality level (Table 1.1). Most high quality shots came from the zones in front of and central to the goal. More specifically, the two zones with the most high and low quality shots are zones 5 and 6, which are both directly in front of the goal. To differentiate shots based on their location, zones were grouped together based on the third of the field they are located relative to the goal. Table 3.2 categorizes each zone based on which third of the field they are located, and Figure 3.1 shows what each third visually looks like on the field of play. Table 3.3 shows the proportion of high quality shots out of total shots for each third of the field.
Table 3.2 Third of the Field each Zone is Located in
Left Center Right
21
Figure 3.1 Thirds of the Field
Table 3.3 Proportion of High Quality Shots in each Third of the Field
Left Center Right
Total Shots 66 204 49
Total High Quality
Shots 24 63 14
Total Low Quality
Shots 42 141 35
Proportion of High
Quality Shots .36 .31 .29
Proportion of Low
Quality Shots .64 .69 .71
22
hypothesis test for the different population proportions. First, I tested if the proportion of high quality shots were different between the left third and the right third:
Ho: Proportion of high quality shots in the left third = Proportion of high quality shots in the right third
H1: Proportion of high quality shots in the left third ≠ Proportion of high quality shots in the right third
The following variables were used for Equations 1.1 and 1.2:
n1 = 66, n2 = 49, 𝑝1 = 0.36, 𝑝2 = 0.29, 𝑝c = 0.33 Finally, the standard error, test statistic, and p-value were found to be:
SE = 0.0887; z-value = 0.8785; p-value = 0.3796
Since the p-value is greater than the significance value (𝛼 = 0.05), the null hypothesis cannot be rejected and therefore no conclusions can be made regarding the difference in proportion of high quality shots for the left third of the field versus the right third of the field.
Next, I similarly tested to see if the proportion of high quality shots taken in the left third of the field is different than the proportion of these shots taken in the center third of the field:
Ho: Proportion of high quality shots in the left third = Proportion of high quality shots in the center third
H1: Proportion of high quality shots in the left third ≠ Proportion of high quality shots in the center third
The following variables were used for Equations 1.1 and 1.2:
n1 = 66, n2 = 204, 𝑝1 = 0.36, 𝑝2 = 0.31, 𝑝c = 0.32 The standard error, test statistic, and p-value were found to be:
23
Since the p-value is greater than the significance value (𝛼 = 0.05), the null hypothesis cannot be rejected and therefore no conclusions can be made regarding the difference in proportion of high quality shots for the left third of the field versus the center of the field.
Finally, just to ensure that indeed the proportion of high quality shots taken from the center of the field is not significantly different from the right third of the field, another hypothesis test for population proportions was conducted with the following null and alternative hypothesis:
Ho: Proportion of high quality shots in the center third = Proportion of high quality shots in the right third
H1: Proportion of high quality shots in the center third ≠ Proportion of high quality shots in the right third
The following variables were used for Equations 1.1 and 1.2:
n1 = 204, n2 = 49, 𝑝1 = 0.31, 𝑝2 = 0.29, 𝑝c = 0.30 The standard error, test statistic, and p-value were found to be:
SE = 0.0732; z-value = 0.3157; p-value = 0.7522
Since the p-value is greater than the significant value (𝛼 = 0.05), the null hypothesis cannot be rejected, as expected.
24
and the previous analysis is that a one-tailed hypothesis test was used here instead of a two-tailed test because based on Armatas and Yiannakos’ (2010) results, shots taken from inside the penalty area are expected to be higher quality than shots taken from outside the penalty area. Figure 3.2 highlights the zones that are located inside and outside of the penalty area
Figure 3.2 Zones Inside and Outside of Penalty Box
Out of all non-blocked shots, 151 of them occurred inside the penalty area with 55 of them being high quality. Another 168 shots occurred outside the penalty area with 46 of them being high quality. Below is the hypothesis test for proportions of high quality shots taken inside versus outside the penalty box:
25
H1: Proportion of high quality shots inside the penalty box > Proportion of high quality shots outside the penalty box
The following variables were used for Equations 1.1 and 1.2:
n1 = 151, n2 = 168, 𝑝1 = 0.36, 𝑝2 = 0.27, 𝑝c = 0.32 The standard error, test statistic, and p-value were found to be:
SE = 0.0522; z-value = 1.7336; p-value = 0.0415
This p-value is below the 5% significance value, and thus the null hypothesis is rejected and the alternative is accepted. In other words, the proportion of high quality shots taken inside the penalty box is significantly greater than the proportion of high quality shots taken outside the penalty box.
26
PASS LOCATION ANALYSIS
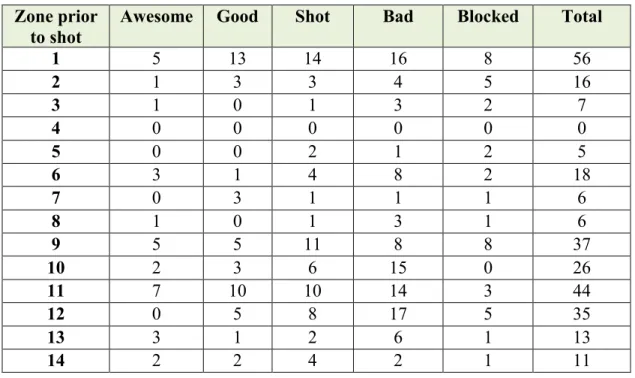
As mentioned in the second chapter, the zone in which the pass was made prior to each shot taken was recorded. This information was first collected in order to see if there were specific areas where high quality shots in general were being fed passes from. Table 4.1 shows how many times a pass came from each zone prior to every category level of shot. Zone 1, which is the far upper-right zone of the field, had the most shots come after a pass out of all the zones. Zone 9, which is the far upper-left zone of the field, saw 19 fewer shots being taken after a pass was made from that zone. More shots coming after passes from the right side of the field can be explained by the fact that most players on the UNC Women’s Soccer team are right-footed, and crossing the ball from the right side of the field is easier for a right footed player than crossing the ball from the left side of the field.
27
Table 4.1 Amount of Passes from each Zone Prior to Shots Zone prior
to shot
Awesome Good Shot Bad Blocked Total
1 5 13 14 16 8 56
2 1 3 3 4 5 16
3 1 0 1 3 2 7
4 0 0 0 0 0 0
5 0 0 2 1 2 5
6 3 1 4 8 2 18
7 0 3 1 1 1 6
8 1 0 1 3 1 6
9 5 5 11 8 8 37
10 2 3 6 15 0 26
11 7 10 10 14 3 44
12 0 5 8 17 5 35
13 3 1 2 6 1 13
14 2 2 4 2 1 11
Table 4.2 Proportion of High/Low Quality Shots coming off Passes from each Zone
Zone prior to shot High Quality Proportion Low Quality Proportion
1 0.32 0.54
2 0.25 0.44
3 0.14 0.57
4 0.00 0.00
5 0.00 0.60
6 0.22 0.67
7 0.50 0.33
8 0.17 0.67
9 0.27 0.51
10 0.19 0.81
11 0.39 0.55
12 0.14 0.71
13 0.31 0.62
28 Does Pass Location Affect Shot Quality?
Using the information from Tables 4.1 and 4.2, the zones were then grouped together based on which third of the field they were located. The total number and percentage of high and low quality shots that occurred after a pass from each third of the field was found and is shown in Table 4.3. This table and subsequent analysis does not include blocked shots.
Table 4.3 Amount and Proportion of High/Low Quality Shots coming off Passes from each Third of the Field
Zone prior to shot Number of High Quality Shots Number of Low Quality Shots Number of Shots Proportion of High Quality Shots Proportion of Low Quality Shots
Left 19 50 69 .28 .72
Center 21 39 60 .35 .65
Right 28 62 90 .31 .69
To find out if the proportion of high quality shots coming after a pass from a particular third is higher than the proportion from another third, more hypothesis tests for population proportions were conducted. First, the left third’s proportion was compared to the right third’s proportion using the following null and alternative hypothesis:
Ho: Proportion of high quality shots after a pass from the right third =
Proportion of high quality shots after a pass from the left third H1: Proportion of high quality shots after a pass from the right third ≠
Proportion of high quality shots after a pass from the left third The following variables were used for Equations 1.1 and 1.2:
29
The standard error, test statistic, and p-value were found to be:
SE = 0.0730; z-value = 0.4896; p-value = 0.6244
Since the p-value is greater than the significance value (𝛼 = 0.05), the null hypothesis cannot be rejected.
Next, the proportion of high quality shots coming after a pass from the left third was compared to the proportion coming from the center third:
Ho: Proportion of high quality shots after a pass from the center third = Proportion of high quality shots after a pass from the left third
H1: Proportion of high quality shots after a pass from the center third ≠ Proportion of high quality shots after a pass from the left third
The following variables were used for Equations 1.1 and 1.2:
n1 = 60, n2 = 69, 𝑝1 = 0.35, 𝑝2 = 0.28, 𝑝c = 0.31 The standard error, test statistic, and p-value were found to be:
SE = 0.0816; z-value = 0.9142; p-value = 0.3606
Since the p-value is greater than the significance value (𝛼 = 0.05), the null hypothesis cannot be rejected.
Finally, the proportion of high quality shots coming after a pass from the right third was compared to the proportion coming from the center third:
Ho: Proportion of high quality shots after a pass from the center third = Proportion of high quality shots after a pass from the right third
H1: Proportion of high quality shots after a pass from the center third ≠ Proportion of high quality shots after a pass from the right third
The following variables were used for Equations 1.1 and 1.2:
30
SE = 0.0782; z-value = 0.4975; p-value = 0.6188
Since the p-value is greater than the significance value (𝛼 = 0.05), the null hypothesis cannot be rejected.
None of the proportions of high quality shots coming after a pass from specific third of the field were significantly different than one another. In other words, there was no significant advantage for the UNC Women’s Soccer Team to receive a pass from one specific third of the field over the other thirds. This analysis, however, only takes into consideration where the pass came from, not where the pass went. The previous chapter found that shots taken inside the penalty box were
significantly more likely to be a high quality shot than shots coming from outside of the penalty box. Therefore, perhaps the proportion of high quality shots coming from a specific third is significantly greater if the fact that shots taken inside the penalty box are more likely to be high quality was taken into consideration. The next section specifically analyzes this possibility.
Considering Shot Location, does Pass Location Affect Shot Quality?
31
Table 4.4 Amount and Proportion of High/Low Quality Shots taken in the Penalty Box from each Third of the Field
Ball Path Number of High Quality Shots Number of Low Quality Shots Total Number of Shots Proportion of High Quality Shots Proportion of Low Quality Shots Left Third to
Penalty Box 11 30 41 .27 .73
Right Third to Penalty
Box 16 35 51 .31 .69
Center Third to Penalty
Box
11 12 23 .48 .52
To find out if the proportion of high quality shots in the penalty box coming after a pass from a particular third is higher than the proportion of such shots after a pass from a different third, more hypothesis tests for population proportions were performed. First, the left third’s proportion was compared to the right third’s proportion using the following null and alternative hypothesis:
Ho: Proportion of high quality shots in the penalty box after a pass from the right third = Proportion of high quality shots in the penalty box after a pass
from the left third
H1: Proportion of high quality shots in the penalty box after a pass from the right third ≠ Proportion of high quality shots in the penalty box after a pass
from the left third The following variables were used for Equations 1.1 and 1.2:
n1 = 51, n2 = 41, 𝑝1 = 0.31, 𝑝2 = 0.27, 𝑝c = 0.29 The standard error, test statistic, and p-value were found to be:
32
Since the p-value is greater than the significance value (𝛼 = 0.05), the null hypothesis cannot be rejected.
Next, the proportion of high quality shots taken inside the penalty box coming after a pass from the left third was compared to the proportion coming from the center third:
Ho: Proportion of high quality shots in the penalty box after a pass from the center third = Proportion of high quality shots in the penalty box after a pass
from the left third
H1: Proportion of high quality shots in the penalty box after a pass from the center third ≠ Proportion of high quality shots in the penalty box after a pass
from the left third The following variables were used for Equations 1.1 and 1.2:
n1 = 23, n2 = 41, 𝑝1 = 0.48, 𝑝2 = 0.27, 𝑝c = 0.34 The standard error, test statistic, and p-value were found to be:
SE = 0.1237; z-value = 1.6969; p-value = 0.0897
The p-value is greater than the significance value (𝛼 = 0.05); therefore the null
hypothesis cannot be rejected. However, it is worth noting that this p-value is below a 10% significance value (𝛼 = 0.1). Since the sample size of shots taken inside the penalty box following a pass is rather limited (n = 115), there is still value in the fact that this hypothesis test is significant at the 10% significance level. In other words, passes from the center third of the field into the penalty area seem to lead to more high quality shots than passes from the left third of the field into the penalty area.
33
Ho: Proportion of high quality shots in the penalty box after a pass from the center third = Proportion of high quality shots in the penalty box after a pass
from the right third
H1: Proportion of high quality shots in the penalty box after a pass from the center third ≠ Proportion of high quality shots in the penalty box after a pass
from the right third The following variables were used for Equations 1.1 and 1.2:
n1 = 23, n2 = 51, 𝑝1 = 0.48, 𝑝2 = 0.31, 𝑝c = 0.48 The standard error, test statistic, and p-value were found to be:
SE = 0.1209; z-value = 1.361; p-value = 0.1734
Since the p-value is greater than the significance value (𝛼 = 0.05), the null hypothesis cannot be rejected.
If a 10% significance level is used, then the only statistically significant result was that the proportion of high quality shots taken inside the penalty box after a pass from the center third of the field is greater than the proportion of such shots after a pass from the left third of the field. This result implies that for the UNC Women’s Soccer Team, passes sent into the penalty box from the center third of the field were more likely to lead to high quality shots than passes sent from the left third of the field. Given a larger sample size, this result might also hold true for the center third compared to the right third. I would recommend that the team place a greater
34
NUMBER OF PASSES ANALYSIS
35
Table 5.1 Amount and Proportion of High and Low Quality Shots for Long and Short Pass Sequences
Pass Sequence Length Number of High Quality Shots Number of Low Quality Shots Number
of Shots Proportion of High Quality Shots Proportion of Low Quality Shots Short Sequence (0-4 passes)
69 164 233 .30 .70
Long Sequence
(5+ passes) 15 19 34 .44 .56
To see if the difference between the proportions of high quality shots for short and long pass sequences is statistically significant, a hypothesis test for population proportions was conducted as follows:
Ho: Proportion of high quality shots following a long pass sequence ≤ Proportion of high quality shots following a short pass sequence
H1: Proportion of high quality shots following a long pass sequence > Proportion of high quality shots following a short pass sequence The following variables were input into Equations 1.1 and 1.2 as follows:
n1 = 34, n2 = 233, 𝑝1 = 0.44, 𝑝2 = 0.30, 𝑝c = 0.31 The standard error, test statistic, and p-value were found to be:
SE = 0.0852; z-value = 1.701; p-value = 0.0444
36
A couple of observations can be made concerning the result of the hypothesis test. First, this conclusion supports Hughes and Franks (2005), Castellano,
Casamichana, and Lago (2012), and Jones, James, and Mellalieu’s (2004) findings: longer pass sequences are more beneficial to teams than shorter pass sequences. For the UNC Women’s Soccer team specifically, longer pass sequences are more beneficial because shots coming after these sequences are more likely to be high quality. In addition, the more of these sequences the team completes, the less time the opposing team has with the ball in their possession.
Second, although the result implies that the UNC Women’s Soccer Team should try their best to string together long pass sequences before a shot, the fact that they had nearly seven times as many shots coming after a short pass sequence than shots after a long pass sequence indicates that the team had a much easier time shooting the ball after only a few passes. This indication makes sense intuitively because the more passes a team tries to complete, the more opportunities there are for the other team to steal the ball and prevent a shot. Also, completing long pass
sequences is simply harder than completing short pass sequences.
37
which would support Lucey’s findings. In the future, the shots could be categorized further based on categories similar to the ones Lucey (2015) used to be able to make more specific distinctions within long and short pass sequences.
A potential lurking variable could be partially responsible for the conclusion that longer pass sequences having a statistically significant higher proportion of high quality shots than short pass sequences. More specifically, a weak defensive team that gives up more long passing sequences than most teams could also give up more high quality shots than most teams. Weak defensive teams might be poor at preventing long pass sequences for a variety of reasons, such as the players not being as fast, skilled, and/or experienced. Lacking one or all of these factors could hinder a team’s ability to prevent high quality shots as well because if an offensive player is given more time to shoot the ball, then she can be more diligent about making sure her shot meets all of the criteria. In summary, a team that is bad at keeping the ball from the other team might also be bad at disrupting the other team’s shots.
If this idea is true, then one reason for UNC’s long passing sequences having a larger percentage of high quality shots than short sequences is because UNC was able to complete a large portion of their long passing sequences that lead to high quality shots against weaker opponents. Since my research did not factor in who the opponent was for each passing sequence, no conclusive statements can be made about this idea. There is evidence, however, that weaker teams were worse at preventing high quality shots than stronger teams.
38
39
CONCLUSION
Various hypothesis tests were performed in this paper. Below is a summary of the conclusions that could be made for the UNC Women’s Soccer Team based on these hypothesis tests:
• The higher the quality of shot, the more likely the shot is to be a goal
• High quality shots were significantly more likely to occur inside the penalty box
• Shots in the penalty box were significantly more likely to be high quality shots if they were preceded by a pass from the center of the field than the left third of the field
• Shots were significantly more likely to be high quality if they came after a string of five or more consecutive passes
The first conclusion makes sense intuitively. The higher the quality of the shot, the more likely the shot is to go in the back of the net. The second conclusion also makes intuitive sense because a player is more likely to at least put her shot on frame if she is closer to the goal.
40
pass the ball. When the ball is in either the left or right third of the field, a player is much more likely to pass the ball since shooting from the sides is more difficult given the angle of the ball to the goal. Therefore, the defending team is more likely to anticipate a pass and be able to disrupt a shot that follows a pass from the left or right side of the field.
Future Work
In the future, more analysis can be done if shots are given more context than just their location and quality. For example, the player who shot the ball and the opposing team could be identified for each shot. Labeling shots in this manner can allow for specific player analysis and for contextualizing shots based the strength of the opposing team. In addition, shots can be given more context if the score and time remaining in the game were considered. Considering these two factors would account for situations where the opposing team might intentionally change their strategy in order to score a goal or prevent a goal. For example, if the opposing team is up by one goal with a few minutes to play, then the losing team typically has a harder time to score because the winning team puts additional players on defense.
Using the data collected, linear regression could be applied to analyze the relationship between the number of passes the UNC Women’s Soccer Team completed before taking a shot and the shot quality. This analysis could help
41
42
REFERENCES
Albright, Winston, & Zappe (2006). Hypothesis Testing. In Data Analysis &
Decision Making with Microsoft® Excel (3rd ed.) (pp. 487–560). Mason, OH: Thomson South-Western.
Anderson, C., & Sally, D. (2013). The goal: Football’s rare beauty. In The Numbers Game: Why Everything You Know About Football is Wrong (pp. 118–164). Toronto, Ontario: Penguin Group.
Armatas, V., & Yiannakos, A. (2010). Analysis and evaluation of goals scored in 2006 World Cup. Journal of Sport and Health Research, 2(2),119-128. Caley, M. (2015, May 15). Barcelona, Arsenal, Eden Hazard and the art of danger
zone passing. [Web article]. Retrieved from
http://www.espnfc.us/blog/tactics-and- analysis/67/post/2427824/barcelona-arsenal-attacks-excel-due-to-danger-zone-passing
Castellano, J., Casamichana, D., & Lago, C. (2012). The use of match statistics that discriminate between successful and unsuccessful soccer teams. Journal of Human Kinetics, 31(1), 139–147.
Heiner, M., Fellingham, G. W., & Thomas, C. (2013). Skill importance in women’s soccer. Journal of Quantitative Analysis in Sports, 10(2), 287–302. doi: 10.1515/jqas-2013-0119
Hughes, M., & Franks, I. (2005). Analysis of passing sequences, shots and goals in soccer. Journal of Sports Sciences, 23(5), 509–514. doi:
10.1080/02640410410001716779
Jones, P. D., James, N. & Mellalieu, S. D. (2004). Possession as a performance indicator in soccer. International Journal of Performance Analysis of Sport, 4(1), 98–102.
Lucey, P. (2015).“Quality vs Quantity”: Improved Shot Prediction in Soccer using Strategic Features from Spatiotemporal Data. Retrieved from
http://www.sloansportsconference.com/wp-content/uploads/2015/02/SSAC15-RP-Finalist-Quality-vs-Quantity.pdf
43
Rankings – NCAA Women's Soccer RPI. (2015). Retrieved from
http://www.ncaa.com/rankings/soccer-women/d1/ncaa-womens-soccer-rpi Rosner, B. (2016). Hypothesis Testing: Categorical Data. In Fundamentals of
Biostatistics (8th ed.) (pp. 375). Boston, MA: Cengage Learning.
Scoulding, A., James, N., and Taylor, J. (2004). Passing in the soccer World Cup 2002. International Journal of Performance Analysis in Sport, 4(2), 36-41. Ward, D. (2015, July 7). Converting dangerous passes into shots. [Web article].