Low-Income Housing Tax Credit Allocation
in North Carolina:
New Construction versus Historic Adaptive Reuse
By Karla Rosenberg
“A Master’s Project submitted to the faculty of the University of North Carolina at Chapel Hill in partial fulfillment of the requirements for the degree of Master of City and Regional Planning in the Department of City and Regional Planning.”
Chapel Hill
2012
1
Acknowledgments
Many thanks to Mark Shelburne, general counsel for the North Carolina Housing Finance Agency, for his role as the genesis of this project and for generously lending his time and attention from start to finish. His assistance was invaluable in creating a research theme of value to his agency, collecting pro forma data to support my research, and reviewing the final product.
Many thanks to Dr. Roberto Quercia, professor of City and Regional Planning and director of the Center for Community Capital at UNC-CH, who served as my advisor during this project, guided and reviewed my work, and offered me support, encouragement, and great ideas.
Thank you to Kevin Parks, graduate research assistant at the Center for Community Capital, for his assistance in securing and interpreting data from the HMDA database.
2
Table of Contents
Introduction ... 3
The Low-income Housing Tax Credit ... 5
The Historic Preservation Tax Credit ... 7
Twinning Credits ... 8
Literature Review ... 11
NCHFA Study ... 13
Methodology ... 14
Analysis ... 17
Construction Costs ... 17
Estimated Operating Costs ... 18
Actual Operating Costs ... 19
Community Impact ... 21
Case Study ... 32
Further Research ... 44
Conclusion ... 45
3
Introduction
A scarcity in affordable housing has reached a crisis level in North Carolina and across the
United States, precipitated by a monumental economic recession. In 1999, the demand for
affordable rental units for extremely low-income tenants nationwide exceeded supply by 1.9 million
(Houghton, 2010). By 2008, this number had increased to 3.1 million (National Low-income Housing
Coalition, 2010), and by 2012, 6.4 million (NLIHC, 2012). Employment cuts and subsequent income
losses have created conditions such that the number of Americans spending more than 50% of their
income on housing is higher than ever. Policy makers have addressed the issue over the past several
decades by financing nearly 2 million low-income rental units through the Low-income Housing Tax
Credit (LIHTC) program (Ernst & Young, 2009). The LIHTC, created under the Tax Reform Act of
1986, leverages private investment toward the production of affordable housing by reducing the tax
liability of developers who reserve a percentage of their units for low- to extremely low- income
residents. The LIHTC program is viewed as the most successful affordable housing program to date
in the United States (Christians, 1999).
At the same time that we face a shortage of affordable housing in our country, we also
confront an overabundance of historic structures lying vacant throughout our towns and cities.
Nearly 500 structures listed individually on the National Register of Historic Places in North Carolina
are currently vacant; many hundreds of other vacant properties may be National Register-eligible or
hold local historic value for smaller communities. Many of these structures are abandoned schools,
hospitals, and mills (NRHP, 2012). In their state of abandonment, many of these cultural artifacts
are swiftly deteriorating. If put to reuse, these structures could offer considerable opportunities for
mitigating the housing shortage and enriching our public landscape, as well as potentially enhancing
property values and recharging the real estate market in depressed urban areas. This paper is
4 environment benefits from central revitalization. For more on this topic, refer to Brueckner, Mills,
and Kremer (2001).
Recognizing the potential for a mutual solution for the two issues of affordable housing and
historic preservation, federal policy makers passed legislation through the Housing and Economic
Recovery Act (HERA) of 2008 that encouraged state officials to prioritize the adaptive reuse of
historic structures in the production of affordable housing through the LIHTC program. New
provisions for the LIHTC program passed through HERA indicate that both energy efficiency and
historic character must be two substantive factors considered during the selection process for all
competitive LIHTC proposals submitted after December 31, 2008. Every state that has not already
done so must amend its qualified allocation plan (QAP) to include this requirement, starting in 2009
(Milder & Potts, 2008).
The North Carolina Housing Finance Agency (NCHFA), the entity responsible for allocating
the LIHTC in our state, is interested in learning whether or not adaptive reuse is economically more
productive than new construction. This paper will examine the fiscal costs and community impacts
of LIHTC-funded historic adaptive reuse and new construction projects since 2003. Twelve adaptive
reuse projects and twelve comparable new construction projects have been compared and
contrasted, considering estimated building and operating costs per unit and the proportion of
NCHFA funds invested in each project. Public loan data reported under the Home Mortgage
Disclosure Act (HMDA) provide an overview of the community context and impact of LIHTC
developments within the census tracts surrounding each project. A site visit to Mebane Mill in
Alamance County, the most recently financed LIHTC project, and three professional interviews with
a developer, a builder, and a city council member, provide additional perspective on the
5
The Low-Income Housing Tax Credit
Legislation for the LIHTC was passed through the Federal Tax Reform Act of 1986 under
President Ronald Reagan. The program followed on the heels of many years of programs subsidizing
capital cost, rent, and interest; it was favored for its ability to leverage private investment for
affordable housing projects, where private money would otherwise not have been spent. The
private market power of this tax incentive program has created more affordable housing units than
any other public program (Christians, 1999).
The program works by distributing federal funds from the Internal Revenue Service (IRS) to
state Housing Finance Agencies (HFAs), which are required to allocate these funds to in-state
affordable housing developers as either 4% or 9% credits. The name of each credit refers to the
approximate annual percentage of eligible project costs that may be claimed on federal tax returns
for a 10-year period. The two credits differ in terms of their final value and method of acquisition
(U.S. Treasury, 2008).
The 4% credit, which is the lesser known of the two, is automatically awarded to any
developer-applicant whose project meets general affordable housing guidelines. It is primarily used
to cover construction and/or acquisition costs for the renovation of existing buildings. The value of
the credit varies based on project and market conditions but typically covers approximately
one-quarter of total project costs. This credit has no cap as to the number issued in each state and is not
the version examined in this study (U.S. Treasury, 2008).
The 9% credit covers about half of total project costs and is capped for each state based on
the total number of residents ($1.75 per resident, adjusted for inflation as of 2003). It is obtained by
developers through a competitive application process based on criteria set forth in each state’s QAP.
Designed by the HFA of each state, the QAP reflects federal guidelines pertaining to the location,
6 adhere to these guidelines via a point system. The NCHFA typically approves between 25% and 30%
of LIHTC applications submitted each year (U.S. Treasury, 2008).
To qualify for the 9% LIHTC, a developer must rent at least 20% of the project’s units to
tenants who are at or below 50% of AMI or at least 40% of the units to tenants at or below 60% of
AMI for a 15-year holding period plus 15 years beyond. Because the credit is apportioned on a
per-unit basis, developers typically devote 100% of a project’s per-units to income-qualified tenants, as this
enables them to collect the highest possible credit. Once selected for the credit, the developer
claims all eligible costs (which may include costs of acquisition, construction, and some site
planning) to receive an award that equals the present value of 70% of eligible costs at the time of
the award. This figure ordinarily fluctuates with interest rates, but a separate HERA policy currently
holds it at 70%, with an imposed floor that is due to expire in 2014. A developer may claim the
LIHTC directly, but most choose to sell the tax credit to private investors in exchange for cash, which
can be directed back into the project. Raising capital reduces the amount of debt that must be
leveraged, which increases profit margins and allows developers to offer more affordable rents once
the project is completed (Shelburne, 2011).
HERA’s decision to require states to prioritize the adaptive reuse of historic structures
through the QAP encourages developers to select adaptive reuse projects over new construction.
Prior to the passage of HERA, only 21 states made special considerations for the adaptive reuse of
historic buildings through their QAPs. The strategy allows the government to address two public
policy issues at one time: affordable housing and historic preservation. It also allows developers to
look beyond the LIHTC to an additional tax credit source—the Historic Preservation Tax Credit—at
7
The Historic Preservation Tax Credit
The Historic Preservation Tax Credit originated with the passage of the 1976 Tax Act, which
created a tax deduction for preservation easements. This policy grew to encompass a federal tax
credit of 15–25% for historic properties through the Economic Recovery Tax Act of 1981 and was
subsequently scaled back with the 1986 Tax Reform Act, which (a) reduced the credit to 20%, (b)
reserved the credit for income-producing properties only, and (c) required that rehabilitation efforts
and expenditures on the property be substantial. While historic rehabilitation projects boomed in
1985, their numbers dwindled after the passage of the 1986 Act.
Several years later, individual states began to implement their own tax credit programs to
promote historic preservation. North Carolina was a leader in the creation of the state historic
preservation tax credit, which it launched in 1998 at a rate of 20% for income-producing, historic
structures and 30% for non-income producing structures. It also created a mill credit of 30%–40%
for industrial buildings, according to county economic development tier. These policies have
prompted a much higher level of preservation activity in North Carolina since that date (NCSHPO,
2012). Today, 30 other states have also created state historic preservation tax credit (HPTC)
programs.
In order to qualify for the HPTCs, developers must follow the Secretary of the Interior’s
Standards of Rehabilitation and buildings must be designated as historic by the National Park
Service, either individually or as contributing structures within a historic district. Once the building
has been classified as historic, affordable housing developers in North Carolina are able to declare
all qualified rehabilitation expenses (includes only rehabilitative construction, not new construction,
acquisition, or site development) for income-producing projects and receive 40% credit (20%
8
Twinning Credits
The twinning or layering of the LIHTC with either the HPTC or mill credit can provide a
powerful financial incentive for developers to select historical adaptive reuse projects for affordable
housing development. Depending on the method used to structure the transaction, the cost savings
can be substantial.
As of December 1, 2011, the price of the federal LIHTC on the private market (amount of
cash an investor is willing to pay per $1 of tax credit) was about $0.88; pricing for the federal HPTC
was $0.90. The price for the state HPTC was $0.50. The pricing disparity between the federal and
state HPTCs in part reflects the difference in value of each credit to the investor; the federal HPTC
may be collected in full the first year, while the state HPTC must be divided evenly over five years.
In addition, while normally the amount of state tax paid reduces federal tax liability, use of the state
HPTC reduces this benefit and thus the amount of the credit.
In a typical single-tiered investment structure (using one set of investors), the amount of
HPTC awarded must first be subtracted from the LIHTC’s qualified basis, thus decreasing the amount
of LIHTC awarded. The following example compares the amount of cost savings earned from the
federal LIHTC alone versus in combination with the HPTC on a $10 million adaptive reuse project,
using a single-tiered structure:
• In a “single tier” deal with both credits –
HPTC: $10m × 20% × .90 = $1.8m
LIHTC: ($10m – $2m) × 90% × .88 = $6.37m
Total = $8.136m
• In a “single tier” deal with one credit –
LIHTC: $10m × 90% × .88 = $7.92m
9 Section 50(d)(5) of the Internal Revenue Code (IRC) as applied to Section 48(d) of the pre-1986
IRC calls for a special two-tiered investor structure that eliminates the reduction of the LIHTC basis
when combining the two credits. This structure calls for two sets of investors (or LLCs), one of which
acts as landlord, owning 99.99% of the property and claiming the LIHTC; the other acts as master
tenant, owning .01% of the property and claiming the HPTC. When bypassing the LIHTC
basis-reduction on a combined credit deal, the developer’s tax credit is calculated as follows:
• Two-tier deal with both credits –
HPTC: $10m × 20% × .90 = $1.8m
LIHTC: $10m × 90% × .88 = $7.92m
Total = $9.72m
A two-tiered investor structure that twins the LIHTC and HPTC could thus raise $1.8 million in
10
Literature Review
Rosenthal and Listokin (2009) conducted a study examining the economic efficiency of the
LIHTC in adaptive reuse and new construction projects in California, recognizing that for many years
new construction had been favored over rehabilitation in the production of affordable housing
through the LIHTC program. In fact, as of 2009, 60% of all LIHTC units in California were the
products of new construction rather than rehabilitation. The team found that “the cost advantages
of rehab are substantial throughout the nation as a whole and in California.” The study identified
North Carolina as one of four states in the country to achieve greater per-unit rehab-cost savings
than California. In other states, such as Virginia, the cost savings for new construction were greater.
The study does not, however, equate housing rehabilitation with adaptive reuse. Housing
rehabilitation takes existing housing and rehabilitates it for new habitants. Adaptive reuse, which
alters a mill, factory, warehouse, hospital, school building, or other structure to serve a different
purpose, can elevate expenses further. Generally, the easiest structures to reuse are mills, factories,
and warehouses, which offer an open layout, whereas the most difficult are schools, and particularly
hospitals, which contain numerous interior partitions. A structure’s original use will to some extent
dictate the level of rehabilitation necessary to adapt for modern residential use.
Rosenthal & Listokin describe three levels of rehabilitation: the cosmetic rehab, the
moderate rehab, and the gut rehab. On one end of the spectrum, the cosmetic rehab retains all
systems in order and engages only in modest interventions, such as replacement of window panes,
installation of molding, changing of carpets, etc. On the other end of the spectrum, the gut rehab
removes all existing systems and interior frameworks to create new ones. The moderate rehab calls
for more modest replacements than the gut approach, but improves the building in more than
substantial ways than the cosmetic approach. The gut approach is often the most costly method of
11 the study found that on some projects, even the gut approach can cost less than new construction
(Rosenthal & Listokin, 2009).
A separate study conducted by the National Association of Home Builders (NAHB) examines
the economic impact of LIHTC properties on local communities throughout three phases of
development. Recognizing that new apartment buildings can generate (a) jobs and income for local
residents during construction (phase I), (b) business activities for local businesses once this income is
spent (phase II), and (c) tax revenue for local governments once apartments are occupied (phase III),
the NAHB created a model to quantify the economic impact of LIHTC projects specifically. It based
the input of its model on 100-unit LIHTC projects located in an average city in the United States and
determined the following impacts:
(First year, during development)
$7.9 million in local income
$827,000 in taxes and other revenue for local governments
122 local jobs
(Second year, after completion and annually recurring thereafter)
$2.4 million in local income
$441,000 in taxes and other revenue for local governments
30 local jobs
The study acknowledges that a 100-unit project is larger than the national average (7 units)
for LIHTC projects. It does not distinguish between new construction and adaptive reuse projects,
and it also limits the above findings to family projects, excluding those for the elderly. A related
NAHB study revealed the following findings for elderly projects, which tend to have smaller sized
units: $7.3 million in local income, $768,000 in tax and other revenue for local government, and 113
12 local governments, and 32 local jobs in the second year and each year thereafter. Nevertheless, the
model represents a worthwhile attempt to value the local impact of LIHTC developments in
communities in general. The LIHTC model distinguishes itself from a market-rate version by
assuming lower expenditures from lower-income tenants in the marketplace, although this is
somewhat compensated for by a tendency of lower-income tenants toward locally produced goods
and services. The model can be applied to assess the impact of specific projects in any community
and could presumably be amended further to study the differing impacts of new construction versus
adaptive reuse (NAHB, 2010).
A number of developers across the country have received recognition for successfully
combining the LIHTC and HPTC to create affordable housing in historic structures through adaptive
reuse. Literature on these types of projects goes back nearly two decades, with a book of case
studies published by the National Park Service titled Affordable Housing through Historic
Preservation: A Case Guide to Combining the Tax Credits (Delvac, Escherich, & Hartman, 1994).
More recently, Common Ground in New York City has won both local and national awards for
rehabilitating turn-of-the century landmarks and converting them into hundreds of affordable
housing units; projects included the McBurney YMCA building, the Andrews Hotel, and the Time
Square Hotel (Dymi, 2002).
While studies thus far have examined the project costs and community impacts of LIHTC
projects generally, as well as assessing new construction versus rehabilitation, none have compared
the specific project types of new construction versus historic adaptive reuse. The following study
will examine these project types, assessing costs and impacts using data supplied by the NCHFA. In
addition, while current published case studies on affordable housing and adaptive reuse highlight
13
NCHFA Study
The NCHFA is a public state agency whose mission, as stated on its website, is to “create
affordable housing opportunities for North Carolinians whose needs are not met by the market.” It
was established in 1973 as one of 50 state housing finance agencies (HFAs)—one for each state—
created starting in the late 1960s to relieve the federal government of the financial and
administrative burdens associated with affordable housing provision, which had become a source of
public discontent due to problems associated with the classical public housing model. The
responsibility of the HFAs was to find alternative methods for providing affordable housing,
leveraging funds from the private market.
The HFAs assumed two basic roles from the outset that continue today: (a) financing low-
and moderate-income housing production and ownership through the sale of tax-exempt bonds to
private investors and (b) administering federal housing finance programs, which have come to
include the HOME, Section 8, HOPWA, McKinney-Vento, and HMIS programs, as well as the LIHTC
program addressed in this study (Scally, 2009).
Every year the HFAs receive a set amount of funds from the federal government to be
distributed to new, in-state affordable housing projects as LIHTCs. This amount is set at $2.15 per
capita, per state, as of 2012, which amounts to $21 million in North Carolina (NCHFA, 2012). The
NCHFA directs this funding toward the financing of approximately 2,000 units of affordable housing
per year (down from 2,500 prior to 2008) (Shelburne, 2011). With a rapidly rising need for
affordable housing units and the ever-looming threat of fiscal constraints, the NCHFA is looking to
minimize costs and create maximum impact with its dollars. The following study examines two
14
Methodology
Using data provided by the NCHFA, 12 of North Carolina’s most recent LIHTC-financed, adaptive
reuse projects since 2003 (the year after which NCHFA’s records are most complete) were matched
with 12 comparable new construction projects. Several factors were considered when creating the
comparables to maximize the fit between projects both in terms of project characteristics and the
nature of the surrounding communities. These factors included the following:
number of units in project;
type, or target population, of project (family or elderly);
county population, 2009;
county median household income, 2009;
percentage of housing units in multi-family structures, 2005–2009; and
retail sales per capita, 2009.
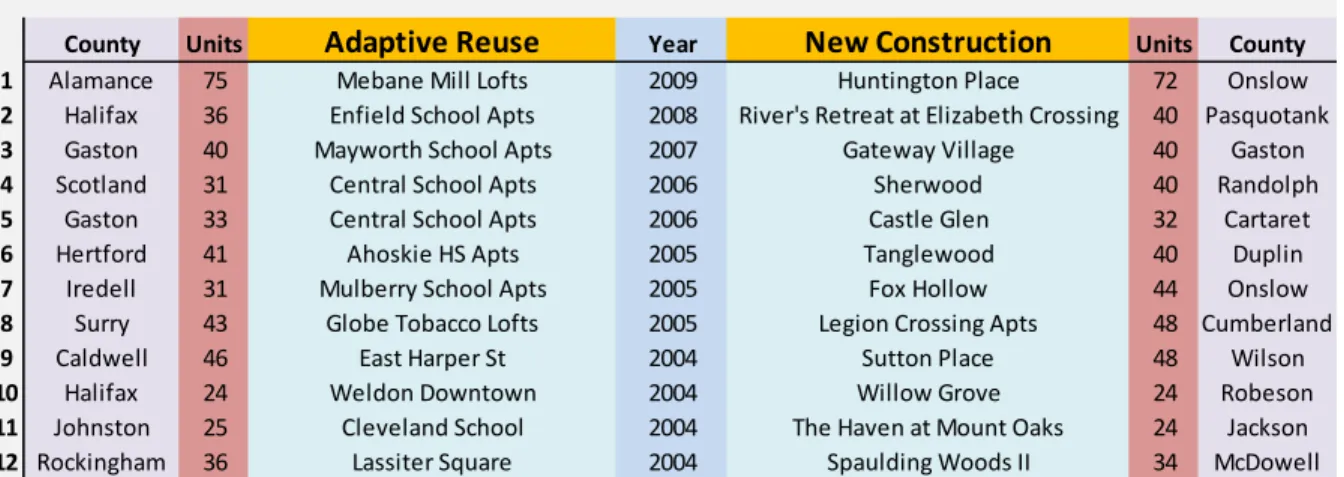
Table 1 shows the list of comparables used for this study, organized by year, including the number of
units accommodated in the development and the county where each is located.
Table 1
List of Comparables
County Units Adaptive Reuse Year New Construction Units County
1 Alamance 75 Mebane Mill Lofts 2009 Huntington Place 72 Onslow
2 Halifax 36 Enfield School Apts 2008 River's Retreat at Elizabeth Crossing 40 Pasquotank
3 Gaston 40 Mayworth School Apts 2007 Gateway Village 40 Gaston
4 Scotland 31 Central School Apts 2006 Sherwood 40 Randolph
5 Gaston 33 Central School Apts 2006 Castle Glen 32 Cartaret
6 Hertford 41 Ahoskie HS Apts 2005 Tanglewood 40 Duplin
7 Iredell 31 Mulberry School Apts 2005 Fox Hollow 44 Onslow
8 Surry 43 Globe Tobacco Lofts 2005 Legion Crossing Apts 48 Cumberland
9 Caldwell 46 East Harper St 2004 Sutton Place 48 Wilson
10 Halifax 24 Weldon Downtown 2004 Willow Grove 24 Robeson
11 Johnston 25 Cleveland School 2004 The Haven at Mount Oaks 24 Jackson
15 Once comparables were established, financial and property data were collected from the pro
forma of each project to provide an overview of the funding sources used to cover each project’s
construction costs:
Rental Production Program (RPP) loans;
bank loans;
federal LIHTC award;
state LIHTC loan;
Historic Preservation Tax Credit (HPTC) award (federal and state, combined);
State Mill Credit award;
local funding; and
other funding.
These construction costs were then divided by the number of units in each project to determine the
total building cost per unit. Next, NCHFA’s investment in each property was isolated by calculating
the amount of the federal LIHTC award alone, which represents a permanent investment, as well as
combined with the RPP and state LIHTC loans, which will eventually be paid back by the developer.
Estimated operating costs were also collected from the pro formas and divided into the
following categories:
administrative expenses,
utilities expenses,
operating maintenance and expenses, and
taxes and insurance.
Estimated operating costs were provided by each developer upon submission of the LIHTC
application and do not represent the actual operations costs of a development after it is placed into
service. Actual operations costs were collected for only a small number of the projects and may be
useful for gauging the accuracy of original estimates, as well as for conducting limited studies over
16 To assess community impact, public loan data reported under the Home Mortgage
Disclosure Act (HMDA) was collected for the census tract surrounding each project for the years
2004 to 2010. These data were compressed by year and project type and categorized by:
mean income of loan applicant,
mean loan amount,
total loans generated,
rate of owner-occupancy, and
percentage of multi-family housing.
Graphs were generated for each of these variables to show the economic context of communities
with new construction projects versus those with adaptive reuse projects, and how these contexts
have changed over time.
Additionally, vacancy data generated by the U.S. Postal Service (USPS) were obtained from
the U.S. Department of Housing and Urban Development (HUD) for each census tract containing a
project that originated before 2006. These data cover the period of 2005 to 2011, indicating the
total number of addresses, as well as the number of vacant addresses, within each census tract on a
quarterly basis. A vacancy rate was calculated from these data and tracked over time based on
construction type.
Finally, a site visit to Mebane Mill Lofts in Alamance County and interviews with two
17
Analysis
Construction Costs
Data analysis (Table 2) showed that building costs are significantly higher for LIHTC-funded
adaptive reuse projects than for new construction in North Carolina. Average building cost per unit
for adaptive reuse projects was $154,063, compared to $101,772 for new construction; this disparity
represented a 51% premium for adaptive reuse. A far smaller gap existed, however, in the amount
invested by the NCHFA for each development type. When considering the federal LIHTC alone, the
NCHFA invested $79,071 per unit for adaptive reuse projects versus $72,847 for new construction,
representing only a 9% premium for adaptive reuse. The gap grows smaller still when accounting
for the investment in Rental Production Program (RPP) and state LIHTC loans, which will eventually
be paid back to the state by the developer. These investments per unit, when combined with the
federal LIHTC, were $104,462 and $99,699 respectively, representing a premium of only 5%.
Table 2
Development Costs and Financing
Adaptive Reuse
Development
Costs Federal LIHTC State LIHTC (Loan) RPP (Loan) Units
Building Cost / Unit
NCHFA Cost/ Unit (Fed only)
NCHFA Cost/ Unit (Fed, State, RPP)
1 Mebane Mill Lofts $ 12,354,847.00 $ 5,476,693.00 $ 882,004.00 75 $ 164,731.29 $ 73,022.57 $ 84,782.63 2 Enfield School Apts $ 5,794,454.00 $ 3,170,727.00 $ 1,065,000.00 36 $ 160,957.06 $ 88,075.75 $ 117,659.08 3 Mayworth School Apts $ 5,826,378.00 $ 3,191,034.00 $ 876,884.00 40 $ 145,659.45 $ 79,775.85 $ 101,697.95 4 Central School Apts $ 5,275,170.00 $ 2,397,720.00 $ 1,448,452.00 31 $ 170,166.77 $ 77,345.81 $ 124,070.06 5 Central School Apts $ 4,693,896.00 $ 2,384,012.00 $ 756,980.00 33 $ 142,239.27 $ 72,242.79 $ 95,181.58 6 Ahoskie HS Apts $ 7,394,857.00 $ 3,731,798.00 $ 1,422,373.00 41 $ 180,362.37 $ 91,019.46 $ 125,711.49 7 Mulberry School Apts $ 4,550,784.00 $ 3,022,819.00 $ 378,962.00 31 $ 146,799.48 $ 97,510.29 $ 109,734.87 8 Globe Tobacco Lofts $ 8,169,715.00 $ 3,648,474.00 $ 1,504,514.00 43 $ 189,993.37 $ 84,848.23 $ 119,836.93 9 East Harper St $ 5,535,391.00 $ 2,885,152.00 $ 771,509.00 46 $ 120,334.59 $ 62,720.70 $ 79,492.63 10 Weldon Downtown $ 4,072,983.00 $ 1,969,163.00 $ 854,906.00 24 $ 169,707.63 $ 82,048.46 $ 117,669.54 11 Cleveland School $ 3,381,028.00 $ 1,673,171.00 $ 233,528.00 25 $ 135,241.12 $ 66,926.84 $ 76,267.96 12 Lassiter Square $ 4,412,077.00 $ 2,639,253.00 $ 1,012,603.00 36 $ 122,557.69 $ 73,312.58 $ 101,440.44
5,955,131.67
$ $ 3,015,834.67 $ 922,065.00 $ 1,065,000.00 38 $ 154,062.51 $ 79,070.78 $ 104,462.10
New Construction
Development
Costs Federal LIHTC State LIHTC (Loan) RPP (Loan) Units
Building Cost / Unit
NCHFA Cost/ Unit (Fed only)
NCHFA Cost/ Unit (Fed, State, RPP)
1 Huntington Place $ 7,355,291.00 $ 5,754,237.00 $ 1,382,346.00 $ 853,988.00 72 $ 102,156.82 $ 79,919.96 $ 110,980.15 2 River's Retreat at Elizabeth Crossing $ 4,609,829.00 $ 3,496,780.00 $ 660,399.00 40 $ 115,245.73 $ 87,419.50 $ 103,929.48 3 Gateway Village $ 4,215,719.00 $ 3,100,834.00 $ 864,785.00 40 $ 105,392.98 $ 77,520.85 $ 99,140.48 4 Sherwood $ 3,752,674.00 $ 2,671,979.00 $ 676,159.00 $ 622,771.00 40 $ 93,816.85 $ 66,799.48 $ 99,272.73 5 Castle Glen $ 3,220,620.00 $ 2,244,772.00 $ 558,979.00 $ 159,159.00 32 $ 100,644.38 $ 70,149.13 $ 92,590.94 6 Tanglewood $ 4,839,085.00 $ 3,602,684.00 $ 1,411,401.00 40 $ 120,977.13 $ 90,067.10 $ 125,352.13 7 Fox Hollow $ 4,271,608.00 $ 2,850,903.00 $ 707,088.00 $ 879,956.00 44 $ 97,082.00 $ 64,793.25 $ 100,862.43 8 Legion Crossing Apts $ 3,903,448.00 $ 2,644,352.00 $ 724,106.00 $ 494,900.00 48 $ 81,321.83 $ 55,090.67 $ 80,486.63 9 Sutton Place $ 4,458,070.00 $ 2,804,292.00 $ 698,547.00 $ 744,719.00 48 $ 92,876.46 $ 58,422.75 $ 88,490.79 10 Willow Grove $ 2,932,315.00 $ 2,237,381.00 $ 844,648.00 24 $ 122,179.79 $ 93,224.21 $ 128,417.88 11 The Haven at Mount Oaks $ 2,336,721.00 $ 1,799,901.00 $ 330,790.00 24 $ 97,363.38 $ 74,995.88 $ 88,778.79 12 Spaulding Woods II $ 3,135,023.00 $ 1,895,802.00 $ 759,210.00 34 $ 92,206.56 $ 55,758.88 $ 78,088.59
4,085,866.92
18
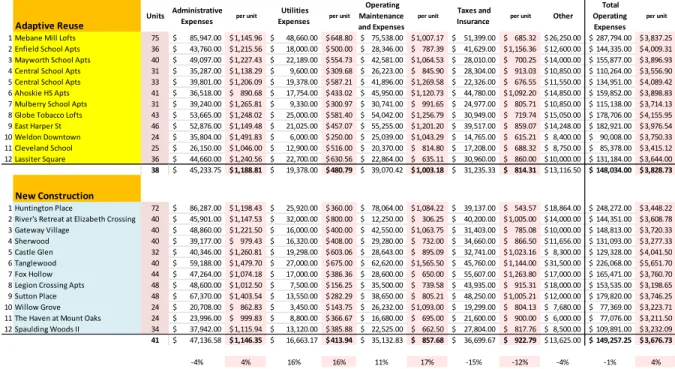
Estimated Operating Costs
Total estimated operations costs varied far less than construction costs between the two
building types (see Table 3). Adaptive reuse projects as a whole cost 1% less to operate than new
construction projects; they cost 4% more to operate than new construction on a per-unit basis
(3,828.73 versus $3,676.73). This disparity is likely due to the slightly higher core or common factor
found in historic buildings, where fewer living units make room for larger hallways and lobbies. Of
these costs, utilities and operating maintenance/repair were estimated to be, respectively, 16% and
17% higher for adaptive reuse projects than for new construction. The annual estimated utilities
costs per unit for an adaptive reuse project averaged $482, while for a new construction project
they averaged $414; operations maintenance and repair costs averaged $1,006 versus $858.
Administrative costs for adaptive reuse were estimated to be 4% higher than for new construction,
while fees for taxes and insurance were estimated to be 13% lower.
Table 3: Operating Expenses
Adaptive Reuse
Units Administrative
Expenses per unit
Utilities Expenses per unit
Operating Maintenance and Expenses
per unit Taxes and
Insurance per unit Other
Total Operating Expenses
per unit 1 Mebane Mill Lofts 75 $ 85,947.00 $ 1,145.96 $ 48,660.00 $ 648.80 $ 75,538.00 $ 1,007.17 $ 51,399.00 $ 685.32 $ 26,250.00 $ 287,794.00 $ 3,837.25 2 Enfield School Apts 36 $ 43,760.00 $ 1,215.56 $ 18,000.00 $ 500.00 $ 28,346.00 $ 787.39 $ 41,629.00 $ 1,156.36 $ 12,600.00 $ 144,335.00 $ 4,009.31 3 Mayworth School Apts 40 $ 49,097.00 $ 1,227.43 $ 22,189.00 $ 554.73 $ 42,581.00 $ 1,064.53 $ 28,010.00 $ 700.25 $ 14,000.00 $ 155,877.00 $ 3,896.93 4 Central School Apts 31 $ 35,287.00 $ 1,138.29 $ 9,600.00 $ 309.68 $ 26,223.00 $ 845.90 $ 28,304.00 $ 913.03 $ 10,850.00 $ 110,264.00 $ 3,556.90 5 Central School Apts 33 $ 39,801.00 $ 1,206.09 $ 19,378.00 $ 587.21 $ 41,896.00 $ 1,269.58 $ 22,326.00 $ 676.55 $ 11,550.00 $ 134,951.00 $ 4,089.42 6 Ahoskie HS Apts 41 $ 36,518.00 $ 890.68 $ 17,754.00 $ 433.02 $ 45,950.00 $ 1,120.73 $ 44,780.00 $ 1,092.20 $ 14,850.00 $ 159,852.00 $ 3,898.83 7 Mulberry School Apts 31 $ 39,240.00 $ 1,265.81 $ 9,330.00 $ 300.97 $ 30,741.00 $ 991.65 $ 24,977.00 $ 805.71 $ 10,850.00 $ 115,138.00 $ 3,714.13 8 Globe Tobacco Lofts 43 $ 53,665.00 $ 1,248.02 $ 25,000.00 $ 581.40 $ 54,042.00 $ 1,256.79 $ 30,949.00 $ 719.74 $ 15,050.00 $ 178,706.00 $ 4,155.95 9 East Harper St 46 $ 52,876.00 $ 1,149.48 $ 21,025.00 $ 457.07 $ 55,255.00 $ 1,201.20 $ 39,517.00 $ 859.07 $ 14,248.00 $ 182,921.00 $ 3,976.54 10 Weldon Downtown 24 $ 35,804.00 $ 1,491.83 $ 6,000.00 $ 250.00 $ 25,039.00 $ 1,043.29 $ 14,765.00 $ 615.21 $ 8,400.00 $ 90,008.00 $ 3,750.33 11 Cleveland School 25 $ 26,150.00 $ 1,046.00 $ 12,900.00 $ 516.00 $ 20,370.00 $ 814.80 $ 17,208.00 $ 688.32 $ 8,750.00 $ 85,378.00 $ 3,415.12 12 Lassiter Square 36 $ 44,660.00 $ 1,240.56 $ 22,700.00 $ 630.56 $ 22,864.00 $ 635.11 $ 30,960.00 $ 860.00 $ 10,000.00 $ 131,184.00 $ 3,644.00
38 $ 45,233.75 $ 1,188.81 $ 19,378.00 $ 480.79 $ 39,070.42 $ 1,003.18 $ 31,235.33 $ 814.31 $ 13,116.50 $ 148,034.00 $ 3,828.73
New Construction
1 Huntington Place 72 $ 86,287.00 $ 1,198.43 $ 25,920.00 $ 360.00 $ 78,064.00 $ 1,084.22 $ 39,137.00 $ 543.57 $ 18,864.00 $ 248,272.00 $ 3,448.22 2 River's Retreat at Elizabeth Crossing 40 $ 45,901.00 $ 1,147.53 $ 32,000.00 $ 800.00 $ 12,250.00 $ 306.25 $ 40,200.00 $ 1,005.00 $ 14,000.00 $ 144,351.00 $ 3,608.78 3 Gateway Village 40 $ 48,860.00 $ 1,221.50 $ 16,000.00 $ 400.00 $ 42,550.00 $ 1,063.75 $ 31,403.00 $ 785.08 $ 10,000.00 $ 148,813.00 $ 3,720.33 4 Sherwood 40 $ 39,177.00 $ 979.43 $ 16,320.00 $ 408.00 $ 29,280.00 $ 732.00 $ 34,660.00 $ 866.50 $ 11,656.00 $ 131,093.00 $ 3,277.33 5 Castle Glen 32 $ 40,346.00 $ 1,260.81 $ 19,298.00 $ 603.06 $ 28,643.00 $ 895.09 $ 32,741.00 $ 1,023.16 $ 8,300.00 $ 129,328.00 $ 4,041.50 6 Tanglewood 40 $ 59,188.00 $ 1,479.70 $ 27,000.00 $ 675.00 $ 62,620.00 $ 1,565.50 $ 45,760.00 $ 1,144.00 $ 31,500.00 $ 226,068.00 $ 5,651.70 7 Fox Hollow 44 $ 47,264.00 $ 1,074.18 $ 17,000.00 $ 386.36 $ 28,600.00 $ 650.00 $ 55,607.00 $ 1,263.80 $ 17,000.00 $ 165,471.00 $ 3,760.70 8 Legion Crossing Apts 48 $ 48,600.00 $ 1,012.50 $ 7,500.00 $ 156.25 $ 35,500.00 $ 739.58 $ 43,935.00 $ 915.31 $ 18,000.00 $ 153,535.00 $ 3,198.65 9 Sutton Place 48 $ 67,370.00 $ 1,403.54 $ 13,550.00 $ 282.29 $ 38,650.00 $ 805.21 $ 48,250.00 $ 1,005.21 $ 12,000.00 $ 179,820.00 $ 3,746.25 10 Willow Grove 24 $ 20,708.00 $ 862.83 $ 3,450.00 $ 143.75 $ 26,232.00 $ 1,093.00 $ 19,299.00 $ 804.13 $ 7,680.00 $ 77,369.00 $ 3,223.71 11 The Haven at Mount Oaks 24 $ 23,996.00 $ 999.83 $ 8,800.00 $ 366.67 $ 16,680.00 $ 695.00 $ 21,600.00 $ 900.00 $ 6,000.00 $ 77,076.00 $ 3,211.50 12 Spaulding Woods II 34 $ 37,942.00 $ 1,115.94 $ 13,120.00 $ 385.88 $ 22,525.00 $ 662.50 $ 27,804.00 $ 817.76 $ 8,500.00 $ 109,891.00 $ 3,232.09
41 $ 47,136.58 $ 1,146.35 $ 16,663.17 $ 413.94 $ 35,132.83 $ 857.68 $ 36,699.67 $ 922.79 $ 13,625.00 $ 149,257.25 $ 3,676.73
19
Actual Operating Costs
While estimated operations costs may offer a reasonable picture of what a developer can
expect to pay during the early operations of a project, they do not account for the changes in
operating costs that may occur as time progresses and buildings begin to wear at a faster rate. As
buildings advance in age, materials and systems may function less efficiently, need higher levels of
upkeep, or even require replacing. These costs are dependent upon the quality of the original
systems and materials.
Records of actual operating costs for each development were limited in availability, but
three sets of comparable developments did supply actual data for their first 4 to 5 years. Actual
operations expenses were revealed to be grossly underestimated in most cases, such that by the
end of the 4 to 5 years, operations expenses were costing much more than originally projected.
New construction projects underestimated average annual expenses by approximately 150%, while
adaptive reuse projects underestimated by 250%. Adaptive reuse projects, however, appeared to
maintain more consistent operating expenses over time; total operating costs of adaptive reuse
projects decreased on average 83% from the first year to subsequent years, while for new
construction projects, they increased by 110%. Both underestimated and runaway expenses could
create significant future problems for afflicted development projects, reducing the efficacy of the
LIHTC allocation model. The sample size used in this exercise is too small to draw any meaningful
conclusion linked to development type; however, the results that were produced overall underscore
the need to investigate operating expenses further, including methods of calculation and the ability
20
Community Impact
The assessment of a development’s economic impact should not stop at construction and
operation costs alone. New real estate projects can serve as catalysts for future development,
attracting new residents and capital, reducing vacancies, enhancing real estate values, creating jobs,
increasing local spending, and leading to economic growth at a community level. HMDA data
provide useful indicators for real estate activity and economic growth. Indicators such as income,
race, and gender of loan applicant; amount of loan; housing type; and tenure type are mandatorily
collected for each loan application that has been submitted to a financial institution, whether the
loan was originated or not. The reporting of public loan data under HMDA was mandated to help
policymakers to monitor the ability of financial institutions to meet the housing credit needs of their
communities, and to identify potential discriminatory lending patterns. However, it also serves to
assist researchers who wish to identify social and economic trends within specific geographic areas
on an annual basis.
A number of charts were produced from public loan data collected under HMDA, showing
the characteristics of loan transactions and borrowers located within the census tracts of the LIHTC
projects in this study. Ideally, each chart would demonstrate the changes that took place in the
local communities as a result of the development of specific LIHTC projects. However, the study
period is really too brief to make absolute determinations about the long-term growth and
sustainability of each community as a result of the projects. Furthermore, the economic crisis of
2008 has undoubtedly had an even larger impact on local communities than LIHTC projects alone,
thus skewing the results significantly. Instead, the charts may be more useful in describing the
community contexts into which new construction and adaptive reuse LIHTC projects have been
21 Among the projects sampled, adaptive reuse projects tended to be placed in smaller towns
and cities with less land area and lower population densities than new construction projects, which
were placed in larger cities; they also tended to be placed closer to town centers. The average
population of cities and townships where adaptive reuse projects were placed was 9,800, with an
average land area of 9 square miles and an average population density of 1,114 per square mile
(U.S. Census, 2010). Adaptive reuse projects were placed an average of 1.15 miles from city and
town centers, although this figure was skewed by an outlier of 9.1 miles; all but one adaptive reuse
project was located within 0.6 miles of the center (Google Maps, 2012). The average population of
cities and townships where new construction projects were placed was 24,635, with an average land
area of 17 square miles and an average population density of 1,324 per square mile. New
construction projects were located an average of 2.1 miles away from centers, with the majority at a
distance of about 4 miles.
At a census tract level, part of the story of adaptive reuse is told through small, depressed
urban areas with older housing stock, higher vacancy rates, lower per capita income, fewer job
opportunities, and limited access to public transportation. The fact that adaptive reuse projects are
more centrally located than new construction within their respective towns and cities has already
been shown. One further reality is that many of these towns and cities have struggled to maintain
economic relevance, often becoming bedroom communities for larger, adjacent cities; their centers
are begging for revitalization.
Another part of the story, however, shows that many older neighborhoods still do quite well
economically, and for those that do thrive, residents can enjoy many substantial benefits from living
in them. In general, older neighborhoods are located closer to potential job sites. According to
Rypkema (2003), American Community Survey data show that over 40% of residents in older and
22 neighborhoods. Data also show that older and historic neighborhoods typically offer greater access
to shopping (over 60% of older homes have shopping within 1 mile, compared to 40% of new ones)
and public transportation (nearly 60% of older homes have transportation nearby compared to 25%
of new ones). Affordable housing developments should target areas that offer low-income residents
greater access to these resources.
Historic neighborhoods can also offer greater social diversity in the hearts of towns and
cities due to wide market appeal and the plentiful variety of housing sizes, conditions, ages,
qualities, and prices often available. Maintaining diversity in a neighborhood is important to
creating a healthy, balanced community for future tenants that encourages cultural tolerance, social
mobility, and economic integration (Rypkema, 2003). A phenomenon believed to represent the
opposite of this goal is gentrification. While historic neighborhood revitalization is commonly
criticized for displacing lower-income residents, studies have shown that neighborhood
improvement actually stabilizes housing for current residents to a greater degree than it poses a
threat. Furthermore, the elevated vacancy rates in older neighborhoods increase the
neighborhood’s capacity to accommodate newer residents without displacing long-term residents
(Houghton, 2010).
Table 4 compares data from all the census tracts containing adaptive reuse projects with
those containing new construction; additional figures from North Carolina and the rest of the United
States are provided for perspective. The data show that, despite their central locations, adaptive
reuse sites had lower population densities than new construction sites, at 725 people per square
mile versus 765. In addition, the average number of housing units per tract was 2,928 versus 2,921;
average median age of housing structures was 1970 versus 1979; the vacancy rate averaged 12.9%
versus 10.9%; the unemployment rate was slightly higher at 5.8% versus 5.2%; and the per capita
23
Table 4
Census Tract Statistics
Statistics
All Selected Census Tracks All Selected Census Tracts SE:T1. Total Population
Total Population 6,754 6,984 9,045,705 301,461,533
SE:T2. Population Density (per sq. mile)
Total Population 6,754 6,984 9,045,705 301,461,533
Population Density (per sq. mile) 725 767 185.7 85.2
Area (Land) 25 23 48,710.88 3,537,438.54
SE:T13. Race
Total Population: 6,754 6,984 9,045,705 301,461,533
White Alone 4,294 63.6% 4,477 64.1% 6,375,420 70.5% 224,469,780 74.5%
Black or African American Alone 2,042 30.2% 1,757 25.2% 1,909,832 21.1% 37,264,679 12.4% American Indian and Alaska Native
Alone 52 0.8% 129 1.8% 101,986 1.1% 2,423,294 0.8%
Asian Alone 54 0.8% 96 1.4% 173,320 1.9% 13,201,056 4.4%
Native Hawaiian and Other Pacific
Islander Alone 3 0.0% 19 0.3% 4,716 0.1% 447,591 0.2%
Some Other Race Alone 215 3.2% 291 4.2% 328,726 3.6% 16,986,453 5.6%
Two or More races 95 1.4% 218 3.1% 151,705 1.7% 6,668,680 2.2%
SE:T21. Average Household Size
Average Household Size 2.5 2.5 2.5 2.6
SE:T25. Educational Attainment For Population 25 Years And Over
Population 25 Years and over: 4,305 4,337 5,940,248 197,440,772
Less Than High School 867 20.1% 942 21.7% 1,010,570 17.0% 30,445,177 15.4%
High School Graduate (includes
equivalency) 1,363 31.7% 1,273 29.4% 1,698,838 28.6% 57,861,698 29.3%
Some college 1,259 29.2% 1,363 31.4% 1,698,147 28.6% 54,768,720 27.7%
Bachelor's degree 625 14.5% 509 11.7% 1,025,576 17.3% 34,384,717 17.4%
Master's degree 147 3.4% 186 4.3% 356,405 6.0% 13,900,234 7.0%
Professional school degree 26 0.6% 40 0.9% 87,479 1.5% 3,850,948 2.0%
Doctorate degree 19 0.4% 24 0.6% 63,233 1.1% 2,229,278 1.1%
SE:T33. Employment Status For Total Population 16 Years And Over
Population 16 Years and over: 5,095 5,332 7,084,756 235,871,704
In labor force: 3,318 65.1% 3,353 62.9% 4,610,855 65.1% 153,407,584 65.0%
In Armed Forces 5 0.1% 156 2.9% 92,274 1.3% 1,134,555 0.5%
Civilian: 3,313 65.0% 3,197 60.0% 4,518,581 63.8% 152,273,029 64.6%
Employed 3,019 59.3% 2,919 54.7% 4,171,964 58.9% 141,303,145 59.9%
Unemployed 294 5.8% 278 5.2% 346,617 4.9% 10,969,884 4.7%
Not in labor force 1,778 34.9% 1,978 37.1% 2,473,901 34.9% 82,464,120 35.0%
SE:T83. Per Capita Income (In 2009 Inflation Adjusted Dollars)
Per capita income (In 2009 Inflation
adjusted dollars) $17,707 $18,751 $24,547 $27,041
SE:T93. Housing Units
Housing units 2,928 2,981 4,120,599 127,699,712
SE:T94. Tenure
Occupied Housing Units: 2,009 2,656 3,541,807 112,611,029
Owner Occupied 1,174 58% 1,620 61% 2,410,327 68.1% 75,320,422 66.9%
Renter Occupied 835 42% 1,036 39% 1,131,480 32.0% 37,290,607 33.1%
SE:T95. Occupancy Status
Housing units: 2,928 2,981 4,120,599 127,699,712
Occupied 2,551 87.1% 2,656 89.1% 3,541,807 86.0% 112,611,029 88.2%
Vacant 377 12.9% 325 10.9% 578,792 14.1% 15,088,683 11.8%
SE:T96. Vacancy Status By Type of Vacancy
Vacant Housing Units: 377 325 578,792 15,088,683
For rent 100 26.5% 59 18.2% 122,693 21.2% 3,216,053 21.3%
For sale only 50 13.3% 49 15.1% 59,305 10.3% 1,769,541 11.7%
Other vacant 227 60.2% 217 66.8% 396,794 68.6% 10,103,089 67.0%
SE:T98. Median Year Structure Built
Median year structure built 1970 1979 1983 1974
United States North Carolina
New Construction Adaptive Reuse
24
Table 4
Census Tract Statistics, cont.
U.S. Census data, 2010, Social Explorer (2005–2012)
Despite minor differences, such as per capita income and unemployment rates, as
previously mentioned, when compared to North Carolina as a whole, the areas are quite
comparable. While assessing this small 24-project sample may be helpful for gaining an
understanding of the differences between the communities where new construction projects and
adaptive reuse-projects have been placed, a full assessment of the entire list of each LIHTC
project-type in NCHFA’s portfolio since 2003 would be of still greater value.
Statistics
SE:T100. House Value For All Owner-Occupied Housing Units
Owner-occupied housing units: 1,677 1,620 2,410,327 75,320,422
Less than $20,000 72 4.3% 110 6.8% 107,597 4.5% 2,239,091 3.0%
$20,000 to $49,999 149 8.9% 135 8.3% 129,989 5.4% 4,012,240 5.3%
$50,000 to $99,999 404 24.1% 393 24.3% 496,115 20.6% 11,652,702 15.5%
$100,000 to $149,999 443 26.4% 448 27.7% 535,572 22.2% 11,873,304 15.8%
$150,000 to $299,999 539 32.1% 452 27.9% 772,279 32.0% 23,329,418 31.0%
$300,000 to $499,999 47 2.8% 61 3.8% 246,018 10.2% 12,653,659 16.8%
$500,000 to $749,999 10 0.6% 14 0.9% 75,485 3.1% 5,703,850 7.6%
$750,000 to $999,999 4 0.2% 5 0.3% 25,062 1.0% 2,054,948 2.7%
$1,000,000 or More 9 0.5% 2 0.1% 22,210 0.9% 1,801,210 2.4%
SE:T106. Average Gross Rent
Average gross rent for
Renter-occupied housing units $573 $596 $678 $856
SE:T128. Means Of Transportation To Work For Workers 16 Years And Over
Workers 16 Years and over: 2,962 3,015 4,145,113 138,541,405
Car, truck, or van 2,842 96.0% 2,849 94.5% 3,806,535 91.8% 119,763,043 86.5%
Public transportation (Includes
Taxicab) 5 0.2% 24 0.8% 44,735 1.1% 7,030,391 5.1%
Motorcycle 10 0.3% 4 0.1% 7,753 0.2% 301,418 0.2%
Bicycle 1 0.0% 10 0.3% 9,607 0.2% 687,199 0.5%
Walked 23 0.8% 47 1.6% 76,407 1.8% 3,964,813 2.9%
Other means 18 0.6% 23 0.8% 35,115 0.9% 1,219,225 0.9%
Worked at home 63 2.1% 58 1.9% 164,961 4.0% 5,575,316 4.0%
SE:T129. Travel Time To Work For Workers 16 Years And Over
Workers 16 Years and over: 2,962 3,015 4,145,113 138,541,405
Did not work at home: 2,899 97.9% 2,957 98.1% 3,980,152 96.0% 132,966,089 96.0%
Less than 10 minutes 526 17.8% 528 17.5% 563,209 13.6% 19,076,501 13.8%
10 to 19 minutes 747 25.2% 1,061 35.2% 1,314,635 31.7% 39,773,594 28.7%
20 to 29 minutes 509 17.2% 566 18.8% 896,050 21.6% 27,434,072 19.8%
30 to 39 minutes 549 18.5% 407 13.5% 624,627 15.1% 21,322,284 15.4%
40 to 59 minutes 403 13.6% 238 7.9% 371,261 9.0% 14,733,161 10.6%
60 to 89 minutes 109 3.7% 126 4.2% 139,899 3.4% 7,377,471 5.3%
90 or More minutes 56 1.9% 31 1.0% 70,471 1.7% 3,249,006 2.4%
Worked at home 63 2.1% 58 1.9% 164,961 4.0% 5,575,316 4.0%
United States North Carolina
New Construction Adaptive Reuse
25
Mean Income per Year
The chart below depicts changes in mean income per year for borrowers residing in census
tracts where adaptive-reuse projects were developed versus those containing new-construction
projects. At first glance, the chart shows a consistently higher mean income among borrowers in
census tracts containing new construction throughout the study period. For both project types,
from 2004 to 2007, income grew. By 2008, however, while the income of borrowers in census tracts
with new construction projects continued to grow, the income of borrowers in adaptive reuse
census tracts dipped instead.
Home Mortgage Disclosure Act data
The cause of the diverging effects on borrower mean income after 2008 may have less to do
with of LIHTC-project development types than with the onset of an economic crisis. Individuals with
lower incomes and levels of education tend to be hit harder than those with higher incomes and
education. The lack of resilience can be attributed to cyclical unemployment, which
disproportionately affects these groups (Gramlich, 1974).
It is clear, however, that, prior to the recession, the income of borrowers in both adaptive
reuse- and new construction-settings rose consistently through 2007. In fact, the income of
$54 $58 $59
$64 $64 $61 $61 $63 $64 $68 $70 $70
$73 $74
$10 $20 $30 $40 $50 $60 $70 $80
2004 2005 2006 2007 2008 2009 2010
In com e ($1 00 0s ) Year
Mean Income per Year
26 borrowers in adaptive reuse settings increased by 16%, while in new construction settings they
increased by only 10%. This might indicate that the area was seeing an influx of new homeowners
with higher incomes http://www.nchfa.com/About/facts/lihtcfactsheet.pdf or that current
homeowners were refinancing at higher incomes. In any case, one could argue that, given a
healthier economy, neighborhoods surrounding adaptive reuse projects show exceptional growth
potential.
Mean Loan Amount per Year
The next chart shows the average loan amount requested by borrowers in each set of
census tracts, including loans that were approved and not approved. The loan amount for new
construction tracts is, again, consistently higher than for adaptive reuse tracts. While the loan
amounts in new construction tracts continue to grow post-recession, the loan amounts in adaptive
reuse tracts dip very slightly.
Home Mortgage Disclosure Act data
The loan amounts reported under HMDA are tied to all loan application-types, including for
new home purchases, mortgage refinancing, and home improvement. For new construction tracts,
these numbers averaged 41%, 52%, and 7% respectively, across the period of 2004 to 2010. For
$80 $82 $86
$97 $99 $105 $103 $93 $97 $101
$116
$131 $139 $154 $20 $40 $60 $80 $100 $120 $140 $160 $180
2004 2005 2006 2007 2008 2009 2010
Lo an Amou nt ($1 ,00 0s ) Year
Mean Loan Amount per Year
27 adaptive reuse tracts, these same numbers averaged 38%, 56%, and 6%. Thus not only were higher
loan amounts taken out in new construction tracts, but the purpose of the loan was also more likely
to be for a new home purchase rather than for a mortgage refinancing. The chart below illustrates
the percentage of new home loans devoted specifically to new home purchases over time. These
findings indicate that the census tracts around adaptive reuse projects generate less real estate
investment overall than new construction tracts, although the growth potential is evident, as
indicated by the upward trends in both charts prior to 2007.
Home Mortgage Disclosure Act data
Total Value of Loans Requested per Year
The following charts show the total value of loans for which applications were submitted over the
period of study, including those that were approved and denied. The first chart shows raw loan
amounts, while the second chart shows loan amounts normalized by the population of the
respective census tracts. The origination rate of loans requested in adaptive reuse tracts ranged
from 36% to 42% while the rate in new construction tracts ranged from 42% to 46%. Due to
differences in population size and quantity of housing stock, a direct comparison between the two
42%
47% 47% 43%
37% 32%
39%
39% 42% 46%
39% 37%
31% 33%
0% 5% 10% 15% 20% 25% 30% 35% 40% 45% 50%
2004 2005 2006 2007 2008 2009 2010
Percentage of Loans for
New Home Purchase
New Construction
28 sets of tracts is more complicated for this indicator. It has been shown that the population and
quantity of housing stock in adaptive reuse tracts is slightly lower than in new construction tracts.
Thus a higher loan value per capita would indicate higher home values and/or higher loan-to-value
ratios due to lower income.
Home Mortgage Disclosure Act data
Home Mortgage Disclosure Act data
$10,000 $20,000 $30,000 $40,000 $50,000 $60,000 $70,000 $80,000
2004 2005 2006 2007 2008 2009 2010
Lo an Value ($1 ,00 0s ) Year
Total Value of Loans Requested per Year
Adapt Reuse New Const $20,000 $40,000 $60,000 $80,000 $100,000
2004 2005 2006 2007 2008 2009 2010
Lo
an
Amou
nt
Year
Total Loans Requested Per Year
Normalized by Population
29 The sudden decrease and then increase in loan value that occurs from 2008 to 2009 is likely
attributable to the recession, as mortgages that have become unaffordable for loan borrowers are
sold or require new financing. A first-time homebuyer credit established in 2008 and continued into
early 2010 may account for the additional loan amounts requested during that time. After 2009, the
relationship between adaptive reuse and new construction tracts changes and borrowing in
adaptive reuse tracts falls, while in new construction tracts, it continues to grow, albeit more slowly.
The lines of the two project types had followed similar paths up until 2008; their divergence
thereafter indicates the vulnerability of the real estate market in smaller urban centers.
Owner-Occupancy Rate
The chart below shows the owner-occupancy rate of new borrowers in the census tracts
surrounding each project type. Given the nature of the recession and its adverse impact on the
housing market due to foreclosures, a spike in owner-occupancy among new borrowers in 2008
should not be surprising. Real estate speculation by non-owner-occupants slowed significantly as
home values plummeted. The first-time homebuyer tax credit of 2008, which was intended to
stimulate new home-buying during the recession, was only available to owners who occupied their
homes as their primary residence (Smith, 2009).
The owner-occupancy rate between project types varies by no more than 1% throughout
the study period, until the final year, when the gap reaches 2%. This represents a negligible
difference. It may be worthwhile to notice, however, that, post-crisis, owner-occupancy rates
among borrowers in adaptive reuse tracts held steady, while in new construction tracts, they
decreased by 3%. This suggests that real estate speculation may have picked up slightly in new
construction tracts, as new investors take advantage of lower home prices and booming rental
30
Home Mortgage Disclosure Act data
The data presented in the above charts suggest that areas around adaptive reuse projects
face greater challenges than do areas around new construction sites during times of economic crisis.
While these areas performed on par or even favorably to new construction sites prior to 2008, the
effects of the crisis, such as increased unemployment and foreclosures, in smaller, urban areas
interfered with previous, upward trends. By prioritizing adaptive reuse sites in the allocation of the
LIHTC credit, the NCHFA can help to counteract the negative effects of the crisis in areas that need it
most.
Vacancy Rate
One final indicator of community impact, vacancy rate, was obtained from USPS data
collected through HUD. These data indicated the total number of addresses and the number of
vacant addresses within each census tract from 2005 to 2011. Analyzing the data for projects
originating before 2006 showed vacancy rates for tracts with new construction projects declining
slightly from 3% to 2% throughout the time period. Vacancy rates for tracts with adaptive reuse
projects were much higher to begin with, at 6%, and then rose dramatically to 12% by the end of the
time period.
89%
88%
85% 86% 86% 91%
91% 89%
87%
86% 86% 90% 92% 89% 80% 82% 84% 86% 88% 90% 92% 94%
2004 2005 2006 2007 2008 2009 2010
31
United States Postal Service/United States Department of Housing and Urban Development data
The data indicate that census tracts with adaptive reuse projects are more prone to vacancy
than those with new construction projects and that the vacancy rate for these tracts is further
aggravated by some other variable during the time period. This other variable could be the
installation of a new adaptive reuse project, which could devalue the neighborhood and drive
people away, increasing vacancy rates. However, it is also highly likely that the economic recession
and mortgage crisis have disproportionately affected the vicinities that sponsor adaptive reuse
projects. These projects tend to be located in tracts with lower income and owner-occupancy rates,
leading more readily to transience and vacancy. As with other indicators studied for this project,
this indicator may signal a greater need for intervention within the census tracts promoting adaptive
reuse. By identifying the vacant structures in these tracts and putting them to productive use,
32
Case Study
While the previous quantitative analysis offers an overview of the social and economic
trends associated with different types of LIHTC development, qualitative data may provide a deeper
perspective on the experience of adaptive reuse development and its perceived impact. Three
interviews conducted with leading figures in the NCHFA’s latest LIHTC-funded project, as well as site
visits during and after completion, reveal that not only are LIHTC adaptive reuse projects feasible
with the appropriate policies in place, but that this project type can bolster communities, offer
developers a competitive advantage in the marketplace, and provide tenants with distinctive,
affordable units that improve their quality of life. The following pages summarize data collected
from these interviews, along with a pictorial reference.
33 Mebane Mill Lofts
The most recent adaptive reuse project to receive LIHTC financing from the NCHFA was
Mebane Mill Lofts, initiated in April 2011. The project, completed by The Landmark Group, is the
site of the former R.L. Stowe/Durham Hosiery Mill #15 in Mebane, North Carolina (dating from
1922) and is located at 301 West Washington Street, immediately adjacent to the public library (also
a converted mill) at the town’s center. The project provides 75 units of affordable housing,
including 23 one-bedroom units (614 sq. ft.), 32 two-bedroom units (964 sq. ft.), and 20
three-bedroom units (1,414 sq. ft.). Eight of these units are handicapped-accessible. Nineteen (19) units
(25%) are targeted to those earning up to 30% of AMI, while the remaining 56 (75%) are targeted to
those at 60% of AMI. None of the units are offered at a market rate. Site amenities include an
equipped playground, passive recreation, including a natural area with seating, computer classes, an
exercise facility, resident council meetings, and other programs conducted by Landmark Property
Management Company’s on-site manager.
34 The total cost of building was $12,604,847, and land acquisition was $250,000, making
Mebane Mill Lofts the largest LIHTC-funded adaptive reuse project to date in North Carolina.
Landmark received $5,476,693 in federal LIHTC funds and a state LIHTC of $882,004. In addition,
Landmark was awarded a NC State Historic Mill Credit of $4,417,818. Further financing was
provided by banks ($1,215,000), Community Development Block Grant and other local funds
($600,000), and a $13,332 developer fee.
The project brings a market appearance to affordable housing with 14-foot ceilings,
floor-to-ceiling windows, hardwood floors, tiled bathrooms and kitchens, tall cabinets, and skylights. The
rehabilitation constituted a moderate approach by stripping it of older systems and creating new
wall openings, while retaining as much building material as possible according to SOI guidelines. The
wide, open floor plan of the mill made the conversion easier. The developer made use of original,
industrial elements, such as factory fans, by stationing them along corridors as historical artifacts.
35
Large interior corridors maximize light and space, creating a core factor of 20%, which is only slightly higher than the average building.
Twenty-six original cement columns continue to hold up the building after its
36
Kitchens are spacious with ample storage and decent appliances.
37 Patty Philipps, Mebane City Council Member
The Mebane Mill project was met with controversy when it was first proposed several years
ago due to fears of increased criminal activity, vagrancy, and property devaluation in connection
with the development of affordable housing. A previous Section 8 housing development downtown
already had a poor reputation among local property owners. Proponents of the project, however,
saw economic benefits in up-zoning a vacant industrial site to residential use increasing population
density downtown, and developing the potential to strengthen and diversify local businesses. In
addition, proponents saw an opportunity to turn what had long been a public eyesore into a source
of architectural beauty while conserving the cultural heritage of the community.
38 The Landmark Group approached the City of Mebane with its proposal to convert the
abandoned mill building in 2009. The City Council, aware of The Landmark Group’s solid reputation
in both historic property redevelopment and property management, expressed interest in the idea
and began a dialogue with the community. Local residents were taken on a tour of other Landmark
properties in North Carolina that were already completed and in operation, effectively changing
many opponents’ minds. The residential rezoning was passed by the City Council, and
groundbreaking for demolition and construction commenced in April 2011. A certificate of
occupancy for the project was obtained in December 2011; lease-up began in 2012, reaching full
occupancy in only 45 days. A ribbon-cutting ceremony took place on May 10, 2012.