A Stochastic Approach for Valuing Customers
Mahsa EsmaeiliGookeh
Strategic Intelligence Laboratory, Industrial Engineering Department
K.N. Toosi University of Technology Tehran, Iran
Mohammad Jafar Tarokh (Corresponding Author)
Strategic Intelligence Laboratory, Industrial Engineering Department
K.N. Toosi University of Technology Tehran, Iran
Received: February 16, 2017 - Accepted: April 15, 2017
Abstract— The present study attempts to develop a new model for computing customer lifetime value. The customer lifetime value defined in this paper is the combination of present value and future value. As an innovation the CLV modeling of this paper is based on customer behavior modeling, done by data mining techniques. By extracting the profit vector related to each type of customer behavior, calculation of present study was done, then by utilizing Markov chain model we predict future value and count customer lifetime value. A new churn model was contributed by authors to manage unprofitable CRM costs; utilizing this churn model, the proposed CLV model can cause more profitability for the enterprise. The new CLV model of this paper was validated by historical customer data of a composite manufacturing company.
Keywords-customer; present value; future value; customer behavior; Markov chain model; data mining
I. INTRODUCTION
Customer relationship management is a recent marketing paradigm to sustain long-term relationships among enterprises and customers. The main purpose of CRM is to enhance firm profitability by focusing on customers.
The concentration of CRM is on customer acquisition, customer retention, customer churn and customer winback. Customer acquisition is the process of acquiring new customers. Customer retention is the process of keeping customers in enterprise; to do so, it is important to develop profitable relationships between customers and firm. Customer churn happens when customer terminates his/her relationship with the company, a dramatic event that must be managed. Customer winback is the process of returning churn customers to the enterprise [1]. All different formulated CRM strategies are costly; therefore to
enhance the company’s profitability it is essential marketing strategies fit the customers.
Total value that a customer produces during his/her lifetime is called customer lifetime value. The generated value can be calculated through different methods [2]. CLV papers can be categorized into two groups. Papers of the first groups develop a new model to calculate customers’ lifetime value, based on different approaches such as RFM, economic models, persistence models, stochastic models and so on [2], [3]. In second group of papers, researches use existing CLV models to support decision making and developing strategies [4]–[6], ranking customers, planning promotions [7], [8], and so on.
This paper aims to propose a new model to predict CLV, considering customer behavior dynamic and customer churn probability. The main innovation of this model is predicting CLV based on behavior modeling. The other innovation of this paper is
utilizing a new churn model to determine the end of customer’s lifetime sufficiently, causing increment in company’s profitability by managing return costs.
In this model, we calculate present (current) value and predict future value by combination of data mining techniques and Markov chain model (MCM), a stochastic approach. First of all we will extract and cluster various behaviors of customers by data mining. After that we model future behavior of customers by Markov chain model. By modeling the future customer behavior in different transaction periods we can predict CLV. To validate the proposed CLV model 873 transactional data from a composite manufacturing company was gathered and analyzed.
The organization of this paper is as follows: in section 2, CLV researches are reviewed and research gaps are mentioned and the present study is comprised with other researches. In section 3, research methodology is represented and explained and the new CLV model in constructed. In section 4 to validate the developed CLV model, a dataset of a composite manufacturing company is used and results are analyzed. Research innovations, concluding remarks and future research directions are presented in section 5.
II. LITERATURE REVIEW
The concept of customer lifetime value the first time was introduced by Kotler in 1974 as follows: Present value of the future profit stream expected given a time horizon of transacting with the customer. In last decades many CLV models were developed that have pros and cons. In this section we will review CLV models and highlight research gaps that motivated us to conduct this research.
In 1997 Dwyer developed a CLV model in which the annual gross profit (GC) and marketing costs (M) were considered in n transitional periods [9]. Below mathematical formula was presented to count customer lifetime value by Dwyer.
𝐶𝐿𝑉 = {𝐺𝐶 × ∑ 𝑟𝑖
(1+𝑑)𝑖
𝑛
𝑖=0 } − {𝑀 × ∑
𝑟𝑖−1 (1+𝑑)𝑖−0.5
𝑛
𝑖=1 } (1)
In 1998 Berger and Nasr formulated CLV simply, which helped many researches to conduct CLV models.
𝐶𝐿𝑉 = 𝑅𝑒𝑣𝑒𝑛𝑢𝑒 − (𝑐𝑜𝑠𝑡 𝑜𝑓 𝑠𝑎𝑙𝑒𝑠 +
𝑝𝑟𝑜𝑚𝑜𝑡𝑖𝑜𝑛 𝑒𝑥𝑝𝑒𝑛𝑠𝑒𝑠) (2) In 2003 a CLV model was developed based on two assumptions. First the retention rate was considered to be constant; second the time horizon was unlimited. In this CLV model, r is retention rate, i is the interest rate and m is the constant average profit [10], which results CLV as follows:
𝐶𝐿𝑉 = 𝑚 ( 𝑟
1+𝑖−𝑟) (3)
RFM is another useful model in calculating CLV. Recency, frequency and monetary are affecting parameters in CLV. Results of RFM model can help enterprises better classify their customers and develop strategies related to each group [11].
Weighted RFM model was defined in many CLV papers. In WRFM, 3 parameters are weighted based on their importance in the enterprise [12], [13]. 𝐶𝐼𝑗= 𝑤𝑅𝐶𝑅
𝑗+ 𝑤 𝐹𝐶𝐹
𝑗+ 𝑤 𝑀𝐶𝑀
𝑗
(4) Extended RFM models try to add other effective parameters due to the monitoring enterprise. LRFMP is one of the extensions to RFM that adds length of the relationship (L) and customer’s potential to churn (P) [14].
Different CLV papers utilize various techniques [15]such as decision tree[16]–[22], regression analysis [23]–[29], neural network [30]–[36], Markov chain model [37]–[41], genetic algorithm [42], association rules [43] and self-organizing map [44].
In CLV modeling some points must be considered. First of all CLV is the combination of current value and future value. Current value is related to the period starting from the beginning of the customer’s life in the organization until present time and the other one is the value that may be generated by the customer from now till the churn time. Most of CLV papers just calculate current value, but we concentrate on future value besides calculating current CLV. Another important point in CLV modeling is identifying the start and end of customer’s lifetime. Customer’s lifetime starts when first purchase occurs and finishes when churn happens. In some researches start of the customer’s lifetime is the time the enterprise starts acquisition strategies for potential customers. The churn time (time of the lifetime termination) in various researches was defined differently. Based on Migueis’s study, if monetary of the purchase in two consecutive periods decreases 40% the customer is assumed as a churn customer [28]. Zhang obeys Migueis definition and claims churn happens when customer tendency to buy from the company decreases [29].
Some papers consider churn time some periods after the last purchase of the customer. Anyway churn models can be grouped into always-a-share and lost-for-good methods [2]. These two methods define the end of customer’s lifetime by distinct approaches. Lost-for-good and always-a-share approaches have advantages and disadvantages. In lost-for-good method the customer after the last purchase is considered as a churn customer and the company does not try to return him/her. In always-a-share method, the company concentrates on customers even after many periods passed from the last purchase; in this model company pays high amount of costs for returning churn customers, who may not have enough return probability. Vice versa in the other approach no return cost is applied for churn customer even for those with high return probability. Here the research gap appears: It is needed to develop a moderate approach to model customer churn benefiting advantages of both models and eliminating disadvantages of them. A new churn model was developed by writers in 2017 [2]. Based on the new churn model we define the churn time, which is considered as the end of customer’s lifetime; accordingly this gap in CLV papers is covered. Besides the determination of customer’s lifetime by a
new approach, predicting CLV based on modeling customer behavior is another innovation of this paper.
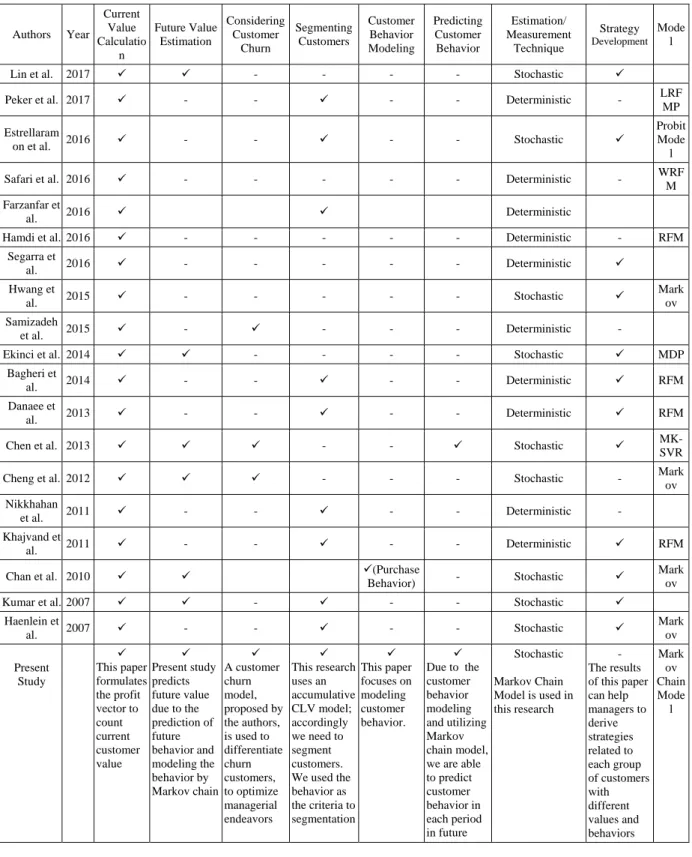
In table 1 we comprise our CLV model by some other CLV studies, introduced in recent years. Table 1. Comparing CLV researches
Authors Year
Current Value Calculatio n Future Value Estimation Considering Customer Churn Segmenting Customers Customer Behavior Modeling Predicting Customer Behavior Estimation/ Measurement Technique Strategy Development Mode l
Lin et al. 2017 - - - - Stochastic
Peker et al. 2017 - - - - Deterministic - LRF
MP Estrellaram
on et al. 2016 - - - - Stochastic
Probit Mode
l
Safari et al. 2016 - - - Deterministic - WRF
M Farzanfar et
al. 2016 Deterministic
Hamdi et al. 2016 - - - Deterministic - RFM
Segarra et
al. 2016 - - - Deterministic
Hwang et
al. 2015 - - - Stochastic
Mark ov Samizadeh
et al. 2015 - - - - Deterministic -
Ekinci et al. 2014 - - - - Stochastic MDP
Bagheri et
al. 2014 - - - - Deterministic RFM
Danaee et
al. 2013 - - - - Deterministic RFM
Chen et al. 2013 - - Stochastic
MK-SVR
Cheng et al. 2012 - - - Stochastic - Markov
Nikkhahan
et al. 2011 - - - - Deterministic -
Khajvand et
al. 2011 - - - - Deterministic RFM
Chan et al. 2010 (Purchase
Behavior) - Stochastic
Mark ov
Kumar et al. 2007 - - - Stochastic
Haenlein et
al. 2007 - - - - Stochastic
Mark ov Present Study This paper formulates the profit vector to count current customer value Present study predicts future value due to the prediction of future behavior and modeling the behavior by Markov chain A customer churn model, proposed by the authors, is used to differentiate churn customers, to optimize managerial endeavors This research uses an accumulative CLV model; accordingly we need to segment customers. We used the behavior as the criteria to segmentation This paper focuses on modeling customer behavior.
Due to the customer behavior modeling and utilizing Markov chain model, we are able to predict customer behavior in each period in future Stochastic Markov Chain Model is used in this research
- The results of this paper can help managers to derive strategies related to each group of customers with different values and behaviors Mark ov Chain Mode l
III. RESEARCH METHODOLOGY
A new CLV model is developed in present research, combining current and future value of customers. Current value calculates the value generated by customers from the start of the lifetime until present time, and future value calculates the value created by the customer from now to the churn time. Many CLV papers neglect predicting future value, because of its difficulty. As customer’s value
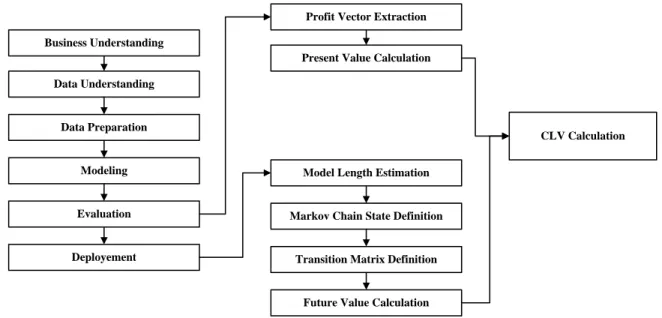
depends to his/her behavior, therefore our CLV calculation model is based on customer’s behavior modeling. Behavior modeling is done by data mining techniques using CRISP-DM methodology. After modeling the behavior of customers, Markov chain model is used to model CLV. Figure 1 shows the research methodology; we may explain each step.
Business Understanding Data Understanding
Data Preparation Modeling Evaluation
Deployement Transition Matrix Definition Markov Chain State Definition
Model Length Estimation
CLV Calculation Profit Vector Extraction
Present Value Calculation
Future Value Calculation
Fig. 1. Research Methodology A. Behavior modeling by CRISP methodology
Business Understanding. A composite manufacturing company is used to validate the derived CLV model. Due to the high marketing costs in composite industry, it is needed to group customers, count CLV and fit managerial decisions to the customer groups in such companies.
Data Understanding. The number of 50 customers in 30 transactional periods was analyzed. Each transaction period in the related business is one month. If customers cease buying from the company for six month, are observed as churn customers. The number of transactional data in this research is 873 considering 9 attributes. Data Preparation. Gathered data must be
preprocessed to make a clean dataset. After data preparation a dataset consisting of 850 clean records by 8 parameters was achieved.
Data Modeling. After data preparation step we use k-means algorithm to make different groups of customers, similar in behaviors. By analyzing customers we can understand that customers of each cluster generate the same value for the company.
Evaluation. Good clustering will be able to separate data based on differences into meaningful number of clusters. To evaluate the correctness of clustering we use Dann indicator. The higher the Dann index the better the separation and the better the clustering.
Deployment. Patterns extracted from data mining are translated to knowledge and can be used in the related business. As a result the done clustering can help organizations to develop strategies related to each cluster.
B. CLV Model parameters estimation
Model Length Estimation. To model CLV the start and the end of considering time period must be identified. In the present research we assume
the start of lifetime is the time the first purchase happened. The end of the lifetime is achieved by a new churn model described in section 2. Based on the churn model passing a meaningful number of periods after customer’s last purchase can be translated to customer churn. The number of meaningful periods is named churn tolerance (CT). Number of periods passed from the last purchase is called Recency (R). While 𝑅 < 𝑇𝐶, the company must try to return customer, but if R exceeds CT, it is not acceptable to act return strategies, because the return probability is too low to invest.
States Definition. A Markov chain model comprises of L states (𝑖 = 1, 2, … , 𝐿). As we use MCM to model the customer value, based on behavior modeling, states of the MCM must show different behaviors of customers; therefore resulting clusters of K-means are used as states of the desired Markov chain model.
Transition matrix construction. An n state MCM has a 𝑛 × 𝑛 transition matrix, representing the transition probabilities between different states. To achieve the quantity of elements of the transition matrix Ching method is used [45]. We assume the desired Markov chain homogeneous, thus the transition matrix is constant and must be extracted once.
Modeling CLV. The CLV of kth customer (𝐶𝐿𝑉𝑘) is the combination of current value (𝐶𝑉) and future value (𝐹𝑉). By deriving a MCM available to predict customer behavior, we became able to predict future value.
𝐹𝑉𝑘= ∑ 𝐼𝑘𝑃𝑡𝜋 𝑘(𝑡) 𝑛𝑐
𝑡=0 (5)
𝐶𝑉𝑘 = ∑−1𝑡=−𝑚𝜋𝑘(𝑡).(1+𝑟)𝑖 𝑡 (6) 𝐶𝐿𝑉𝑘= 𝐶𝑉𝑘+ 𝐹𝑉𝐾 (7) 𝑛𝑐is the number of periods before a churn happens, follows a geometric distribution. Based on Hwang model [46], if 𝑃𝑟𝑐ℎ𝑢𝑟𝑛 is churn probability, 𝑛𝑐 is achieved as follows:
𝑛𝑐= 1
𝑃𝑟𝑐ℎ𝑢𝑟𝑛 (8)
𝐼𝑘 is the initial state vector of the kth customer. 𝐼𝑘 = [𝑠1 𝑠2 … 𝑠𝐿], where 𝑠𝑖∈ {0,1} and i is the state number (𝑖 = 1, 2, 3, . . , 𝐿). Customer’s first purchase occurred m periods ago. r is bank’s interest rate. 𝑃𝑡 is the resulting transition matrix after t periods. 𝜋𝑘(𝑡) indicates profit vector generated by kth customer in various states at time t already converted in its present value.
𝜋𝑘(𝑡) = [
𝜋𝑘,1(𝑡) 𝜋𝑘,2(𝑡)
𝜋𝑘,3(𝑡)
𝜋𝑘,4(𝑡)]
To count the profit value we use RFM model. By counting mean of the 3 parameters in each state, it is possible to discover 𝜋𝑘(𝑡) vector.
IV. RESULTS AND DISCUSSION
850 data of a composite manufacturing company related to 30 months was gathered and analyzed. Data comprise of 8 demographical and transactional parameters such as recency, total monetary, length, pay-type, frequency, product-type, and so on. Based on the research methodology we cluster customers by k-means algorithm and find the best k by Dann index.
𝐷𝑎𝑛𝑛 = 𝑀𝑖𝑛 (𝐼𝑛𝑡𝑟𝑎𝐶𝑙𝑢𝑠𝑡𝑒𝑟)
𝑀𝑎𝑥 (𝐼𝑛𝑡𝑒𝑟𝐶𝑙𝑢𝑠𝑡𝑒𝑟) (9) Using above equation, for 𝑘 = 5, the maximum amount of Dann happened. In table 2 results of the clustering is considerable.
Table 2. K-means clustering result (𝑘 = 5) Cluster
Number No. of Instances Data Percentage
0 160 0.19
1 173 0.20
2 135 0.16
3 216 0.25
4 168 0.20
By analyzing data of each cluster, behavior of customers was extracted and five clusters were identified as follows:
Customers of cluster 0 are best active customers of the company, producing most profitability amount. Mean recency of these customers is very low, meanwhile frequency and monetary is high in this cluster. These customers can be called GOLD customers. Customers of cluster 1 are active too, but their generated profitability is less than previous ones, called SILVER customers. Cluster 2 contains other active customers who have higher recency and their frequency and monetary is less than other two active
clusters, named BRONZE. Cluster number 3 contains INACTIVE customers whose recency didn’t catch churn tolerance, but were active before. Recency in customers of cluster 4 exceeded churn tolerance, therefore these customers are considered as CHURN customers. Churn customers’ tendency to return to the organization is too low to be invested.
A. Markov chain Parameter construction
To model CLV by MCM, achieved clusters can be used as states (𝑖 = 1, 2, … , 𝐿) of desired Markov chain. We will construct a five state homogeneous Markov chain model.
i=1 State = Gold i=2 State = Silver i=3 State = Bronze i=4 State = Inactive i=5 State = Churn
The transition matrix for above 5 states, was extracted by Ching method as follows [45]:
[
0.4 0.25 0.2 0.15 0
0.3 0.2 0.1 0.4 0
0.1 0.2 0.3 0.4 0
0.05 0.15 0.2 0.4 0.2
0 0 0 0 1 ]
B. Model Construction
Following mathematical equations exists among parameters of the model.
P15 = P25 = P35 = P51 = P51 = P52 = P53 = P54 = 0
P55 = 1
P11 + P12 +P13 + P14 = 1
P21 + P22 + P23 + P24 = 1
P31 + P32 + P33 + P34 = 1
P41 + P42 + P43 + P44 + P45 = 1
1 × P11 + 2 × P21 + 3 × P31 + 4 × P41 = 1
1 × P12 + 2 × P22 + 3 × P32 + 4 × P42 = 2
1 × P13 + 2 × P23 + 3 × P33 + 4 × P43 = 3
1 × P14 + 2 × P24 + 3 × P34 + 4 × P44 = 4
3 × P45 + 5 × P55 = 5
1 + 2 + 3 + 4 + 5 = 1
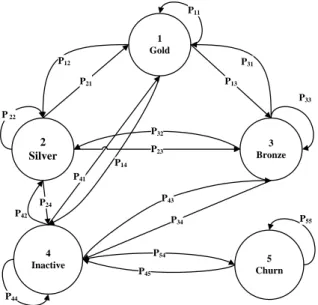
Above equations lead to our desired Markov chain model, shown is figure 2.
2 Silver
4 Inactive P 22
P21
P44
1 Gold
3 Bronze
5 Churn P11
P31
P45
P55 P12
P33
P54
P13
P24 P42
P14 P41
P23 P32
P43
P34
Fig. 2. Derived Markov Chain to Predict CLV
CLV is the summation of current value and future counted as formula 10.
CLV = CV + FV = ∑−1𝑡=−𝑚𝜋𝑘(𝑡) × (1+𝑟)𝑖 𝑡
+ ∑𝑛𝑡=0𝑐 𝐼𝑘𝑃𝑡𝜋𝑘(𝑡) (10) In this case study we assume bank interest rate for 1 month equals 0. To find profit vector (𝜋𝑘(𝑡)), we used RFM model, and can calculate the profit related to each state by normalizing mean of R, F and M in each state.
𝜋𝑘(𝑡) = 𝑅̅ + 𝐹̅ + 𝑀̅ (11) In our dataset profit vector by RFM technique was gained as follows:
[ 193 106 48
7 1 ]
In this paper customers are guarded by a churn threshold. It means to consider a customer as a churn customer dedicated periods must have been passed from his/her last purchase. Therefore an active customer becomes inactive then may change to a churn customer if not purchasing for a while. Based on this explanation, the probability of converting to a churn customer for different states can be computed as follows:
𝑃𝐺𝑜𝑙𝑑→𝐶ℎ𝑢𝑟𝑛= 𝑃𝐺𝑜𝑙𝑑→𝐼𝑛𝑎𝑐𝑡𝑖𝑣𝑒× 𝑃𝐼𝑛𝑎𝑐𝑡𝑖𝑣𝑒→𝐶ℎ𝑢𝑟𝑛 𝑃𝑆𝑖𝑙𝑣𝑒𝑟→𝐶ℎ𝑢𝑟𝑛= 𝑃𝑆𝑖𝑙𝑣𝑒𝑟→𝐼𝑛𝑎𝑐𝑡𝑖𝑣𝑒
× 𝑃𝐼𝑛𝑎𝑐𝑡𝑖𝑣𝑒→𝐶ℎ𝑢𝑟𝑛 𝑃𝐵𝑟𝑜𝑛𝑧𝑒→𝐶ℎ𝑢𝑟𝑛= 𝑃𝐵𝑟𝑜𝑛𝑧𝑒→𝐼𝑛𝑎𝑐𝑡𝑖𝑣𝑒
× 𝑃𝐼𝑛𝑎𝑐𝑡𝑖𝑣𝑒→𝐶ℎ𝑢𝑟𝑛 Now we are able to count CLV based on the derived model. To examine the CLV model, we will calculate CLV for two different examples.
Consider a customer who purchase 3 months ago for the first time. By analyzing the customer’s
attributes, we figured him as a Bronze customer. Based on formula number 10, his CLV equals 705.1.
𝑃𝑟𝐶ℎ𝑢𝑟𝑛 = 0.08 nc = 12
𝐶𝑉 = 144
𝑡 = 1 → 𝐹𝑉(1) = 57.70 𝑡 = 2 → 𝐹𝑉(2) = 61.35 𝑡 = 3 → 𝐹𝑉(3) = 59.70 𝑡 = 4 → 𝐹𝑉(4) = 56.25 𝑡 = 5 → 𝐹𝑉(5) = 52.41 𝑡 = 6 → 𝐹𝑉(6) = 48.62 𝑡 = 7 → 𝐹𝑉(7) = 45.05 𝑡 = 8 → 𝐹𝑉(8) = 41.71 𝑡 = 9 → 𝐹𝑉(9) = 38.63 𝑡 = 10 → 𝐹𝑉(10) = 35.77 𝑡 = 11 → 𝐹𝑉(11) = 33.13 𝑡 = 12 → 𝐹𝑉(12) = 30.69 FV = ∑12 𝐹𝑉 (𝑡)
𝑡=1 = 561.01
→ 𝐶𝐿𝑉 = 705.01
An Inactive customer who entered the organization 8 months ago will produce total amount of 270.71 value till his churn time. 𝑃𝑟𝐶ℎ𝑢𝑟𝑛 = 0.2 nc= 5
𝐶𝑉 = 56
𝑡 = 1 → 𝐹𝑉(1) = 38.15 𝑡 = 2 → 𝐹𝑉(2) = 45.72 𝑡 = 3 → 𝐹𝑉(3) = 45.89 𝑡 = 4 → 𝐹𝑉(4) = 43.71 𝑡 = 5 → 𝐹𝑉(5) = 40.89 FV = ∑5𝑡=1𝐹𝑉 (𝑡)= 214.71 → 𝐶𝐿𝑉 = 270.71
V. CONCLUDING REMARKS
A new model to calculate CLV was derived in this article. As mentioned in table 1, we can compare our study with other related researches in few dimensions: This study formulate profit vector to count current
value by RFM approach.
In this paper, against many CLV studies, future value is predicted and considered in CLV calculation.
Value prediction in this research is based on behavior modeling; this point is the first innovation of this paper.
CLV model derived in this paper is an accumulative model.
A new churn model is utilized in this research to enhance the profitability of the company. This churn model distinguishes customers with high and low return probability and invests on reasonable groups. Here the second innovation of the paper forms.
Data mining techniques by CRISP methodology were used to extract and model customer behaviors, and then a stochastic approach, Markov chain model, was applied to predict future behavior and calculate future value.
Results of this paper can help managers to derive strategies related to each group of customers to decrease unprofitable CRM costs of the organization.
Like any other research, this paper has limitations that can be resolved in future studies. 1) The behavior modeling in this paper was done by data mining techniques under certain condition. In reality certain techniques causes some similarity loss. In future we may improve our new model by uncertain approach. 2) Profit value generated by customer of each state was calculated by RFM model, but we offer to use a method customized to the case study to enhance the precision of the model. 3) In this paper start of customers’ lifetime is the time of first purchase. We recommend start counting CLV since acquisition endeavor.
REFERENCES
[1] V. Kumar and J. Andrew Petersen, Statistical Methods in Customer Relationship Management. 2012.
[2] M. Esmaeiligookeh and M. J. Tarokh, “A Novel Customer Churn Model by Markov Chain,” in Electrical & Computer Engineering, 2017, pp. 1–11.
[3] S. Gupta, D. Hanssens, B. Hardie, W. Kahn, V. Kumar, N. Lin, N. Ravishanker, and S. Sriram, “Modeling Customer Lifetime Value,” J. Serv. Res., vol. 9, no. 2, pp. 139–155, Nov. 2006.
[4] P. Horák, “Customer Lifetime Value in B2B Markets : Theory and Practice in the Czech Republic,” Int. J. Bus. Manag., vol. 12, no. 2, pp. 47–55, 2017.
[5] H. Danaee, Z. Aghaee, H. Haghtalab, and M. P. Salimi, “Classifying and Designing Customer ’ s Strategy Pyramid by Customer Life Time Value ( CLV ) ( Case study : Shargh Cement Company ),” J. Basec Appl. Sci. Res., vol. 3, no. 7, pp. 473–483, 2013.
[6] J. Wang and R. Huang, “Can You Get a Ticket ? Adaptive Railway Booking Strategies by Customer Value,” J. Public Transp., vol. 19, no. 4, pp. 1–17, 2016. [7] Y. Ekinci, F. Ulengin, and N. Uray, “Using customer
lifetime value to plan optimal promotions,” Serv. Ind. J., vol. 34, no. 2, pp. 103–122, 2014.
[8] H. Hu, J. Lin, Y. Qian, and J. Sun, “Strategies for new product di ff usion : Whom and how to target ?,” J. Bus. Res., vol. 83, pp. 111–119, 2018.
[9] F. R. Dwyer, “Customer Lifetime Valuation to Support Marketing Decision Making,” J. Direct Mark., vol. 11, no. 4, pp. 6–13, 1997.
[10] S. Gupta and D. Lehmann, MANAGING CUSTOMERS AS INVESTMENTS, vol. 28, no. 1. Philadelphia: Wharton School Publishing, 2005.
[11] B. Nikkhahan, A. H. Badrabadi, M. J. Tarokh, and D. Heijden, “Customer lifetime value model in an online toy store,” J. Eng. Int., vol. 7, no. 12, pp. 19–31, 2011. [12] D.-R. Liu and Y.-Y. Shih, “Integrating AHP and data
mining for product recommendation based on customer lifetime value,” Inf. Manag., vol. 42, no. 3, pp. 387–400, Mar. 2005.
[13] M. Khajvand and M. J. Tarokh, “Estimating customer future value of different customer segments based on adapted RFM model in retail banking context,” Procedia Comput. Sci., vol. 3, pp. 1327–1332, 2011.
[14] A. Parvaneh, M. J. Tarokh, and H. Abbasimehr, “Combining Data Mining and Group Decision Making in Retailer Segmentation Based on LRFMP Variables,” Int. J. Ind. Eng. Prod. Reseach, vol. 25, no. 3, pp. 197–206, 2008.
[15] M. EsmaeiliGookeh and M. J. Tarokh, “Customer Lifetime Value Models: A literature survey,” Int. J. Ind. Eng. Prod. Manag., vol. 24, no. 4, pp. 317–336, 2013. [16] B. Luo, P. Shao, and J. Liu, “Customer churn prediction
based on the decision tree in personal handyphone system service,” in Proceedings - ICSSSM’07: 2007 International Conference on Service Systems and Service Management, 2007.
[17] M. Hongxia and Q. Min, “Research Method of Customer Churn Crisis Based on Decision Tree,” in Management and Service Science, IEEE, 2009, pp. 1–4.
[18] C. Kirui, L. Hong, W. Cheruiyot, H. Kirui, C. Engineering, and I. Technology, “Predicting Customer Churn in Mobile Telephony Industry Using Probabilistic Classifiers in Data Mining,” in IJCSI International Journal of Computer Science Issues, 2013, vol. 10, no. 2, pp. 165–172.
[19] A. A. Khan, S. Jamwal, and M. M. Sepehri, “Applying Data Mining to Customer Churn Prediction in an Internet Service Provider,” Int. J. Comput. Appl., vol. 9, no. 7, pp. 8–14, 2010.
[20] C. S. Poulsen, “Carsten Stig Paulsen,” Int. J. Res. Mark., vol. 7, no. 1967, pp. 5–19, 1990.
[21] W. Verbeke, D. Martens, C. Mues, and B. Baesens, “Building comprehensible customer churn prediction models with advanced rule induction techniques,” Expert Syst. Appl., vol. 38, no. 3, pp. 2354–2364, 2011. [22] H. Abbasimehr, M. Setak, and M. Tarokh, “A
Comparative Assessment of the Performance of Ensemble Learning in Customer Churn Prediction,” Int. Arab J. Inf. Technol., vol. 11, no. 6, pp. 599–606, 2014. [23] J. Burez and D. Van den Poel, “CRM at a pay-TV
company: Using analytical models to reduce customer attrition by targeted marketing for subscription services,”
Expert Syst. Appl., vol. 32, no. 2, pp. 277–288, 2007. [24] M. Owczarczuk, “Churn models for prepaid customers in
the cellular telecommunication industry using large data marts,” Expert Syst. Appl., vol. 37, no. 6, pp. 4710–4712, 2010.
[25] J. Chen and R. K. H. Ching, “The Effects of Mobile Customer Relationship Management on Customer Loyalty: Brand Image Does Matter,” in 40th Annual Hawaii International Conference on System Sciences, 2007, pp. 1–10.
[26] K. Dahiya and S. Bhatia, “Customer Churn Analysis in Telecom Industry,” in IEEE, 2015.
[27] K. Poku, M. Zakari, and A. Soali, “Impact of Service Quality on Customer Loyalty in the Hotel Industry: An Empirical Study from Ghana,” Int. Rev. Manag. Bus. Res., vol. 2, no. 2, pp. 600–609, 2013.
[28] V. L. Miguéis, D. Van Den Poel, A. S. Camanho, and J. Falcão E Cunha, “Modeling partial customer churn: On the value of first product-category purchase sequences,”
Expert Syst. Appl., vol. 39, no. 12, pp. 11250–11256, 2012.
[29] Z. Zhang, R. Wang, W. Zheng, S. Lan, D. Liang, and H. Jin, “Profit Maximization Analysis Based on Data Mining and the Exponential Retention Model Assumption with Respect to Customer Churn Problems,” in IEEE International Conference on Data Mining Workshop (ICDMW), 2015, pp. 1093–1097.
[30] N. Glady, B. Baesens, and C. Croux, “Modeling churn using customer lifetime value,” Eur. J. Oper. Res., vol. 197, no. 1, pp. 402–411, 2009.
[31] J. Hadden, A. Tiwari, R. Roy, and D. Ruta, “Computer Assisted Customer Churn Management : State-Of-The-Art and Future Trends,” Comput. Oper. Res., vol. 34, no. October, pp. 2902–2917, 2007.
[32] A. Karahoca and D. Karahoca, “GSM churn management by using fuzzy c-means clustering and adaptive neuro fuzzy inference system,” Expert Syst. Appl., vol. 38, no. 3, pp. 1814–1822, 2011.
[33] A. Sharma and P. K. Panigrahi, “A Neural Network based Approach for Predicting Customer Churn in Cellular Network Services,” Int. J. Comput. Appl., vol. 27, no. 11, pp. 26–31, 2011.
[34] X. Fang, “Research on a predictive model of the customer churn,” in 7th International Conference on Wireless Communications, Networking and Mobile Computing, WiCOM 2011, 2011, pp. 26–28.
[35] A. M. Almana, M. S. Aksoy, and R. Alzahrani, “A Survey On Data Mining Techniques In Customer Churn Analysis For Telecom Industry,” Int. J. Eng. Res. Appl., vol. 4, no. 5, pp. 165–171, 2014.
[36] B. . Huang, T. . Kechadi, B. Buckley, G. Kiernan, E. Keogh, and T. Rashid, “Article-A new Feture set with new window techniques .. article,” Expert Syst. Appl., vol. 37, pp. 3657–3665, 2010.
[37] T. Dierkes, M. Bichler, and R. Krishnan, “Estimating the effect of word of mouth on churn and cross-buying in the mobile phone market with Markov logic networks,”
Decis. Support Syst., vol. 51, no. 3, pp. 361–371, 2011. [38] J. Burez and D. Van den Poel, “Handling class imbalance
in customer churn prediction,” Expert Syst. Appl., vol. 36, no. 3 PART 1, pp. 4626–4636, 2009.
[39] P. Rothenbuehler, J. Runge, F. Garcin, B. Faltings, and I. Epfl, “Hidden Markov Models for churn prediction,” in
SAI Intelligent Systems Conference, 2015, pp. 723– 730. [40] H. Hwang, “A Dynamic Model for Valuing Customers :
A Case Study,” Adv. Sci. Technol. Lett., vol. 120, pp. 56– 61, 2015.
[41] H. Hwang, “A Stochastic Approach for Valuing Customers : A Case Study,” Int. J. Softw. Eng. Its Appl., vol. 10, no. 3, pp. 67–82, 2016.
[42] J. Zhao and X.-H. Dang, “Bank Customer Churn Prediction Based on Support Vector Machine: Taking a Commercial Bank’s VIP Customer Churn as the Example,” 2008 4th Int. Conf. Wirel. Commun. Netw. Mob. Comput. IEEE, vol. 1, no. 3, pp. 1–4, 2008. [43] C. F. Tsai and M. Y. Chen, “Variable selection by
association rules for customer churn prediction of multimedia on demand,” Expert Syst. Appl., vol. 37, no. 3, pp. 2006–2015, 2010.
[44] M. Fathian, Y. Hoseinpoor, M. Fathian, and Y. Hoseinpoor, “Kybernetes Article information :,”
Kybernetes, vol. 45, no. 5, pp. 732–743, 2016.
[45] W. Ching, M. K. Ng, and M. M. So, “Customer migration , campaign budgeting , revenue estimation : the elasticity of Markov Decision Process on customer lifetime value,”
AMO- Adv. Model. Optim., vol. 6, no. 2, pp. 65–80, 2004. [46] H. Hwang, T. Jung, and E. Suh, “An LTV model and customer segmentation based on customer value : A case study on the wireless telecommunication industry,”
Expert Syst. Appl., vol. 26, pp. 181–188, 2004.
Mahsa EsmaeiliGookeh is a Ph.D. candidate in IT engineering in K. N. Toosi University of Technology in Tehran. She received her B.Sc. from AmirKabir University of Technology, and M.Sc from K. N. Toosi University of Technology Both in IT engineering field of study. Now she is working on customer lifetime value modeling and is intrested in CRM, BPR and data analysis.
Mohammad Jafar Tarokh is a professor at Strategic Intelligence Laboratory in industrial engineering department of K. N. Toosi University of Technology in Tehran. He received his B.Sc. from Sharif University, M.Sc. from University of Dundee in UK and Ph.D. from University of Bradford, UK. His main research interests are in business intelligence, customer relationship management, supply chain management, and knowledge management.