RACE, SOCIOECONOMIC STATUS AND REPRESENTATION: REDEFINING AFFIRMATIVE ACTION IN CHICAGO
By
Renee M. Psenka
Honors Thesis Department of Public Policy
University of North Carolina at Chapel Hill
April 24, 2014
Approved:
____________________________________ Dr. Daniel P. Gitterman, Chair
Abstract
As the legal foundation of racial affirmative action in public education erodes, alternatives to these policies must be examined where diversity is socially and pedagogically valued. The purpose of this thesis is to determine if race-neutral, socioeconomic status-based affirmative action policies can be applied to produce comparable levels of racial/ethnic
enrollment proportions within schools (versus racial affirmative action). My study examines the Chicago Public Schools’ Admissions Policy for Magnet, Selective Enrollment and Other Options For Knowledge Schools and Programs, which applied a SES-based admissions standard to the Selective Enrollment High School program in 2011. Using data on Selective Enrollment High Schools and CPS demographic enrollment, this thesis determines the treatment effect of the new policy on enrollment proportions through multiple linear regression. The analysis provides empirical evidence that SES-based admissions policies yield statistically significant decreases in Black and minority student enrollment proportions, which are 5.8% and 7% lower than
Dedication
First, to my parents, without whose unwavering support and encouragement this thesis would have remained an idea.
Second, to my high school teachers at Northside College Prep, who taught me the value of creativity, intellectual curiosity and academic passion: in particular, Tim Devine, Dianne Maleug, Anna Searcy, and Jeff Solin. And finally, to my AP Microeconomics teacher, John Belcaster, who inadvertently inspired me to study public policy with his final lesson:
Acknowledgement
Table of Contents
Abstract .………. 2
Dedication .………. 3
Acknowledgment .………. 4
Table of Contents .………. 5
List of Tables ………. 7
Chapter 1. Introduction: Background, Policy Significance and Specific Aims ……… 8
Chapter 2. Literature Review and Conceptual Framework ………. 12
Urban Segregation and Chicago’s Consent Decree ………. 14
The Chicago Public Schools’ Socioeconomic Status-Based Admissions Policy ……… 21
Admissions Score Calculation ………. 22
Socioeconomic Tier Calculation .………. 23
Selective Enrollment Admissions Structure ……… 25
The Origins of Socioeconomic Affirmative Action .……… 27
Chapter 3. Research Design: Data and Methods ………. 34
Data and Data Collection ………. 35
SEHS Enrollment Data ……… 35
CPS Enrollment Data .………. 36
Empirical Method: Linear Regression ………. 36
Limitations of Data ………. 39
Sample Size ………. 39
Application Trends .………. 39
Descriptive Statistics ……… 41
Regression Analysis: SES Policy Effect on Racial/Ethnic Group Enrollment Proportions .………. 44
Chapter 5. Findings and Conclusions .………. 48
Alternative Hypothesis: Non-Linear Urban Population Trends ……….. 48
Implications .………. 51
References ……… 54
Appendix A. CPS Demographic Enrollment Trends, 1950-2010 (Select Years) ……… 59
Appendix B. Public School Racial Dissimilarity Index (Select Cities), 2009-2010 .…………. 60
Appendix C. Selective Enrollment High School Demographic Counts (Grade 9), 2006-2013 .. 61
Appendix D. CPS Demographic Counts (Grade 9), 2006-2013 .……… 63
Appendix E. Selective Enrollment High School Demographic Grade 9 Proportion Trends, 2007-2014 ……… 64
List of Tables
Chapter 1. Introduction: Background, Policy Significance and Specific Aims
The national landscape surrounding affirmative action in education has drastically changed over the past decade. Historical policy mainstays protecting diversity are being challenged as public school systems react to an idealized post-racist American culture. Within public magnet schools and institutions of higher learning, admissions policies—where relevant— have begun evolving past racial affirmative action, leaving many minority students with
narrower avenues to opportunity. Despite the legal ban on segregation decided in 1954 by Brown v. Board of Education of Topeka, undeniable racial and economic segregation exists within many urban school districts today, in many cases resigning minority students to
underperforming neighborhood schools. In cases where these students have the chance to pursue higher quality public education through specialized or magnet schools, affirmative action
policies can ensure equitable levels of minority student enrollment. Today, the challenge for public schools—primary, secondary, and tertiary—is how to maintain diversity, as race becomes an increasingly impermissible admission or school composition factor.
In states where integration efforts are voluntary, utilizing race explicitly to determine school enrollment is no longer permissible. In public primary and secondary schools, Parents Involved in Community Schools v. Seattle School District 1 (2007) held that that race could not be used as an admissions factor in public schools to combat de facto segregation1 because, among other issues: no effort to consider a race-neutral alternative was taken, and the policy did not individually consider student assignment based on race. Justice Anthony Kennedy
1 De facto segregation is segregation that voluntarily occurs in practice, but is not ordained by law. In the case of
concluded, in his concurring opinion, that race-conscious mechanisms, which do not lead to differential treatment or preference to a student based explicitly upon race, would likely be held constitutional thereupon (PICS v. Seattle, 2007). As a result, some public school districts and institutions are aiming to capture and ensure diversity with policies that apply designed race-conscious mechanisms—as opposed to race-based.
In public primary and secondary schools that have admissions procedures, policies concerning diversity (where no prior de jure segregation had been practiced) vary between school systems: in some, districts utilize a strict merit-based system, which rarely—if ever— produces a critical mass of minority students. More commonly, these admissions procedures are treated most similarly to that of a university—where race is factored in some way. In higher education, the landmark Supreme Court decision, Regents of the University of California v. Bakke (1978) concluded that, while explicit racial admissions quotas violate the Equal Protection Clause of the Fourteenth Amendment, utilizing race as a “plus” factor for minority candidates was legitimate and served a compelling interest. This interest was maintained by the Grutter v. Bollinger (2003) decision, which held that race-conscious admissions policies were a justifiable means to achieve the education benefits of a diverse student body. However, Justice Sandra Day O’Connor stated, in the decision: “The Court expects that 25 years from now, the use of racial preferences will no longer be necessary to further the interest approved today” (Grutter v. Bollinger, 2003, p. 310).
the University of Texas at Austin are challenged to prove that their criteria in admission are the only way to ensure a diverse student body. On April 22, 2014, the Supreme Court held that it is constitutional for states to ban affirmative action policies outright in Schuette v. Coalition to Defend Affirmative Action with a 6-2 decision (Liptak, 2014). In 2006, Michigan’s Proposal 2, which banned public schools from using race as an admissions factor, was incorporated into the state constitution—and Michigan joined Arizona, California, Florida, Nebraska, New
Hampshire, Oklahoma and Washington in the company of states that have instituted bans on affirmative action in public institutions or schools. This landmark decision will change the national perspective on affirmative action, and may now affect admissions policies at magnet schools, specialized schools, and institutions of higher education across the country. In response to the changing legal climate surrounding existing affirmative action, some proactive public school systems have already attempted to implement policy reform that uses non-racial diversity measures to ensure the continuation of satisfactory racial balance.
One such reform, adopted by the Chicago Public Schools in 2010, utilizes a
socioeconomic status-based variable to achieve racial diversity. This relatively new policy, fully implemented in the 2011-2012 academic year, has attempted to maintain a similar level of student body diversity when compared to the previously employed quota system. Although some parents and community members disagree with the design of the new admissions standards, the affected schools have remained relatively diverse (Chicago Board of Education [CBOE], 2011).
action. While arguments for socioeconomic affirmative action have been made for decades, the Chicago case study is significant because it exhibits the first deliberate SES-based admissions policy in a primary and secondary public school system, which is applied to the city’s selective enrollment and magnet schools (Thomas et al., 2011). Thus, the question remains as to whether or not these mechanisms can accurately capture and maintain a socially beneficial and equitable level of diversity within public schools. By analyzing enrollment trends pre- and post-policy implementation, this thesis will determine whether this policy ensures comparable, significant levels of racial diversity within affected schools.
Chapter 2. Literature Review and Conceptual Framework
Desegregation, particularly desegregation education policy, began in 1954 with the Supreme Court’s decision in Brown v. Board of Education (1954), wherein it was decided that state-imposed segregation violated students’ Fourteenth Amendment rights to equal protection, concluding that “[racially] separate educational facilities are inherently unequal” (Brown v. Board of Education of Topeka, 1954, p. 495). Despite the weight of this decision, integration progress was slow in states that had historically instituted segregation laws: for example, in 1965, only 7.5% of Black students in the South attended schools with White students (Levine & Havighurst, 1989, p. 309). In states that had not instituted explicit segregation, increasing urban residential segregation led to growing public schooling segregation in many Northern cities. This was the case in Chicago, where in 1960, 69% of Black residents lived in communities that were at least 95% African-American (“Local Community Fact Book,” 1984).
and the courts began taking steps to combat some de facto segregation—in New York and New Jersey, courts upheld districts’ decisions to draw school boundary lines in order to produce more substantial racial balance. Comprehensive voluntary integration initiatives passed in some states (like Massachusetts), which aimed to eliminate imbalance altogether, and were seen sparingly in the 1970s and 1980s in Northern states and urban centers. In contrast, other districts engaged in school district gerrymandering and new, isolating school construction in order to produce levels of segregation akin to that seen in pre-Brown southern schools (Levine & Havighurst, 1989).
Concurrently, institutions that utilized admissions procedures (particularly, in higher education) adopted policies of affirmative action as a result of the Civil Rights movement. In 1965, President Lyndon B. Johnson signed Executive Order 11246, which compelled
government contractors to employ affirmative action in their hiring practices, and in subsequent years, many colleges and universities adopted similar policies. At the time, only five percent of undergraduate students, two percent of medical students, and one percent of law students were Black (“Affirmative Action,” 2013).
Affirmative action admissions and hiring policies began to be placed under increased scrutiny in the late 1970s, where quota policies in cases of voluntary integration and diversity-seeking were deemed unconstitutional (Regents of the University of California v. Bakke, 1978).2 Further, as the political landscape surrounding the Civil Rights movement began to change as equal rights concepts became more widespread—and the social psychology arguments of race relations outlined in the 1960s grew outmoded—both desegregation and affirmative action policies aimed at improving diversity in public schools were deprioritized (Levine & Havighurst,
2 Quotas could be legally employed in cases where institutions were found guilty of past, substantial de jure
1989). In affirmative action, this meant that the scrutiny applied to minority benefits grew every year. For integration, this meant the de facto segregation that emerged in the North as a result of more popular neighborhood school policies kept schools segregated: growing inequity in
Northern cities offset the comparatively immense progress made in desegregation in the South. In the North, where at best racial isolation marginally decreased, or at worst, grew, urban residential segregation became the integration challenge of the late twentieth century.
Urban Segregation and Chicago’s Consent Decree
In 1973, a landmark decision in Keyes v. School District No. 1, Denver, Colorado defined the level of scrutiny to be applied to indirect de facto segregation in Northern cities. Within the context of desegregation, it was the first major decision regarding segregation outside of the South, and worked to spur most of the comprehensive integration efforts in major cities that had never experienced government-imposed, explicit school segregation, but saw extreme practical levels of racial imbalance. This established a prima facie case of constitutional violations by the Denver schools, whereby the board intentionally implemented policies that furthered racial segregation within their district. Although, because of a variety of external, private factors, many neighborhood schools may experience some levels of undue racial isolation, it is the legal responsibility of the school boards to ameliorate these issues through desegregation and
integration policies. In the case of Denver, it was determined that not only did policymakers reject resolutions to implement desegregation measures in the affluent Park Hill neighborhood, but also actively promoted racial segregation:
mobile classroom units, among other things, the respondent School Board had engaged over almost a decade after 1960 in an unconstitutional policy of deliberate racial segregation with respect to the Park Hill schools (192).
With respect to public school policy, this case established that school boards bear the burden of proving that segregation existing within their districts is not the result of any segregative intent (Keyes v. School District No. 1, 1973). Thus, following this decision, many other districts’ policies—across the Northeast and Midwest—became the subject of lower-court lawsuits, which often led to decades of mandated, broad desegregation initiatives. In Denver, the result was 21 years of mandatory busing, in which about a quarter of public school students were forcibly bused to schools throughout the city in order to achieve district-wide racial balance (Brooke, 1995).
The court decrees were often met with White flight and public discord. In 1968, before the first lawsuit was brought against the Denver School District, almost 64,000 White students attended public schools in the city. In 1975, when the policies mandated by the Supreme Court decision were enforced, 7,000 fewer White students were enrolled. In violent protest, arsonists set fire to nearly one-third of the buses to be used for desegregation, and the home of Wilfred Keyes (the plaintiff in the landmark case) was pipe bombed. Parents, particularly middle class, White parents, protested the busing policy vehemently (as they had played a large role in ensuring that desegregation resolutions were not passed in the late 1960s), and when
population was growing at a rate of about 18.8%. In the 1970s, this rate dropped to 4.2%, and in the 1980s and 1990s, respectively, the urban population decreased by 4.3 and 5%. While these population trends are not uniquely explained by the school policy, it was one of the largest contributing factors to Denver’s trend of White flight in the late twentieth century. By 1995, when the desegregation busing policy was vacated, White enrollment in Denver Public Schools had dropped over 71%. Even with desegregation busing, some schools still had around 90% minority enrollment, simply because there were not enough White students in the school system to integrate (Brooke, 1995). White flight was one of the worst—and most counterproductive— effects of Northern integration policies. In the end, Denver ended its desegregation policy in part because of the growing lack of White students within the school district.
schools, voluntary busing, and magnet school construction—which, ultimately, had marginal effects on overall school integration or quality. Measurable desegregation in Chicago, since the 1960s, has only been seen in one program: magnet schools.
The story of segregation and desegregation in Chicago actually begins much earlier than the Keyes decision or Chicago’s consent decree—in 1965, the Chicago Public Schools were the first Northern recipients of a Civil Rights Act Title VI complaint, which alleged that integration efforts were hindered by school boundary gerrymandering, inadequate transfer plans, extreme school quality gaps, and explicit segregation at some Chicago schools. As a result, the U.S. Department of Health, Education and Welfare (now defunct) withheld $32 million in ESEA funding. However, the clout of the Chicago political machine proved stronger than the justified complaint—after a short meeting between Chicago Mayor Richard J. Daley and President Lyndon B. Johnson, the funds were released to the CPS (Danns, 2011).
Over the next decade-and-a-half, minor desegregation efforts were made in response to public and institutional pressure. Using the argument of White flight prevention (although it would later be determined that in Chicago, desegregation did not as significantly influence White flight compared to other cities like Denver), voluntary desegregation busing was instituted in some neighborhoods: and in a public school system of over 550,000, at most 600 Black students were integrated into White schools through this limited busing system. In the early 1970s, under orders from the Illinois state government, the CPS developed a more comprehensive
Enrollment), Whitney M. Young High School, opened in 1975, and a handful of other magnet elementary and high schools sprung up across the city. However, by the end of the decade, only about 5% of Chicago schools were participating in desegregation by busing, and worse than 89% of minority students attended segregated schools (Danns, 2011; Bogira, 1988). While this level of segregation was not necessarily uncommon in Northern urban school districts, in the case of Chicago, it was systematic.
Finally, after over fifteen years of segregation violations, the Department of Health, Education and Welfare charged the CPS with seven violations of Title VI of the Civil Rights Act, alleging that the district engaged in policies that:
(1) Created attendance boundaries and structures which promoted racial segregation; (2) maintained racially segregated branch schools; (3) maintained segregation through permanent or temporary facilities to relieve overcrowding; (4) maintained crowded, inferior schools in such a way to identify them for Black students; (5) assigned teachers and staff to match the race of the students at those schools; (6) used a permissive transfer policy which allowed White students to transfer out of schools in which they were the minority; and (7) associated segregated schools with segregated housing projects (Danns, 2011).
1965, when half of CPS students were White—true integration could have been reasonably achieved. White families had been steadily leaving the city and public school system since the 1950s: White enrollment comprised 62% of total enrollment in 1950, but by 1987, that
proportion had dropped to only 14% of the CPS population. Appendix A provides information on CPS demographic enrollment trends for select, benchmarking years between 1950-2010. By the time desegregation was legally mandated in Chicago in 1980, minority students comprised over 80% of the enrollees (Bogira, 1988).
After minor consideration of a highly unpopular interdistrict transfer program (with wealthy, White suburban districts), the board agreed upon a desegregation plan that would provide increased access to more magnet schools, voluntary transfers for thousands of minority students,3 and compensatory programs and funding for segregated, failing schools. Of all of these policies, only the magnet program saw any accomplishment in terms of desegregation—in fact, the schools, particularly the Selective Enrollment schools, became the crown jewels of the otherwise inequitable, failing CPS system. Not only were most of these schools some of the strongest performing academically, but most provided dynamic, integrated environments for students from all over the city.
These specialized programs, however, disproportionately benefitted White students and absorbed a hefty amount of resources relative to the other larger mandated desegregation
programs. The benefit, however, was necessary for the provision of desegregation: while Whites composed around 15% of the CPS population, at that time more than 15% non-minority students were needed at each magnet to provide a desegregated environment relative to the urban
3 It is notable that this aspect of desegregation was relatively successful; by 1986, nearly all (save two) of the
population. By the late 1980s, double the amount of Whites were enrolled in magnet schools as were enrolled in neighborhood public schools. The magnet program, adequately designed to keep White families in the Chicago Public Schools, actually improved the White student public school experience far more than it did for minorities—with the best Selective Enrollment schools (the highest performing level of magnet schools) enrolling nearly 40% White student bodies. Further, not including transportation costs, the CPS spent over double the amount, per pupil, on magnet school students than it spent on compensatory programs at racially isolated schools (Bogira, 1988). Understanding that these top-performing, high-resource schools would attract proportionally more White students than non-White, to protect access for the disadvantaged minority, quota policies were established as a part of 1980 Consent Decree, which mandated that all magnet schools enroll 65-85% minority students, at minimum. By combining this corrective quota with academic programs to attract White students, the magnet schools actually worked to create diverse learning environments, which have persisted (Bogira, 1988). However, without the quota system, the schools would have likely become segregated majority-White
institutions—as seen in other selective magnet systems, like New York’s Specialized Schools (NAACP Legal Defense and Education Fund, 2012).
The Chicago Public Schools’ Socioeconomic Status-Based Admissions Policy
The Blue Ribbon Committee, a task force appointed by the Chicago Public Schools, began to draft a new admissions policy for Chicago’s nine Selective Enrollment public high schools in 2009.4 CPS had previously ensured diversity in its admissions-based schools via a consent decree-mandated racial quota since 1980. This decree, ordered as a result of
unconstitutional segregation policies devised to limit “White flight,” was terminated and vacated on September 24, 2009, as CPS had demonstrated long-standing compliance (United States of America v. Board of Education of the City of Chicago, 2009). However, following PICS v. Seattle (2007), the race-factored policy outlined by the decree was no longer a permissible method of maintaining diversity voluntarily.5 Thus, CPS was challenged to determine a new policy that would maintain a comparable level of student body diversity within its admissions-based schools.
As a caveat, neighborhood schools generally see diversity reflective of the local school district population, as a result of numerous anti-desegregation judicial decisions in the 1990s, which empowered de facto segregation following the expiration or vacation of court-mandated desegregation, as in Freeman v. Pitts (1992). Consequently, the Chicago Public Schools
system—when examined altogether—is actually one of the most segregated metropolitan school systems in the country. In terms of community racial variation and isolation, as measured by the percentage of students who would have to change schools to achieve system-wide, level racial
4 Today, Chicago Public Schools operates ten Selective Enrollment schools, including South Shore International
College Prep, which opened in 2011. The final admissions policy applied to a total of ten (10) schools when it was accepted on August 24, 2011.
5 In accordance with PICS v. Seattle, using race as an explicit factor in admission or composition is permissible
distribution (dissimilarity index), Chicago ranks worst in four out of six dissimilarity categories, when comparing the five most segregated metropolitan areas nationally. Appendix B
summarizes these dissimilarity indices. Further, in Chicago, 71.8% of all Black students attend over 90% minority schools, and almost half attend over 99% minority schools (Orfield, Kucsera, & Siegel-Hawley, 2012, p. 60). To put this into perspective, in the 1960s, this figure was about 65% nationally (Coleman, 1966, p. 3). And while this high level of segregation was largely ignored in the twenty-first century policy sphere—as national desegregation policy is no longer enforced in most school districts—more equitable admissions policies for the Selective
Enrollment and magnet schools were designed to allow equal access to high quality education for students regardless of racial or socioeconomic background. Piloted in 2010 and implemented the following academic year, the new policy took into account student socioeconomic status as a categorical factor in admissions decisions (CBOE, 2011).
Under the Admissions Policy for Magnet, Selective Enrollment and Other Options For Knowledge Schools and Programs, admission to each of the current ten Selective Enrollment High Schools6 is determined by two factors: composite admissions score and socioeconomic tier (CBOE, 2011).
Admissions Score Calculation
The composite admissions score is a numerical point value calculated based on three equally-weighted factors: high school entrance exam score, seventh grade reading and math standardized test scores, and seventh grade academic marks (in reading, math, science, and social studies). Each of these sections is weighted equally with 300 points—wherein perfect (99th
6 Chicago Public Schools Selective Enrollment High Schools are: Robert Lindblom Math & Science Academy,
percentile) Selective Enrollment High School admissions exam scores, perfect standardized test scores (the Illinois State Achievement Test is most commonly used), and straight “A”s garner a maximum score of 900 (CBOE, 2011). Before the new admissions policy was instituted, admission to these Selective Enrollment schools was based solely on composite admissions scores and race, with composition ratios of at most 35% White and at least 65% non-White (United States of America v. Board of Education of the City of Chicago, 2009).
Socioeconomic Tier Calculation
The socioeconomic tier system, which attempts to ensure equality of access to students of all backgrounds, was introduced as an additional factor in admission with the new policy
(replacing quotas). In this system, students are assigned to a tier—1 through 4—based upon where they live in the city; specifically, their census tract. CPS annually assigns tiers to each of the city’s tracts based upon a percentile ranking of six neighborhood factors: median family income, percentage of home ownership, percentage of single-parent households, percentage of the population that is English-speaking, highest level of adult educational attainment (a
structured variable), and local school performance (a structured variable). Based upon this data, the tracts are split into four equal, ranked groups— the tiers—with Tier 1 representing lowest socioeconomic tracts and Tier 4 representing the highest (Thomas et al., 2011).
The socioeconomic (SES) score is calculated, per tier, as follows:
SES Score = Percentile Median Income (1) + Percentile Home Ownership
+ Percentile Single-Parent Family + Percentile Non-English Speaking + Percentile Education Score
Where percentile median income, home ownership, single-parent family, and non-English speaking data are taken directly from the Census (or estimates), and both education score and school performance are structured variables utilizing Census and test score data, respectively (Thomas et al., 2011).
The education score is calculated based on tract adult educational attainment as listed on the Census, with categories: less than high school diploma, high school diploma, some college, Bachelor’s Degree, Advanced Degree. Each category is weighted to reflect the implicit positive socioeconomic effects associated with higher community education levels. The score is
calculated based on the equation:
Education Score = 0.2 * (% Less than High School Diploma) (2) + 0.4 * (% High School Diploma)
+ 0.6 * (% Some College) + 0.8 * (% Bachelor’s Degree) + 1.0 * (% Advanced Degree)
Where the lowest possible score is 0.20 (no adults in the tract have completed high school) and the highest is 1.0 (all adults have completed an advanced degree). These scores are then ranked (assigned a percentile) and tabulated in the SES score figure (Open City, 2013).
elementary school in the census tract to determine the local school performance variable. The performance variable can be summarized by the equation:
School Performance = 𝑥 !"!!!" !"#$%%&'"(!
!"#$% !"#$%%&'"( ∗ Composite ISAT Scoren (3)
Local school performance scores are then assigned percentiles, which are utilized in the final SES score calculation.
Once the percentiles for all six factors of the SES score are calculated, they are summed for each census tract and rank-ordered. The tiers are then determined by grouping the 25% lowest into Tier 1, the next lowest 25% into Tier 2, and so on. There are typically marked differences across all categories between tiers: for example, in the pilot year (2010), the median income in a Tier 4 neighborhood was $76,829, compared to $30,791 in Tier 1 (Policy briefing [PowerPoint slides], 2011).
Selective Enrollment Admissions Structure
Student admission into a Selective Enrollment High School is then determined by taking into account both composite admissions score and tier. Under the current policy, 30% of the seats in Selective Enrollment schools are reserved for the students who have the highest
composite scores—regardless of socioeconomic status. The remaining 70% of seats are divided evenly between each of the four tiers—with the top students from each tier, ranked by individual composite admissions score, earning acceptance to their choice of school (Thomas et al., 2011).
wealthier neighborhoods whose children are now less likely to be admitted under the SES system—socioeconomic affirmative action is viewed as an increasingly viable alternative to traditional, race-based affirmative action. However, the SES-based policy’s limitations and novelty in modern practice preclude any recommendation for this change without further analysis. Although other SES-based affirmative action policies have been practiced in some institutions throughout the country, their effectiveness is neither conclusive nor convincing.
The goal of the new policy was to ensure that students from all socioeconomic backgrounds had equal access to Selective Enrollment High Schools, while also working to maintain diversity within the schools. Historically, the best Selective Enrollment High Schools saw skewed socioeconomic distributions—favoring higher income students—but also diverse student bodies, in accordance with the consent decree. The Blue Ribbon Committee was thus tasked with both expanding access and maintaining diversity without any explicit race factor— ultimately designing one of the first high school socioeconomic status-based admissions policies in the country.
The Blue Ribbon Committee designed the SES-based admissions policy in a race-neutral way, while removing some bias against minority students—predicted by a strict socioeconomic admissions policy— by introducing two additional variables, outside of SES indicators, to the tier system: percentile non-English speaking and percentile local school performance. The percentile non-English speaking factor directly targets Hispanic students, whose communities (tracts on the West Side of the city) are the highest non-English speaking percentile in the city. Without this factor, Hispanic admission to Selective Enrollment High Schools would have fallen significantly. The local school performance variable was added after the pilot year of the
admission was observed. Because of residential segregation, community poverty, and violence, schools within predominantly Black communities (tracts) are the worst performing in the city. Thus, when school quality was taken into account, Black enrollment rose because the SES variable percentile for all of these predominantly Black, low-income communities dropped— making it less competitive for these students to gain admission (Thomas et al., 2011). The question remains, however, as to how well these variables are able to proxy race and maintain comparable student body composition post-racial affirmative action policy. Further, can this designed socioeconomic tier system be applied to other schools’ and districts’ policies—where Fisher v. Texas and Schuette v. Coalition to Defend Affirmative Action threaten race-factored admissions policies and affirmative action altogether?
The Origins of Socioeconomic Affirmative Action
Since racial affirmative action policy was introduced during Civil Rights era, popular opinion in the United States regarding affirmative action—once touted a guarantor of equity— has shifted dramatically. In a national survey conducted by Gallup, only 28% of American adults stated that they felt race should be taken into account in college admissions decisions, and policy in many states and school districts reflects this sentiment. Further, about two-thirds of respondents believed that applicants should be evaluated based solely on merit. While opinions on the importance of affirmative action vary by racial group (with 22% of Whites favoring racial affirmative action, versus 48% and 31% of Black and Hispanic respondents, respectively), less than half of all minority groups believe that race should be a considered factor (2013).
ban on racial affirmative action in 1996 (Proposition 209), minority enrollment dropped drastically at the state’s top colleges: after UCLA implemented this policy in 1998, by 2006, only about 2% of the entering first-year class was Black (Hayasaki, 2006). A study conducted by Anthony Carnevale and Stephen J. Rose found that if performance (as measured by grades and test scores) were the sole basis of student admission, only 4% of the seats at the top 146 colleges in the U.S. would be occupied by Black and Latino students (2004). In New York City’s Specialized High Schools, where admission is determined only by rank-order entrance exam performance, only 5% of Black and 6.7% of Latino students who applied were offered admission into any of the Specialized High Schools (versus almost 31% and 35% acceptance rates for White and Asian students, respectively), although nearly 70% of all public school students in New York City are minorities. At Stuyvesant High School, the most selective program of the Specialized High Schools, only 19 Black applicants were offered seats in a class of 967 students (NAACP Legal Defense and Education Fund, 2012). Meritocratic admissions policies do little to ensure equality of access for minority students. Thus, it is imperative that some form of affirmative action is taken where diversity is considered valuable.
Even Schuette v. Coalition to Defend Affirmative Action (2014), which constitutionally sustains racial affirmative action bans, holds that diversity is a compelling state interest. The question, rather, concerns the consideration of race-neutral alternatives to achieve this end: for example, whether or not socioeconomic affirmative action could protect racial diversity within schools as attempted by the Chicago Public Schools.
students at 4,000 schools across the United States found that when it comes to educational outcomes, what is “put into” schools is less important that who is enrolled. The landmark study determined that school characteristics and inputs—like funding, facilities, resources and school day length—had no determinate positive impact on student achievement and attainment, as measured by academic performance and graduation rates. Coleman found, instead, that the social class was the only accurate predictor of academic success: socioeconomically
disadvantaged students consistently achieved lower scores and levels of attainment then their middle- and upper-middle class peers. Summarizing his findings, Coleman (1966) reported:
Taking all these results together, one implication stands out above all. That schools bring little influence to bear on a child’s achievement that is independent of his background and general social context; and that this very lack of an independent effect means that the inequalities imposed on children by their home, neighborhood, and peer environment are carried along to become the inequalities with which they confront adult life at the end of school. For equality of educational opportunity through the schools must imply a strong effect of schools that is independent of the child's immediate social environment, and that strong independent effect is not present in American schools (325).
gap—which has nonetheless persisted into the twenty-first century—could be addressed by creating diverse classrooms. These discoveries subsequently changed the modern understanding of educational equality and social reproduction. If schools were to provide equal opportunity for all students, integration was vital (Coleman, 1966). Accordingly, this study was the basis of many of the desegregation busing policies that were decreed during the latter half of the 20th century.
The relationship between social class and race was perhaps more definite during the early years of desegregation, as defined by Coleman and his contemporaries, than it is in the twenty-first century. This connection, combined with the collective racial equality movement, shaped the quota-based busing systems that defined public education policy during the 1970s and 1980s. These widespread desegregation policies—which, when decreed, were aimed at correcting past discriminations, rather than providing for equality of opportunity explicitly—were set to expire once each offending school district had achieved unitary status; when the magnitude of the original harm for the affected minority groups had been sufficiently amended. Consequently, many of these policies expired or were vacated after the probationary period ended, and as a result, de facto segregation within school systems and districts—based upon residential
action policy, aiming to influence school composition through a legal—and effectual—social categorical variable.
The socioeconomic-peer effects theory demonstrated by Coleman in 1966 has been revalidated and substantiated by other scholars (Jencks, 1972; Wilson, 1969), but incorporating a standalone socioeconomic variable-based cannot equitably become policy because it
systematically favors White applicants. Although Black and Hispanic students are
disproportionately overrepresented within the low-income social tiers, poor Whites still vastly outnumber these Black and Hispanic students (Carnevale & Rose, 2004). Additionally, low-income White students still perform markedly better than their minority peers: of the highest-performing low-income students (90th percentile test scores), only 17.3% were Black or Hispanic (Kane, 1998).
affirmative action policy (Carnevale & Rose, 2004). Thus, socioeconomic status cannot be used as a sole variable when developing innovative affirmative action admissions policies, as the results would be unduly biased against minority students.
Chapter 3. Research Design: Data and Methods
As alternatives to racial affirmative action are considered nationally, I will evaluate the efficacy of the Chicago Public Schools’ new socioeconomic status-based admissions policy as a solution to maintain minority representation. Ultimately, this thesis will address two questions:
1. Does the SES-based affirmative action policy have an effect on demographic group enrollment, relative to racial affirmative action (i.e., quota system)?
2. How can other school systems and institutions adapt this admissions model to satisfy diversity as race-based policies are placed under increased scrutiny?
Data and Data Collection
Data from various actors surrounding the operations of the Selective Enrollment High School (SEHS) program was sourced to analyze the impact of the socioeconomic status-based admissions policy on racial and ethnic group enrollment. In addition to enrollment counts and proportions, which are of key interest, CPS demographic enrollment data is also examined as a control variable in the regression. All demographic count data collected is ratio level.
SEHS Enrollment Data
The enrollment data utilized in this analysis comes directly from the Illinois State Board of Education (ISBE), which monitors matriculation to the Selective Enrollment and other public school programs in the City of Chicago. This information includes school-level demographic data concerning race and ethnicity, among many other measures (for example: percent free and reduced-lunch, school locations, principal information, student standardized test scores, etc.). For the purposes of this study, I examined Fall 2006-2013 Grade 9 demographic enrollment totals per school. Data from eight schools: Gwendolyn Brooks College Preparatory High School, Jones College Preparatory High School, King College Preparatory High School, Lane Technical High School, Lindblom Math and Science Academy, Northside College Preparatory High School, Walter Payton College Preparatory High School, and Whitney Young Magnet High School, were utilized to analyze school- and SEHS-level demographic shifts as a result of the new admissions policy.7
7 Although there are ten total Selective Enrollment High Schools, the remaining two schools—Westinghouse High
The SEHS Grade 9 enrollment data for each school are coded: White, Black, Hispanic, Asian8 and Minority. The fifth group, Minority, is generated as the sum of Black, Hispanic and Asian enrollment in a given year. I will not examine trends in multiracial or Native American enrollment, as these categories were inconsistently reported year-to-year. Appendix C illustrates total Grade 9 demographic group enrollment proportions and counts, per year, for each Selective Enrollment High School included in the study.
CPS Enrollment Data
The Chicago Public Schools has publicly reported annual data on student demographics since 1999. These global trends in system enrollment, enumerated in Appendix A, illustrate shifting demographic shares within CPS overall (as Hispanic enrollment rises and Black
enrollment drops), of which SEHS enrollments are a small part. This is especially important as trends in national minority populations indicate that the proportion of minority students in public schools (particularly the Hispanic population), especially in urban areas, will increase
substantially into 2025 (National Center for Education Statistics, 2010). Thus, annual Grade 9 demographic enrollment proportions for CPS are used to control for global student population trends across all Chicago Public Schools. The CPS Grade 9 enrollment data are coded: White, Black, Hispanic, Asian and Minority (similarly). Appendix D illustrates total Grade 9
demographic group enrollment counts, per year, for the Chicago Public Schools.
Empirical Method: Linear Regression
The Blue Ribbon Committee, in design of the 2011 Admissions Policy for Magnet, Selective Enrollment and Other Options For Knowledge Schools and Programs, put forth as a priority sustaining diversity in the Chicago Public Schools’ Selective Enrollment High Schools.
8 From Fall 2010-2013, ISBE reporting of Asian enrollment split into three categories: Asian, Asian/Pacific Islander
However, the legal environment surrounding voluntary racial affirmative action in public schools was not supportive of the historically effective quota system. Under these circumstances, the committee crafted a policy that aimed to produce race-neutral diversity through a devised socioeconomic status tiered system (SES admissions policy). A regression model can estimate the effect of this new policy on demographic enrollment proportions for each group when compared to the baseline proportions produced by the vacated quota policy, relating the proportions from each cohort.9 Demographic enrollment proportions for each coded group (White, Black, Hispanic, Asian and Minority) are derived from the total enrollment counts.10 In my analysis, the treatment is defined as whether or not the SES admissions policy was in effect in year t, and is described by a binary variable, Treatst = {0,1}, where Treatst takes on a value of
1 where school s was operating the SES policy in year t, and 0 otherwise. The treatment
coefficient, β1, will indicate the effect of the SES admissions policy on demographic enrollment.
β1 can also be interpreted as the difference in demographic enrollment proportion for a specific
demographic group, Y, between SES and quota admissions policies. The outcome of interest, Yst,
is the proportion of incoming Grade 9 enrollees of a particular race or ethnicity (e.g., White, Black, Hispanic) at a Selective Enrollment High School, s, in year t. Thus, this model will answer the question: is demographic enrollment affected by the new SES admissions policy? The model is summarized by the equation:
Yst = β0 + β1Treatst + β2t +
σ
s +ε
st (4)
9 Where the cohorts are split based upon admissions policy type (quota, SES). Practically, the two groups will
constitute data from each of the eight schools in fall enrollment years 2006-2010 and 2011-2013 correspondingly. 10 Note that these proportions will not sum to 1 as Native American, multiracial, other, and non-reporting groups are
Where t is a linear trend and
σ
s represents school fixed effects (i.e., a dummy variable for eachschool). In all regressions, the error term,
ε
st, is assumed to be normally distributed with a meanof 0. To develop a more robust model, school-specific time trends were added to account for variation in enrollment trends over time unique to each school, where (
σ
s * t) capturesschool-specific linear time trends, giving:
Yst = β0 + β1Treatst + (
σ
s * t) +σ
s +ε
st (5)Finally, the most robust regression model tested is given by the equation:
Yst = β0 + β1Treatst + (
σ
s * t) +σ
s + β3ρt +ε
st (6)Where the control variable, ρt, is added to the regression to capture trends in the average
demographic enrollment proportion of all Grade 9 students entering any CPS high school in year t. This variable controls for systemic demographic enrollment changes (whereby, for example, increases or decreases in CPS Grade 9 demographic proportions could partially explain matching SEHS trends), isolating the composition effect of the treatment on the entering SEHS class.
The aforementioned regression models are estimated separately for each racial/ethnic group—White, Black, Hispanic, Asian and Minority—to determine the effect of the
Limitations of Data
Sample Size
Given the relative novelty of the socioeconomic status-based admissions policy, the analysis is limited to only three years of post-implementation data. As only four years of pre-policy data are analyzed (to control for exogenous historical effects), the sample size for each regression is to N = 56 (school-by-year observations). Following the regression framework outlined, a more compelling test can be explored with a larger sample size in subsequent years. Application Trends
The 2010 SEHS admissions policy change was highly publicized when it was
implemented, and influenced many families’ and students’ decisions and application processes for high school. Further, as the policy continues, popular knowledge of the relative difficulty of SEHS acceptance for a student from a Tier 3 or 4 neighborhood (with virtually or near perfect admissions scores required at the top Selective Enrollment High Schools) may discourage application to the SEHS program altogether. Tier status may affect the likelihood of a student applying to, and thus enrolling in, a Selective Enrollment High School: thus, if there is
quantifiable a behavioral effect of the new policy that influences application, pre- and post-policy application rates per tier11 must be included in the regression to determine if the SEHS demographic proportions are affected by changes in applicant behavior. These data were not included in the analysis for two reasons: one, it is not publicly available; and two, preparing the
11 Application rates per tier would be considered for the regression model over racial/ethnic group application trends
data for inclusion in the regression model would add immense complexity.12 However, the most robust regression model would include controls for SEHS application rate trends.
12 Including tier-factored trends into the regression would require retroactive tier assignment, based on the
Chapter 4. Results
This chapter is organized in two sections: descriptive statistics and regression analysis. The first section summarizes data on the sample, giving the means and standard deviations of Grade 9 racial/ethnic demographic proportions within the Selective Enrollment High Schools and CPS. The second section examines the regression models applied to quantify the effect of the socioeconomic status-based admissions policy on racial/ethnic group enrollment. Two regression models are presented and interpreted: the first measures treatment effect controlling for time trends, and the second measures treatment effect controlling for both time trends and CPS system demographic enrollment trends. The latter regression model suggests that the SES admissions policy has a significant negative effect on Black and minority SEHS enrollment.
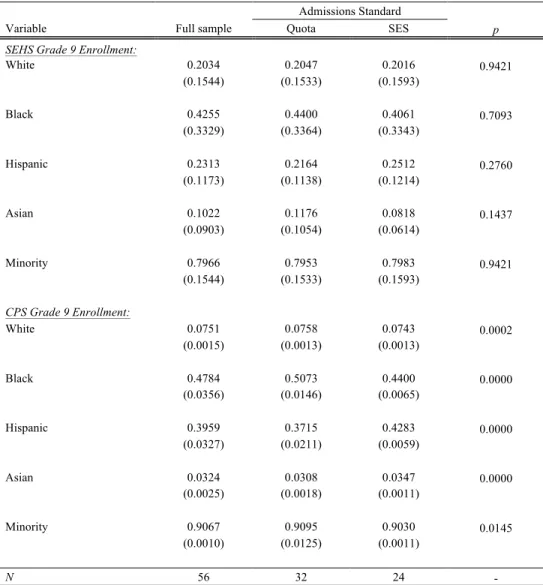
Descriptive Statistics
Ratio level data on enrollment counts and proportions within the Chicago Public Schools and Selective Enrollment High Schools was collected to inform the examined relationship between the new SES admissions policy and demographic enrollment. Table 1 on the following page presents mean characteristics for the SEHS sample (N = 56) of demographic enrollment proportions and CPS sample of demographic enrollment proportions over Fall 2006-2013 (excluding Fall 2010). Means and standard deviations of enrollment proportions under each admissions policy are also given in order to establish variation in proportion, and a simple t-test to measure the difference between pre- and post-policy enrollment. More detailed source data (counts for Grade 9 demographic enrollment from Fall 2006-2013) on SEHS and CPS
annual Grade 9 demographic enrollment trends at each Selective Enrollment High School, as they vary considerably.13
Sight analysis of the SEHS mean differences between racial/ethnic group proportions under the two admissions policies indicates a slight variation in enrollment, although no changes are significant. (However, there are significant changes in CPS Grade 9 demographic enrollment proportions over time.) Regression analysis of the socioeconomic status-based policy treatment is used to determine whether or not variation in SEHS enrollment is explained by the effect of the new admissions standards, controlling for time and CPS Grade 9 enrollment.
13 This variability motivated the inclusion of the school effect dummy variable,
σ
TABLE 1. Descriptive Statistics: SEHS and CPS Grade 9 Enrollment Proportions
Admissions Standard
Variable Full sample Quota SES p
SEHS Grade 9 Enrollment:
White 0.2034 0.2047 0.2016 0.9421
(0.1544) (0.1533) (0.1593)
Black 0.4255 0.4400 0.4061 0.7093
(0.3329) (0.3364) (0.3343)
Hispanic 0.2313 0.2164 0.2512 0.2760
(0.1173) (0.1138) (0.1214)
Asian 0.1022 0.1176 0.0818 0.1437
(0.0903) (0.1054) (0.0614)
Minority 0.7966 0.7953 0.7983 0.9421
(0.1544) (0.1533) (0.1593)
CPS Grade 9 Enrollment:
White 0.0751 0.0758 0.0743 0.0002
(0.0015) (0.0013) (0.0013)
Black 0.4784 0.5073 0.4400 0.0000
(0.0356) (0.0146) (0.0065)
Hispanic 0.3959 0.3715 0.4283 0.0000
(0.0327) (0.0211) (0.0059)
Asian 0.0324 0.0308 0.0347 0.0000
(0.0025) (0.0018) (0.0011)
Minority 0.9067 0.9095 0.9030 0.0145
(0.0010) (0.0125) (0.0011)
N 56 32 24 -
Note. Standard deviations are given in parenthesis below the means. Full sample includes Fall 2006-2013
Regression Analysis: SES Policy Effect on Racial/Ethnic Group Enrollment Proportions
The first model presented captures the effect of the socioeconomic status-based admissions policy on enrollment proportions for a given demographic group (White, Black, Hispanic, Asian and Minority), with the predicted outcome proportion Y controlled by time trends, which are included in the model globally (CPS-level trends) and at an individual school level. Table 2 presents the results of this analysis for each coded demographic outcome
proportion, where panel A estimates treatment effect given a global time trend (equation 4) and panel B estimates effect given school-specific time trends (equation 5). The second multivariate regression model introduces control for each demographic CPS Grade 9 enrollment cohort over the examined time period. Table 3 presents the results from estimations of equation 6 (also including global time trends) on outcome proportion Y for each demographic. Comparing the similar results of the two regression models, it is evident that controlling for the linear CPS Grade 9 enrollment trends indicates that the SES-effect predictions are robust to system-wide demographic variations. Thus, forthcoming discussion on the empirical results will focus on the second, more robust regression model (presented in Table 3).
The regression model suggests that the socioeconomic admissions policy, when
TABLE 2. Impact of SES Policy on Demographic Enrollment Proportions
Proportion Enrollment
White Black Hispanic Asian Minority
Variable (1) (2) (3) (4) (5)
A. Global Time Trend
Treatment 0.0353 -0.0617 0.0114 -0.0427 -0.0353
(0.0315) (0.0324)* (0.0236) (0.0329) (0.0315)
Year -0.0085 0.0062 0.0052 0.0015 0.0085
(0.0064) (0.0065) (0.0046) (0.0045) (0.0064)
B. School-Level Time Trend
Treatment 0.0353 -0.0617 0.0114 -0.0427 -0.0353
(0.0342) (0.0352) (0.0256) (0.0357) (0.0342)
Brooks - Trend -0.0068 0.0127 -0.0039 0.0077 0.0068
(0.0063) (0.0065)* (0.0047) (0.0066) (0.0063)
Jones - Trend -0.0080 0.0073 0.0008 -0.0020 0.0080
(0.0063) (0.0065) (0.0047) (0.0066) (0.0063)
King - Trend -0.0085 0.0106 0.0011 0.0074 0.0085
(0.0063) (0.0065) (0.0047) (0.0066) (0.0063)
Lane - Trend -0.0082 0.0043 0.0050 0.0027 0.0082
(0.0063) (0.0065) (0.0047) (0.0066) (0.0063)
Lindblom - Trend -0.0087 -0.0075 0.0154 0.0105 0.0087
(0.0063) (0.0065) (0.0047)** (0.0066) (0.0063)
Northside - Trend -0.0099 0.0214 0.0073 -0.0179 0.0099
(0.0063) (0.0065)** (0.0047) (0.0066)** (0.0063)
Payton - Trend -0.0118 0.0030 0.0031 -0.0001 0.0118
(0.0063) (0.0065) (0.0047) (0.0066) (0.0063)
Young - Trend -0.0062 -0.0026 0.0127 0.0040 0.0062
(0.0063) (0.0065) (0.0047)** (0.0066) (0.0063)
Include Grade 9 demographic
enrollment controls No No No No No
Outcome mean enrollment
proportion (baseline): 0.2047 0.4400 0.2164 0.1176 0.7953
N 56 56 56 56 56
R2 0.9716 0.9922 0.9633 0.9373 0.9716
Note. Models are estimated with a robust ordinary least squares regression, accounting for demographic enrollment clustering effects
within each school over time (reflected in given standard errors). Predictions of enrollment proportions are given based on historical demographic 9th-grade Selective Enrollment data over time, pre- and post-SES admissions policy implementation (treatment), controlling for time trends. Time trends are controlled utilizing either a global (CPS) trend variable or school-specific time trend variables, and both regressions are given (models A and B respectively). All models also include school fixed effects. Given baseline
means reflect mean SEHS demographic enrollment pre-treatment. Reported R2 values reflect regression models given school-level time
trends. Standard errors appear in parenthesis below the beta coefficients; significance of standard errors is indicated: * = p≤ 0.10, ** = p
TABLE 3. Impact of SES Policy on Demographic Enrollment Proportions, Controlling for
CPS Enrollment Trends
Proportion Enrollment
White Black Hispanic Asian Minority
Variable (1) (2) (3) (4) (5)
A. Global Time Trend
Treatment 0.0458 -0.0579 0.0173 -0.0427 -0.0703
(0.0335) (0.0246)** (0.0189) (0.0332) (0.0375)*
Year -0.0098 0.0079 -0.0027 0.0021 0.0148
(0.0066) (0.0126) (0.0096) (0.0040) (0.0075)*
B. School-Level Time Trend
Treatment 0.0458 -0.0579 0.0173 -0.0427 -0.0703
(0.0364) (0.0268)* (0.0206) (0.0361) (0.0408)
Brooks - Trend -0.0080 0.0145 -0.0118 0.0083 0.0130
(0.0065) (0.0135) (0.0113) (0.0061) (0.0075)
Jones - Trend -0.0092 0.0091 -0.0071 -0.0014 0.0142
(0.0065) (0.0135) (0.0113) (0.0061) (0.0075)*
King - Trend -0.0098 0.0124 -0.0068 0.0079 0.0148
(0.0065) (0.0135) (0.0113) (0.0061) (0.0075)*
Lane - Trend -0.0095 0.0061 -0.0029 0.0033 0.0145
-0.0065 (0.0135) (0.0113) (0.0061) (0.0075)*
Lindblom - Trend -0.0099 -0.0057 0.0075 0.0111 0.0150
(0.0065) (0.0135) (0.0113) (0.0061) (0.0075)*
Northside - Trend -0.0111 0.0232 -0.0006 -0.0173 0.0161
(0.0065) (0.0135) (0.0113) (0.0061)** (0.0075)*
Payton - Trend -0.0131 0.0048 -0.0048 0.0005 0.0181
(0.0065)* (0.0135) (0.0113) (0.0061) (0.0075)**
Young - Trend -0.0075 -0.0008 0.0049 0.0046 0.0125
(0.0065) (0.0135) (0.0113) (0.0061) (0.0075)
Include Grade 9 demographic
enrollment controls Yes Yes Yes Yes Yes
Outcome mean enrollment
proportion (baseline): 0.2047 0.4400 0.2164 0.1176 0.7953
N 56 56 56 56 56
R2 0.9724 0.9922 0.9639 0.9374 0.9740
Note. Models are estimated with a robust ordinary least squares regression, accounting for demographic enrollment clustering effects
within each school over time (reflected in given standard errors). Predictions of enrollment proportions are given based on historical demographic 9th-grade Selective Enrollment data over time, pre- and post-SES admissions policy implementation (treatment), controlling for time trends and changes in overall 9th-grade CPS matriculation demographics. Time trends are controlled utilizing either a global (CPS) time trend variable or or school-specific time trend variables, and both regressions are given (models A and B
respectively). All models also include school fixed effects. Given baseline means reflect mean SEHS demographic enrollment
pre-treatment. Reported R2 values reflect regression models given school-level time trends. Standard errors appear in parenthesis below the
Approaching statistical significance, the regression model also demonstrates treatment effects on White and Asian enrollment proportions: where a 4.6% positive SES policy treatment effect on White enrollment proportions is observed, versus a 4.3% negative treatment effect on Asian enrollment proportions. The model predicts no significant effect on Hispanic enrollment as a result of the new SES policy.14 Taken together, these findings indicate that the socioeconomic status-based admissions policy has harmed minority enrollment proportions, placing particular burden on Black students. Appendix F summarizes the policy effect for each demographic group given this regression model.
These results generally support the findings of earlier researchers, who have asserted that socioeconomic status-based admissions policies tend to favor White applicants (Carnevale & Rose, 2004; Kane, 1998; Koertz, et al., 2002; Sander, 1998; Slater, 1995). However, all previous studies examined postsecondary enrollment effects, sourcing data from large universities,
university systems, or groups of universities. Thus, my findings provide the first perspective on the enrollment effects of a socioeconomic status-based high school admissions policy, as
Chicago’s was the first SES-based high school admissions procedure to be implemented in a selective high school program. While this scale and sample size makes my results less
generalizable, ultimately, the results confirm that SES-based affirmative action policies result in lower minority enrollment relative to racial affirmative action policies.
14 Preliminary qualitative justification for this assertion suggests that this policy does not harm Hispanic enrollment,
Chapter 5. Findings and Conclusions
This thesis provides the first empirical evidence of the effect of socioeconomic status-based admissions policies on selection-status-based high school enrollment outcomes. In my analysis of the Chicago Public Schools’ Selective Enrollment High School admissions policies and enrollment trends, my findings show that SES-based admissions policies result in decreased enrollment for minority and Black students. Thus, my primary research question—whether or not the CPS SES-based admissions policy would provide comparable levels of diversity when held against the demographic enrollment outcomes ensured by quota systems—was answered, concluding that the SES-based admissions policy was not effective at matching quota level
diversity, and actually produced a significant drop in minority and Black enrollment proportions.
Alternative Hypothesis: Non-Linear Urban Population Trends
Although CPS system-wide enrollment trends were accounted for within the final regression model, the shifting demographics of Chicago could actually have a larger impact on the enrollment proportions than predicted in the model (by coefficient ρt). The strongest
nation’s Black population live in the suburbs—up from 43% in 2000 (The changing colour, 2011; Wolman, 1976).
As Black families leave the city core, fewer Black students enroll in the CPS—a trend illustrated in this study’s data. However, the analysis presumes that this trend is linear; based on the linear relationship observed, there is no treatment effect of the changing proportion of Black CPS enrollment on the proportion of Black students enrolled in Selective Enrollment High Schools. Where these enrollment and urban population trends are non-linear, both the significance and magnitude of the SES policy treatment effect on Black enrollment would decrease where these trends are negative, which could render an SES treatment effect near 0 where these population trends are most pronounced. In turn, as the negative modeled minority enrollment treatment effect is largely driven by Black enrollment proportion changes, this could indicate the affected decrease in Black and minority enrollment outcomes from the new SES-based policy are explained by overall urban population trends, rather than Selective Enrollment admissions policies (which could further imply that the policy is decidedly effective at
Implications
Analysis indicates that the current CPS socioeconomic status-based policy will produce significant, albeit minimal, decreases in Black (5.8%) and minority (7%) demographic
enrollment within Selective Enrollment High Schools. Additionally, decreases in Asian enrollment (4.3%) and increases in White enrollment (4.6%) approach significance. Thus, the policy neither improves nor maintains minority or minority group representation compared to a race-based affirmative action policy, like a quota system. However, despite the marginal predicted changes in enrollment proportions, the policy still works to maintain a critical mass of minority students.
It is unlikely that a race-neutral affirmative action policy will ever be able to produce equivalent levels of racial diversity within programs and schools compared to a racial affirmative action. Conversely, it is more important to note that the socioeconomic status-based admissions policy prescribed by Chicago Public Schools’ Admissions Policy for Magnet, Selective
Enrollment and Other Options For Knowledge Schools and Programs is still a valid diversity maintenance tool. Although it does result in decreased Black and minority enrollment when compared to the vacated racial quota system, compared at face value to other race-neutral
UCLA, where the new policy can be benchmarked against pre-Proposition 209 (1996)
admissions data, the SES-policy produced a class with 73.2% fewer Black students, compared to affirmative action enrollment data from 1990-1996 (Sander, 1998). In the Chicago Public Schools, the statistically significant decreases in Black and minority enrollment proportions observed are considerably less severe. The CPS policy was well designed and specific, taking care to account for minority demographic groups (particularly, Black and Hispanic) with targeted race-neutral variables, which have allowed the policy to escape much of the White bias seen in most SES-based affirmative action. Thus, although the CPS policy is decidedly less effective at producing high levels racial diversity than a quota system, it is one of the strongest alternatives to racial affirmative action policies available. Ultimately, my conclusions indicate that a socioeconomic status-based tiered affirmative action policy can deliver acceptable, and perhaps one day equitable, levels of minority group representation within schools.