The goal of this project is for you to
pick a topic you are interested in and think of a question you would like to answer about this topic,
use the library or the internet to find data related to this topic,
find the equation that best fits your data, and
use your equation to answer your original question.
The following examples are to show you the variety of topics that can be studied. The number of unemployed workers in the U.S over the past year.
The number of people in the U.S. with AIDs.
The growth of the prison population as a function of time.
The amount of solid waste generated per person as a function of time. The Hispanic or Latino population in the U.S.
The weekly box office receipts for a movie after it has been released. The winning time in the Olympics for a particular event.
The minimum wage.
Procedure
1. Formulate a question: The first thing you need to do is pick an area or topic that you are interested in, and come up with a question that you would like answered. 2. Find relevant data. You must be careful in selecting your data set, since it must
relate two numeric quantities, such as year and population, and not relate a qualitative non-numeric quantity to a numeric quantity, such as race and age. The data set you use should have from 10 to 20 data points in it. Table 1 lists some different places to look for your data.
3. Review Question: After selecting an appropriate data set, you may need to revise your original question to fit the data that you found. You must state a question that can be answered from the data you selected.
4. Graphing Data: Identify the independent and dependent variable in your data and create a scatter plot in Excel.
5. Type of Model: Select the type of function that you think has a general shape similar to the general trend of your data.
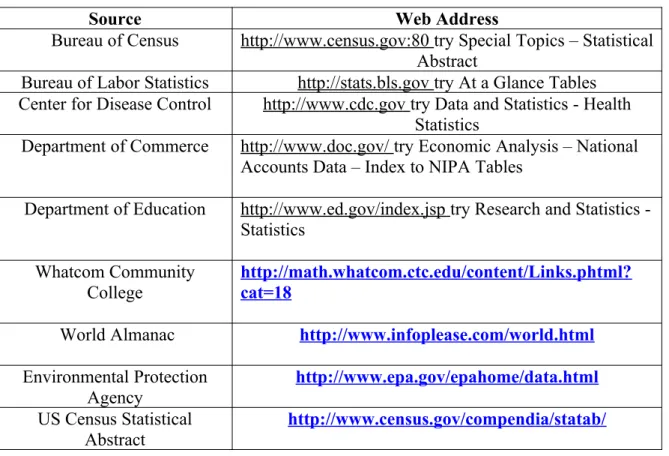
Table 1. Some Sources of Data
Source Web Address
Bureau of Census http://www.census.gov:80 try Special Topics – Statistical Abstract
Bureau of Labor Statistics http://stats.bls.gov try At a Glance Tables Center for Disease Control http://www.cdc.gov try Data and Statistics - Health
Statistics
Department of Commerce http://www.doc.gov/ try Economic Analysis – National Accounts Data – Index to NIPA Tables
Department of Education http://www.ed.gov/index.jsp try Research and Statistics -Statistics
Whatcom Community College
http://math.whatcom.ctc.edu/content/Links.phtml? cat=18
World Almanac http://www.infoplease.com/world.html
Environmental Protection Agency
http://www.epa.gov/epahome/data.html
US Census Statistical Abstract
http://www.census.gov/compendia/statab/
7. Coefficient of determination, r2 (R2). Interpret the R-squared value for your
equation to determine if your equation is a good fit to the data. Remember: the coefficient of determination represents the percent of the data that is the closest to the line of best fit. For example, if r 2 = 0.850, this means that 85% of the total
variation in y can be explained by the relationship between x and y (as described by the regression equation). The other 15% of the total variation in y remains unexplained. Do not place too much importance on small differences between r2
values, such as r2 = 0.987 and r2 = 0.984.
8. Application of Equation: Use your regression equation to answer your original question. Now think of two new questions, one where you will use interpolation to solve for the dependent variable. The other will be to use extrapolation to solve for the dependent variable.
10.Written Report: Turn in on the day of your presentation, a typed (12 point font) summary of your project. Your written report should include the information shown below. To make your paper easier to read, I suggest you use section headings like those shown below.
Title of project and your name I. Introduction
Describe the motivation for the project, why did you select this topic.
State the question that you want to answer. II. Data
Explain the source for the data you found.
Present the data in a table and a scatter graph (no lines).
Discuss the general trend of the data and which model or models you tried to fit to your data.
III. Data Analysis
How good of a fit was your equation to the data?
Show a graph of your data with the regression equation on it. IV. Results
Use your equation to answer your original question.
Use your equation to answer a new question that requires you to solve for the dependent variable that is in the domain of your data.
Use your equation to answer a new question that requires you to solve for the independent variable that is outside the domain of your data.
V. Conclusion
South Seattle Community College
Classroom Presentation
Name: ________________________ Teacher: Rick Downs
Date of Presentation: ____________ Title of Work: ___________________
Criteria Points
0 - 1 2 4 6
Organization
Audience cannot understand presentation because
there is no sequence of information. Audience has difficulty following presentation because student jumps around. Student presents information in logical sequence which audience can follow. Student presents information in logical, interesting sequence which audience can follow. ____ Subject Knowledge
Student does not seem to understand what
they are doing.
Student presented some of the
required information about
the project.
Student presented the most of the
required information for
the project.
Student gave a complete description of the
project.
____
Mechanics
Student's presentation had spelling and/or grammatical errors, and the font size makes slides hard to read.
Spelling, punctuation, and grammar errors distract or impair readability. (3 or more errors)
The text is clearly written with a couple of errors in grammar, punctuation, and/ or spelling. Presentation has no misspellings or grammatical errors. The fonts are easy-to-read
and point size varies appropriately for headings and text.
____
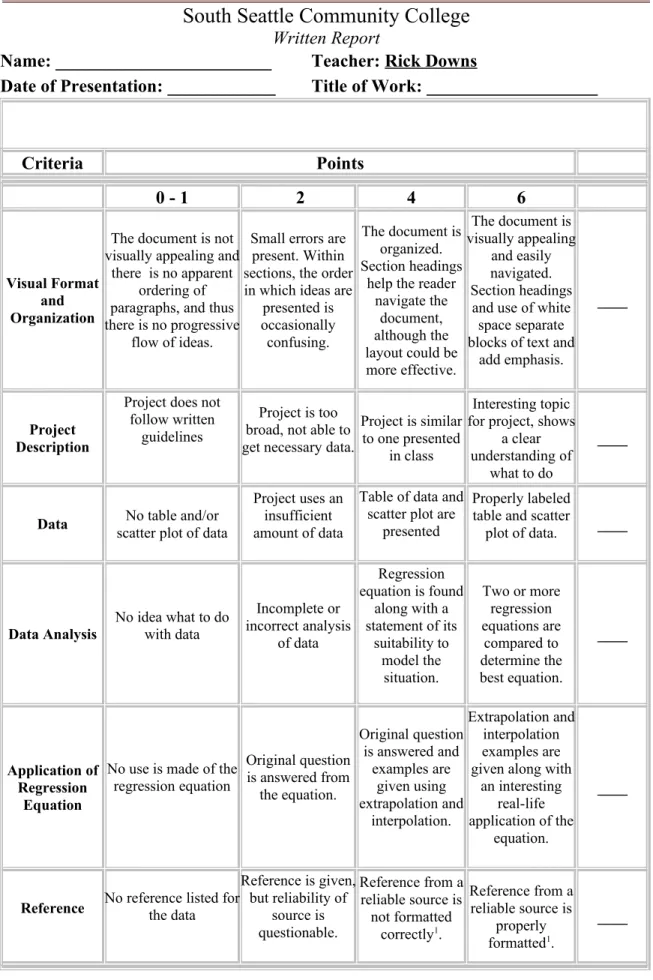
South Seattle Community College
Written Report
Name: ________________________ Teacher: Rick Downs
Date of Presentation: ____________ Title of Work: ___________________
Criteria Points
0 - 1 2 4 6
Visual Format and Organization
The document is not visually appealing and
there is no apparent ordering of paragraphs, and thus there is no progressive
flow of ideas.
Small errors are present. Within sections, the order in which ideas are
presented is occasionally confusing.
The document is organized. Section headings
help the reader navigate the
document, although the layout could be more effective.
The document is visually appealing
and easily navigated. Section headings
and use of white space separate blocks of text and
add emphasis.
____
Project Description
Project does not follow written
guidelines
Project is too broad, not able to get necessary data.
Project is similar to one presented
in class
Interesting topic for project, shows
a clear understanding of
what to do
____
Data scatter plot of dataNo table and/or
Project uses an insufficient amount of data
Table of data and scatter plot are
presented
Properly labeled table and scatter
plot of data. ____
Data Analysis
No idea what to do with data
Incomplete or incorrect analysis
of data
Regression equation is found
along with a statement of its
suitability to model the
situation.
Two or more regression equations are compared to determine the best equation. ____ Application of Regression Equation
No use is made of the regression equation
Original question is answered from
the equation.
Original question is answered and
examples are given using extrapolation and interpolation. Extrapolation and interpolation examples are given along with
an interesting real-life application of the
equation.
____
Reference No reference listed forthe data
Reference is given, but reliability of
source is questionable.
Reference from a reliable source is not formatted
correctly1.
Reference from a reliable source is
properly formatted1.
Total
---->
____Footnote:
1. To properly cite a reference, follow the The Chicago Manual of Style
(http://www.chicagomanualofstyle.org/tools_citationguide.html)
The following example (from the above website) shows how to reference material from a website:
Evanston Public Library Board of Trustees. “Evanston Public Library Strategic Plan, 2000–2010: A Decade of Outreach.” Evanston Public Library.
This project covers the following Student Learning Objectives
Communication
Computation
Critical Thinking
Technology