ACCESS TO HEALTH CARE: PERSPECTIVES ON TRANSPORTATION AS A SOCIAL DETERMINANT OF HEALTH
Mary Katherine Wolfe
A dissertation submitted to the faculty at the University of North Carolina at Chapel Hill in partial fulfillment of the requirements for the degree of Doctor of Philosophy in the
Department of City & Regional Planning in the College of Arts and Sciences.
Chapel Hill 2020
Approved by:
Noreen C. McDonald G. Mark Holmes T. William Lester Alainna Thomas
© 2020
Mary Katherine Wolfe ALL RIGHTS RESERVED
iii
ABSTRACT
Mary Katherine Wolfe: Access to Health Care: Perspectives on Transportation as a Social Determinant of Health
(Under the direction of Noreen C. McDonald)
Transportation has a profound impact on a person’s ability to access health care, and ultimately receive timely medical care. Increasingly, transportation is recognized for its role in fulfilling public health needs. In a time of growing health disparities, research is needed to understand how transportation availability impacts access to care and in what ways innovation in the transportation sector might address these challenges. This dissertation contributes to this gap by examining the role of transportation as a social determinant of health in three related papers.
In the first paper, I use nationally representative data to estimate the prevalence of transportation barriers to health care in the United States. I look at longitudinal trends as well as sociodemographic and health correlates of this barrier. I find that 5.8 million people in the U.S. delayed medical care because of a lack of transportation in 2017, and this barrier
disproportionately affects individuals who are poor and who have chronic conditions.
In the second paper, I examine how public transportation connects people with medical care in a rural setting. I determine the scope and nature of health care transportation provided by the sole transit provider in a rural North Carolina county, analyzing spatial patterns of trip demand and differences in trip characteristics by funding source. This study showcases how the health needs of a community ultimately influence the behavior of a rural transit agency.
the ways in which ridesourcing technology is being leveraged to transport people to medical care and proposes a typology of innovative health care transportation services.
These analyses document a significant and persistent problem in access to health care in the U.S. Findings suggest that transportation to health facilities should remain an important consideration in health care delivery at the federal level, at the level of state and local
v
ACKNOWLEDGMENTS
I have had the privilege of working with Dr. Noreen McDonald since arriving at UNC in 2014. Noreen has been the best example of a leader and mentor, and I cannot imagine what my PhD journey would have been like without her steadfast support. She has instilled in me a sense of confidence and assuredness as a researcher, and has consistently cleared the way for me to achieve my goals. I am grateful for her trust in my abilities and for opening up so very many research opportunities to me in the last six years.
My dissertation committee has provided invaluable disciplinary perspectives on a topic that is vitally interdisciplinary. In and out of the classroom, Dr. Mark Holmes has encouraged me to refine my methodological skillset and think critically about health care delivery. Dr. Bill Lester expanded my understanding of what it means to pursue justice in planning. Dr. Allie Thomas reminds me to consider the future of transportation and I can always count on her to be in attendance at my conference talks. Dr. Kristen Hassmiller Lich emphasized the import of systems thinking which has added meaningful nuance to the research products of this dissertation.
vii
I am thankful for financial support from the U.S. Department of Transportation Eisenhower Graduate Fellowship and the Southeastern Transportation Research, Innovation, Development, and Education (STRIDE) Center, which is part of the U.S. Department of Transportation’s University Transportation Centers Program.
TABLE OF CONTENTS
LIST OF TABLES ... x
LIST OF FIGURES ... xi
LIST OF ABBREVIATIONS ... xii
CHAPTER 1: INTRODUCTION ... 1
Access to Health Care ... 1
Transportation as a Social Determinant of Health ... 3
Dissertation Summary ... 4
CHAPTER 2: TRANSPORTATION BARRIERS TO HEALTH CARE IN THE UNITED STATES: FINDINGS FROM THE NATIONAL HEALTH INTERVIEW SURVEY, 1997–2017... 7
Abstract ... 7
Introduction ... 8
Background ... 9
Methods ... 12
Results ... 14
Discussion ... 21
Conclusion ... 24
CHAPTER 3: COMMUNITY TRANSPORTATION AND ACCESS TO HEALTH CARE IN RURAL NORTH CAROLINA ... 26
Abstract ... 26
Introduction ... 27
ix
Data and Methods ... 31
Results ... 33
Discussion ... 42
Conclusion ... 43
CHAPTER 4: INNOVATIVE HEALTH CARE MOBILITY SERVICES IN THE U.S. ... 45
Abstract ... 45
Background ... 46
Data and Methods ... 52
Results ... 55
Discussion ... 60
Conclusion ... 62
CHAPTER 5: CONCLUSION ... 64
Summary of Research Findings ... 64
Implications for Policy and Planning ... 65
Future Research Needs ... 68
APPENDIX ... 70
LIST OF TABLES
Table 1. Prevalence and Group Differences of Transport Barriers to Care Among
U.S. Adults in 2017... 17 Table 2. Correlates of Transport Barriers to Care Among U.S. Adults in 2017 ... 20 Table 3. Community Transportation Trips by Trip Purpose in Anson County,
NC (2019) ... 33 Table 4. Funding for Health-Related Community Transportation in Anson County,
xi
LIST OF FIGURES
Figure 1. Transportation barriers to health care in the United States, 1997-2017 (all ages) ... 15 Figure 2. Anson County, North Carolina ... 31 Figure 3. Intra-County Trips to Dialysis provided by Community Transportation
in Anson County, NC in 2019 (n=4,783) ... 38 Figure 4. Inter-County Trips to Dialysis provided by Community Transportation
in Anson County, NC in 2019 (n=40) ... 39 Figure 5. Origins and Destinations of Trips to Other Medical Purposes provided
by Community Transportation in Anson County, NC in 2019 (n=5,001) ... 40 Figure 6. Density of Trips to Other Medical Purposes provided by Community
LIST OF ABBREVIATIONS
ACOs Accountable care organizations ACTS Anson County Transportation System ADA Americans with Disabilities Act DSS Division of Social Services
ED Emergency department
EDTAP Elderly and Disabled Transportation Assistance Program EMRs Electronic medical records
ESRD End stage renal disease
HIPAA Health Insurance Portability and Accountability Act MBTA Massachusetts Bay Transportation Authority
MCOs Managed care organizations
NEMT Non-emergency medical transportation NHIS National Health Interview Survey RGP Rural General Public
1
CHAPTER 1: INTRODUCTION
Access to Health Care
Demand for transportation is derived from our need to reach goods, services, and experiences that improve our quality of life. The availability of viable transportation affects access to employment opportunities, nutritious foods, medical facilities, and other important drivers of health. Increasingly, we are recognizing the role of transportation in fulfilling public health needs. This dissertation examines transportation as a social determinant of health, and specifically, its impact on people’s ability to access health care, and ultimately receive timely medical care.
Within a transportation planning context, access to health care refers to one’s physical ability to travel to health-promoting institutions like doctors’ offices and pharmacies. While there are many demonstrated barriers to health care access, including socioeconomic constraints and health literacy limitations, transportation barriers continue to disproportionately challenge underserved communities (Health Outreach Partners, 2017). Beyond inhibiting a patient’s ability to reach their medical appointments, transportation barriers can prevent people from seeking care at all.
(Weingarten et al., 1997) and can exacerbate chronic disease and disease-related outcomes (Karter et al., 2004; Murdock et al., 2002; Schectman et al., 2008). Transportation barriers impact access to pharmacies and, thus, medication refills and adherence (Syed et al., 2013). When patients miss appointments, it negatively impacts clinical productivity as unused clinical space and staff time equate to loss of revenue (Kangovi et al., 2013; Nguyen & Dejesus, 2010; Syed et al., 2013).
Evidence suggests that transportation barriers are a significant impediment to health care access, especially for those with lower incomes or those who are underinsured or uninsured (Syed et al., 2013). This population of people, sometimes referred to as “transportation-disadvantaged,” often shift their care-seeking to more costly settings, such as the emergency department, based on preference or convenience. (Coster et al., 2017; Hwang et al., 2015;
Kangovi et al., 2013; Nguyen & Dejesus, 2010). Transportation barriers disproportionately affect individuals carrying the highest burden of disease as well as people of color, people with a disability, and those who are older, poorer, less educated, or female (Wallace et al., 2005).
For many people, driving oneself, getting a ride from friends or family, or taking public transit are viable modal options to access medical appointments. For those with mobility- or financial-related barriers, however, there are several specialized transportation options for such trips, such as paratransit services which include demand-responsive buses and vans; hospital- and care provider-based shuttles; and vehicles for hire, such as taxis. Many of these trips are funded by a Medicaid benefit called non-emergency medical transportation (NEMT), which facilitates access to medical services for beneficiaries. The goal of NEMT is to help low-income people overcome transportation barriers, yet many patients still end up missing their
3
times, limited flexibility, and lack of responsiveness to schedule changes (Ganuza & Davis, 2017).
Transportation as a Social Determinant of Health
In both academic and clinical settings, there is recent attention to addressing social determinants of health. Social determinants of health (SDOH) are the social, economic, behavioral, and environmental conditions across a person’s life that influence the trajectory of their health (Artiga & Hinton, 2018). SDOH are the forces within our communities that shape health disparities and perpetuate gaps in care. Many states, notably North Carolina, have leveraged Medicaid transformation to target SDOH. These efforts have emphasized programs that screen for and put into place programs that address health-related social needs such as transportation, housing, and food insecurity. These programs acknowledge and fill important gaps for many patients.
When the federal Centers for Medicare and Medicaid Services approved North Carolina’s 11151 waiver in October 2018, they granted the state’s Department of Health and Human
Services the authority to transition from a fee-for-service delivery system to a managed care program. This transition is centered on addressing non-medical (e.g. social, environmental) factors that drive health outcomes and costs. In the new system, North Carolina’s Medicaid managed care plans, called “Prepaid Health Plans,” will screen all beneficiaries using a standardized tool in order to assess their non-medical needs and consequently connect beneficiaries to resources.
The time is ripe to think critically about transportation as a SDOH, especially in terms of health care access. A study from 2005 estimated that 3.6 million Americans miss or delay non-emergency medical treatment every year due to lack of transportation to care facilities (Wallace et al., 2005). After fifteen years of population growth, increasing prevalence of chronic disease, and aging baby boomers, this estimate needs updating. Furthermore, research is required to inform stakeholders and policymakers in both transportation and public health sectors about the current state of transportation barriers to care, the complexity of access to medical care for specific populations and geographies, and how transportation innovations might provide solutions in certain contexts.
Dissertation Summary
This dissertation approaches transportation as a social determinant of health. In three papers, I examine the role of transportation in people’s ability to access medical care. I determine the magnitude and unequal distribution of transportation barriers to care in the U.S. (Chapter 2); assess how public transportation connects people to medical care in a rural area (Chapter 3); and catalog the ways in which advances in transportation technology is filling gaps in access
(Chapter 4).
5
longitudinal trends in this barrier over the last two decades. Then I examine correlates of this barrier across various health conditions and sociodemographic characteristics for the year 2017.
Of course, transportation to health care is inherently place-based which poses unique challenges for rural populations. Some studies have found that patients who live in nonurban areas face greater transportation barriers to health care than their urban counterparts (Henning-Smith et al., 2017; Probst et al., 2007; Skinner & Slifkin, 2007). Rural residents report longer travel times to see a physician, particularly a specialist (Reschovsky & Staiti, 2005) and vehicle access may be especially important in rural areas, where missed or delayed non-emergent medical care is often due to lack of access to a vehicle (Arcury et al., 2005). At the same time, Americans living in rural areas experience significant health disparities, including higher
incidence of chronic disease, increased mortality rates, and lower life expectancies (Rural Health Information Hub, 2019). Chapter 3 examines the role of public transportation in connecting people with medical care in a rural North Carolina county. This paper determines the scope and nature of transportation to medical facilities provided by the sole transit provider in Anson County, NC in 2019, including differences across trip characteristics, funding sources, and types of health care destinations served. This study showcases how the health needs of a community ultimately influence the behavior of a rural transit agency.
In recent years, in response to challenges with NEMT delivery and persistent transportation barriers to care reported by clinicians, insurance companies and health care
shared mobility. This research documents the ways in which ridesourcing technology and transportation network companies (TNCs) like Uber and Lyft are being leveraged to deliver transportation to medical care and proposes a typology of innovative health care mobility services.
7
CHAPTER 2: TRANSPORTATION BARRIERS TO HEALTH CARE IN THE UNITED STATES: FINDINGS FROM THE NATIONAL HEALTH
INTERVIEW SURVEY, 1997–20172
Abstract
Objectives: To quantify the number of Americans who delay medical care annually because of lack of available transportation and to examine the differential prevalence of this barrier across sociodemographic characteristics and patient populations.
Methods: We used data from the National Health Interview Survey (1997–2017) to examine this barrier over time and across groups. We used joinpoint regression analysis to identify significant changes in trends and multivariate analysis to examine correlates of this barrier for the year 2017.
Results: In 2017, 5.8 million Americans (1.8%) delayed medical care because they did not have transportation. The proportion reporting transportation barriers increased between 2003 and 2009 with no significant trends before or after this window within our study period. We found that Hispanic people, those living below the poverty threshold, Medicaid recipients, and people with a functional limitation have greater odds of reporting a transportation barrier after we controlled for other sociodemographic and health characteristics.
2This chapter has been accepted for publication as an article in the American Journal of Public Health. The citation is as follows: Wolfe, M.K., McDonald, N.C., and Holmes, G.M. (2020). “Transportation Barriers to Health Care in the US: Findings from the NHIS, 1997-2017.” American Journal of Public Health, e1–e8.
Conclusions: Transportation barriers to health care have a disproportionate impact on individuals who are poor and who have chronic conditions. Our study documents a significant problem in access to health care during a time of rapidly changing transportation technology.
Introduction
The generally poor performance of the U.S. health care system, relative to that of its peer countries, has been well-documented (Osborn et al., 2017). Increasingly, attention has turned to the role of social determinants of health as one potential explanatory factor. While there are many demonstrated barriers to health care access including socioeconomic constraints and health literacy limitations, a lack of viable transportation inhibits a patient’s ability to travel to health-promoting institutions like doctors’ offices and pharmacies. Transportation barriers interrupt adherence with medical appointments and can prevent people from seeking care at all. This is challenging for chronic illness management as non-attendance can lead to exacerbation of chronic disease and disease-related outcomes (Karter et al., 2004; Murdock et al., 2002).
An oft-cited study from 2005 estimates that approximately 3.6 million people in the U.S. miss or delay non-emergency medical treatment every year despite having health care coverage because of lack of transportation to care facilities (Wallace et al., 2005). Fifteen years later, this figure likely underestimates the magnitude of the problem given the suburbanization of poverty, the aging baby boomer population, and the general increase in population. Across the U.S., low-density development patterns and lack of public transit coupled with high rates of chronic conditions reinforce this issue.
9
2017. Second, we assessed the prevalence of this barrier across demographic groups in 2017. Third, we examined correlates—both health conditions and sociodemographic characteristics— of transportation barriers among the U.S. population.
Background
Transportation Barriers to Care
In a review of 61 studies on transportation barriers to health care, Syed at al. (2013) found that transportation barriers are a significant impediment to health care access, especially for those with lower incomes or those who are underinsured or uninsured (Syed et al., 2013). This population of people, frequently referred to as “transportation-disadvantaged,” often shift their care-seeking to more costly, acute-care settings (e.g., the emergency department [ED]) based on preference or convenience (Coster et al., 2017; Hwang et al., 2015; Kangovi et al., 2013; Nguyen & Dejesus, 2010).
Transportation barriers disproportionately affect specific patient groups. Wallace et al. (2005) found that individuals carrying the highest burden of disease faced the greatest
transportation barriers and were more likely to be older, poorer, less educated, female, people of color, and people with chronic illnesses or disabilities. Probst et al. (2007) found that African Americans have higher burdens of travel to health care than Whites after controlling for mode and socioeconomic status. A 2017 survey of health centers found that older patients, patients who are homeless, people with young children, chronically ill patients, public housing residents, people with disabilities, and pregnant women were all reported to be disproportionately
Administration (Washington et al., 2011; Zullig et al., 2012). Another study that used NHIS data from 1997 to 2006 found that American Indian veterans were more likely to delay care due to transportation issues than were White veterans (Johnson et al., 2010).
Research suggests that having access to a vehicle is positively associated with the ability to reach health facilities, even after controlling for socioeconomic status (Guidry et al., 1997; Silver et al., 2012; Yang et al., 2006). Vehicle access may be especially important in rural areas, where missed or delayed non-emergency medical treatment is often due to lack of access to a vehicle (Arcury et al., 2005). Some studies have found that patients who live in nonurban areas face greater transportation barriers to health care access than their urban counterparts (Henning-Smith et al., 2017; Probst et al., 2007; Skinner & Slifkin, 2007). Compared with people living in urban areas, rural residents reported longer travel time to see a physician, particularly a specialist (Reschovsky & Staiti, 2005).
Even in urban areas where health care facilities may be closer, low-income
11
Medicaid’s non-emergency medical transportation (NEMT), which is a Medicaid benefit that facilitates access to medical services for beneficiaries.
Taken together, there are many possible transportation barriers presenting to both rural and urban residents alike, with potentially larger barriers for those of disadvantaged health, social, and economic status that can exacerbate existing health inequities. While current health care transportation services exist, various eligibility requirements (such as individual ADA Paratransit eligibility determination processes set by transit agencies) may prevent these services from being available to some individuals.
Impacts of Missed Care
Patients who miss health care appointments experience adverse health outcomes. These include complications of chronic illness, increased hospital readmissions, and disrupted
continuity of care (Hernandez et al., 2010; Karter et al., 2004; Murray & Berwick, 2003; Salameh et al., 2012; Schectman et al., 2008). Appointment nonattendance undermines opportunities for diagnostic testing and early detection of disease (Siminoff et al., 2008; Weingarten et al., 1997). Transportation barriers affect access to pharmacies and, thus,
medication (re)fills and adherence (Kripalani et al., 2008; Levine et al., 2007; Welty et al., 2010). Missed appointments also have a negative impact clinical productivity. Unused clinical space, equipment, and staff time equate to loss of revenue (Kheirkhah et al., 2016). Missed or cancelled appointments also prevent or delay other patients from being able to schedule
Since the 2005 study cited above, there has been little research to quantify a nationally representative estimate of the population that forgoes medical care because of transportation barriers. It is especially challenging to understand why people miss appointments. This is largely attributable to the fact that health-related data lack sufficient detail on transportation, and
transportation data lack sufficient detail on health conditions.
Methods
We used data from the National Health Interview Survey (NHIS) to investigate the prevalence of transportation barriers to care in the U.S.The NHIS is an annual, cross-sectional survey that monitors a broad range of health topics collected through personal household interviews. The NHIS provides nationally representative estimates of various health status and health care utilization measures among the civilian, non-institutionalized population since 1957. The National Center for Health Statistics (of the Centers for Disease Control and Prevention) designs the NHIS, and the U.S. Census Bureau is the data collection agent. Because NHIS data are obtained through a complex sample design that involves stratification, clustering, and oversampling of populations of interest, we used appropriate sampling weights in Stata (StataCorp LP, College Station, TX) version 13.1 for all analyses.
We leveraged a particular question asked of the sample adult and child cores: "There are many reasons people delay getting medical care. Have you delayed getting care for any of the following reasons in the past 12 months? . . . you didn’t have transportation?” We examined responses to this question in three ways. First, we looked longitudinally from 1997 to 2017 at the weighted proportion of people who delayed medical care due to lack of transportation over time. From each wave of data, we excluded only those respondents who were not asked about
13
or who did not provide a valid answer to this question (n= 6,674) leaving a total pooled unweighted sample of 892,235 children and adults across 21 years. We assessed changes in trends over time using joinpoint regression analysis software, version 4.7.0.0 (U.S. National Cancer Institute, Bethesda, MD). Using the grid search model fitting method with
heteroskedastic errors and a minimum of zero and maximum of three joinpoints, the permutation test showed that a model with two joinpoints was optimal.
Next, we took an in-depth look at patterns of transportation barriers to care for adults in the year 2017. We evaluated transport-delayed care across various sociodemographic subgroups and for people with various health conditions through bivariate analysis. We conducted omnibus tests of group differences to examine differential rates of this barrier across groups and we report F-statistics as they correct for complex sampling design. Finally, we examined what factors might make someone more likely to report a transportation barrier to care. For the same 2017 sample, we specified a binary logistic regression model to look at correlates of this outcome adjusting for age, gender, race, ethnicity, educational attainment, poverty status, insurance status, employment status, and geographic region. It is important to note that respondents answer “yes” to the question of interest if and only if they both needed medical care and did not have
transportation to that care. Therefore, respondents who did not seek care in the last 12 months would not report a barrier, which could lead to conservative estimates of this particular barrier to care and contribute to disparities across some demographic characteristics (e.g., if older people seek care more often, they may be more likely to report a barrier to this care).
excluded respondents from analysis if they were aged younger than 18 years (n=18,054) or if they were missing the outcome of interest (either because they were not asked the question or they did not provide a valid answer; n=33,552); sociodemographic characteristics (n=1,404); or key health characteristics (n=175). The final unweighted sample size was 24,947. The majority of the sample was female (54.6%) and non-Hispanic White (70.7%). Nearly 34% of the sample had a Bachelor’s degree or higher while 14% lived below the poverty threshold. A quarter of the sample reported being in ‘excellent’ health; a third reported being in ‘very good’ health; and just over a quarter reported being in ‘good’ health. Over one third of the sample had ever had
hypertension and 42% reported a functional limitation because of a health problem.
Results
Transport Barriers to Care Over Time
15
Figure 1. Transportation barriers to health care in the United States, 1997-2017 (all ages)
Note: Annual proportions and frequencies use weighted data. The average annual unweighted sample is 42,487 and the average annual weighted sample is 292,576,684.
`97 `98 `99 `00 `01 `02 `03 `04 `05 `06 `07 `08 `09 `10 `11 `12 `13 `14 `15 `16 `17
proportion 1.8% 1.4% 1.2% 1.3% 1.4% 1.3% 1.2% 1.6% 1.6% 1.6% 1.6% 1.9% 2.1% 2.2% 2.1% 1.9% 1.7% 1.7% 1.8% 1.8% 1.8%
millions 4.8 3.7 3.3 3.6 4.0 3.7 3.3 4.5 4.7 4.6 4.7 5.7 6.3 6.5 6.5 5.7 5.2 5.2 5.7 5.6 5.8
Prevalence of Transport Barriers to Care Across Groups
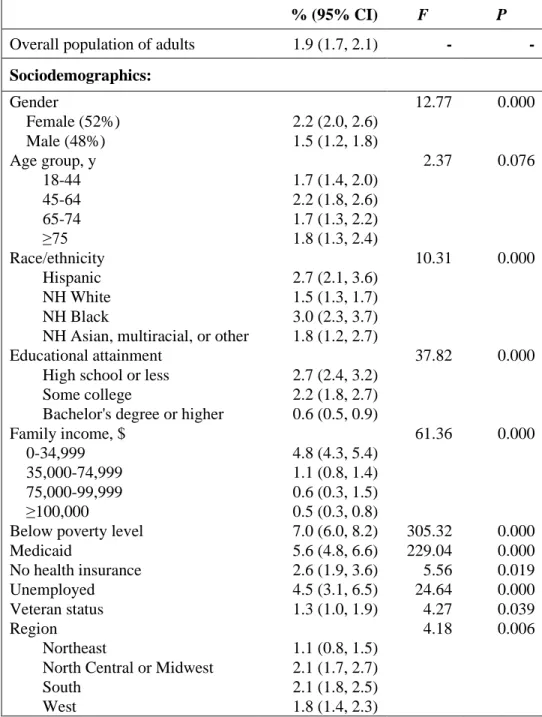
In 2017, 1.9% (95% CI: 1.7, 2.1) of U.S. adults aged 18 years and older delayed medical care because of a transportation barrier. The prevalence of this barrier to care, along with
differences between groups, is shown in Table 1. Overall, 2.2% of women and 1.5% of men reported delaying care because of transportation and this difference was statistically significant (P=0.00). There is variation across age groups; however, the difference between groups is not significant (F=2.37, P=0.08).Rates of transport-delayed care varied significantly across race and ethnicity groups (F=10.31, P=0.00) with non-Hispanic Black respondents reporting the highest rates. Transport barriers to care varied significantly by educational attainment of respondents, with nearly 3% of those with a high school diploma or less reporting a transport barrier and only 0.6% of those with a bachelor’s degree or higher reporting the same barrier.
Poorer people were more likely to report transport-delayed care, with 7% of those living below the federal poverty threshold and 5.6% of those receiving Medicaid doing so in 2017. Delays also varied by employment status (F=24.64, P=0.00), with 4.5% of unemployed people reporting transport-delayed care. There was also significant variation in this barrier across Census regions (F=4.18, P=0.01), with people in the Midwest and South reporting barriers more often than those in the Northeast and West.
Rates of transport-delayed care varied with self-reported health status (F=107.12, P=0.00). Among those in ‘poor’ health, 11.6% reported delaying care due to lack of
17
past year reported lower rates of transport barriers compared with the national level (1.3% compared with 1.9%, respectively) while those who made four or more ED visits reported transport barriers at a rate of 11.9%.
Table 1. Prevalence and Group Differences of Transport Barriers to Care Among U.S. Adults in 2017
% (95% CI) F P
Overall population of adults 1.9 (1.7, 2.1) - -
Sociodemographics:
Gender 12.77 0.000
Female (52%) 2.2 (2.0, 2.6)
Male (48%) 1.5 (1.2, 1.8)
Age group, y 2.37 0.076
18-44 1.7 (1.4, 2.0)
45-64 2.2 (1.8, 2.6)
65-74 1.7 (1.3, 2.2)
≥75 1.8 (1.3, 2.4)
Race/ethnicity 10.31 0.000
Hispanic 2.7 (2.1, 3.6)
NH White 1.5 (1.3, 1.7)
NH Black 3.0 (2.3, 3.7)
NH Asian, multiracial, or other 1.8 (1.2, 2.7)
Educational attainment 37.82 0.000
High school or less 2.7 (2.4, 3.2)
Some college 2.2 (1.8, 2.7)
Bachelor's degree or higher 0.6 (0.5, 0.9)
Family income, $ 61.36 0.000
0-34,999 4.8 (4.3, 5.4)
35,000-74,999 1.1 (0.8, 1.4)
75,000-99,999 0.6 (0.3, 1.5)
≥100,000 0.5 (0.3, 0.8)
Below poverty level 7.0 (6.0, 8.2) 305.32 0.000
Medicaid 5.6 (4.8, 6.6) 229.04 0.000
No health insurance 2.6 (1.9, 3.6) 5.56 0.019
Unemployed 4.5 (3.1, 6.5) 24.64 0.000
Veteran status 1.3 (1.0, 1.9) 4.27 0.039
Region 4.18 0.006
Northeast 1.1 (0.8, 1.5)
North Central or Midwest 2.1 (1.7, 2.7)
South 2.1 (1.8, 2.5)
West 1.8 (1.4, 2.3)
(continued)
Health Characteristics:
Self-reported health status 107.12 0.000
Excellent 0.8 (0.5, 1.1)
Very good 0.9 (0.6, 1.2)
Good 1.8 (1.5, 2.2)
Fair 5.8 (4.8, 7.0)
Poor 11.6 (9.1, 14.6)
Currently pregnant 0.6 (0.1, 2.5) 2.75 0.098
Diabetes or prediabetes 3.8 (3.1, 4.6) 48.91 0.000
Asthma 3.5 (2.8, 4.2) 42.93 0.000
Ever told have cancer 1.9 (1.4, 2.5) 0.01 0.925
Heart condition or disease 3.7 (2.8, 4.8) 24.62 0.000
Hypertension 3.0 (2.6, 3.5) 56.71 0.000
Weak or failing kidneys 7.1 (4.9, 10.3) 54.89 0.000
Ever had stroke 6.9 (5.0, 9.5) 74.54 0.000
Functional limitation 3.7 (3.2, 4.2) 141.31 0.000
# of ER/ED visits in last 12 mos. 147.34 0.000
0 1.3 (1.1, 1.5)
1-3 3.6 (3.0, 4.4)
≥4 11.9 (9.3, 15.2)
Note: NH = non-Hispanic; ER/ED = Emergency Room/Emergency Dept. Proportions reflect weighted prevalence estimates. The unweighted sample size for 2017 was 24,947.
Correlates of Transport Barriers to Care
Results of the logistic regression are displayed in Table 2. Adjusted odds ratios (AORs) with their 95% confidence intervals (CIs), are presented along with the average marginal effect of each variable.
19
Hispanic people had 1.5 times the odds of having a transportation barrier to care compared with non-Hispanic Whites after controlling for other sociodemographic and health characteristics (P=0.02). Those who lived below the poverty threshold were more likely to report a transport barrier than those above the threshold (AOR=1.7, P=0.00) and Medicaid beneficiaries were more likely to report the barrier than their peers who did not receive Medicaid (AOR=1.6, P=0.00). People who were unemployed were more likely to report the barrier than people with similar characteristics who may be employed or who were not in the labor force, though the strength of the association was not significant (AOR=1.5, P=0.07). Compared with people living in the Northeast, people in the Midwest and South regions of the U.S. had 1.9 and 1.6 times the odds, respectively, of delaying care because of this barrier (P=0.00 and P=0.01, respectively).
Self-reporting ‘poor’ health, on average, was associated with a 2.3-percentage-point increase in the predicted probability of transport-delayed care compared with self-reporting ‘excellent’ health (P=0.00). After accounting for sociodemographic and other health
Table 2. Correlates of Transport Barriers to Care Among U.S. Adults in 2017
Covariate AOR (95% CI)
Average Differential Effecta
Sociodemographics:
Female 1.2 (0.9, 1.6) 0.003
Age group, y
18-44 (Ref) 1 -
45-64 0.82 (0.59, 1.1) -0.004
65-74 0.62 (0.42, 0.92) -0.008
≥75 0.48 (0.31, 0.73) -0.011
Race/ethnicity
NH White (Ref) 1 -
Hispanic 1.5 (1.1, 2.2) 0.008
NH Black 1.1 (0.80, 1.5) 0.001
NH Asian, other, or multiracial 1.2 (0.79, 2.0) 0.004
Educational attainment
High school or less (Ref) 1 -
Some college 1.3 (0.98, 1.7) 0.004
Bachelor's degree or higher 0.75 (0.50, 1.1) -0.004
Family income, $
0-34,999 (Ref) 1 -
35,000-74,999 0.47 (0.33, 0.68) -0.013
75,000-99,999 0.34 (0.15, 0.79) -0.016
≥100,000 0.38 (0.23, 0.63) -0.015
Below poverty level 1.7 (1.3, 2.2) 0.009
Medicaid 1.6 (1.2, 2.2) 0.009
No health insurance 1.2 (0.84, 1.8) 0.004
Unemployed 1.5 (0.97, 2.4) 0.009
Veteran status 0.82 (0.55, 1.2) -0.003
Region
Northeast (Ref) 1 -
North Central or Midwest 1.9 (1.3, 2.9) 0.010
South 1.6 (1.1, 2.3) 0.007
West 1.5 (0.97, 2.3) 0.006
21 (continued)
Covariate AOR (95% CI)
Average Differential Effecta
Health Characteristics:
Self-reported health status
Poor 2.9 (1.5, 5.4) 0.023
Fair 2.3 (1.4, 3.8) 0.016
Good 1.2 (0.71, 1.9) 0.002
Very good 0.93 (0.56, 1.6) -0.001
Excellent (Ref) 1 -
Currently pregnant 0.21 (0.05, 0.92) -0.014
Diabetes or prediabetes 1.0 (0.78, 1.3) 0.000
Asthma 1.2 (0.91, 1.5) 0.003
Ever told have cancer 0.77 (0.56, 1.1) -0.004
Heart condition or disease 1.1 (0.75, 1.7) 0.002
Hypertension 1.2 (0.92, 1.6) 0.003
Weak or failing kidneys 1.3 (0.87, 2.0) 0.005
Ever had stroke 1.5 (1.0, 2.2) 0.008
Functional limitation 2.6 (1.7, 3.8) 0.015
# of ER/ED visits in last 12 mos.
0 (Ref) 1 -
1-3 1.5 (1.1, 1.9) 0.007
≥4 2.4 (1.6, 3.6) 0.019
Note: AOR = Adjusted Odds Ratio; CI = Confidence Interval; NH = Non-Hispanic; ER/ED = Emergency Room/Emergency Dept.
Analysis accounts for features of complex sampling strategy including stratification, clustering, and weights. The unweighted sample size for 2017 was 24,947.
a The Average Marginal Effect (or 'Differential Effect' for categorical variables) is the average change in the predicted probability of having a transport barrier by a unit increase in the variable of interest (or by a relative change from the reference category for categorical variables).
Discussion
We estimate that 5.8 million people in the U.S. delayed medical care because of a lack of available transportation in 2017. Our estimate provides an update to the limited amount of published literature estimating the population affected by this barrier to care on a nationally representative scale.
transport barrier to care. Similarly, we found that racial and ethnic minorities reported higher rates of this barrier compared to non-Hispanic Whites; however, the association remained significant only for Hispanics after controlling for other sociodemographic and health
characteristics. The same is true for educational attainment and gender, for which we found no significant association with transport barriers after controlling for these other factors.
Unlike previous research (Health Outreach Partners, 2017; Wallace et al., 2005), we found a negative association between age and rates of transport-delayed care, such that older people were less likely to report a transport barrier to care in our study year. Though the
magnitude of the negative association was rather small, we posit that this may be attributable to other explanatory variables in our model.
Importantly, we found a strong association between functional limitation status and transport-delayed care above and beyond any sociodemographic or other health characteristics (AOR=2.6, P=0.00). Almost half of our sample (42%) reported a functional limitation— indicating that they have difficulty doing specific activities because of a health problem,
including things like going out shopping, walking a quarter mile (or three city blocks), or lifting something that weighs ten pounds. This measure is not wholly representative of a physical disability, but it likely reflects important nuance in the way that we account for mobility independence and (in)ability to travel outside of the home. Interestingly, despite Medicaid’s mandatory non-emergency medical transportation (NEMT) benefit, we found that Medicaid beneficiaries were more likely to report a transportation barrier to care in 2017 compared with those who do not receive Medicaid.
transport-23
delayed care while a stark 12% of those with four or more visits per year reported the same. While there is no way to tease out the temporal sequence in which these events occur for each respondent—that is, whether transportation barriers lead to increases in ED use or high-frequency users are more likely to report barriers—the association is noteworthy as insurance companies are perpetually interested in abating the high costs of high-utilizing, frequent visitors to the ED.
Limitations
It is likely that our estimate of the number of Americans who delay medical care because of lack of transportation is a conservative one. Any sampling biases arising from the NHIS carry over to our estimate; for example, there is often nonresponse of those who are poor, homeless, and in very poor health, and the NHIS excludes Native Americans living on reservations who are part of the Indian Health Service (Wallace et al., 2005). Our estimate is potentially further
downwardly biased because the outcome of interest is only partially observable, such that even though all respondents in the sample were asked this question, we did not observe affirmative outcomes (i.e., presence of transportation barriers) for people who did not seek care in the past 12 months. This is a limitation of how the construct is measured in this dataset—by answering “yes” or “no” to just one question about transportation barriers to care rather than assessing whether people needed care but could not access it.
Conclusion
Lack of transportation delays medical care for millions of Americans every year, with this number nearing six million in 2017. There is a separate and robust literature that describes how increased patient access to routine and preventative care leads to improved overall health outcomes as well as avoidance of costly ambulance bills and ED visits. For many people, driving oneself, getting a ride from friends or family, or taking public transportation are viable modal options to travel to medical appointments. For individuals with mobility- or financial-related barriers, such as lack of a personal vehicle, there are various specialized transportation options for these trips, such as paratransit options that include demand-responsive buses, van services, hospital and care provider-based shuttles, and vehicles for hire including livery vehicles and taxis.
These trips can be covered by non-emergency medical transportation (NEMT)—the mandatory benefit of Medicaid and supplementary benefit of some Medicare Advantage plans. The Veterans Administration offers mileage reimbursement and transportation services for disabled veterans that meet qualifying criteria and some accountable care organizations, who receive bonuses for meeting quality and cost targets while incurring penalties for falling short of targets, provide beneficiaries with transportation—recognizing it as a social determinant of health. Even with these various current offerings, however, our finding that nearly 2% of the population reports transport-delayed care is evidence that current transportation options do not work for a large number of people.
25
CHAPTER 3: COMMUNITY TRANSPORTATION AND ACCESS TO HEALTH CARE IN RURAL NORTH CAROLINA
Abstract
Purpose: Transportation has a profound impact on a person’s ability to access health care, posing unique challenges for rural populations. In nonurban areas of North Carolina, Community Transportation Programs provide critical access to medical facilities. The objective of this
research is to ascertain the existing scope and nature of transportation to and from medical care provided by community transportation in rural Anson County, NC.
Methods: I analyze the scope of health-related trips provided by community
transportation in Anson County, NC in 2019 including differences across trip characteristics, funding sources, and types of health care destinations served.
Findings: Over 80% of all trips provided by community transportation in Anson County in 2019 were health-related trips (i.e., having a medical or nutritional purpose). 54% of medical trips were funded by Medicaid while 35% were funded through the state’s Rural Operating Assistance Program (ROAP) grant. Half of all medical trips were for dialysis treatment, and these trips were shorter and less costly than other medical trips. Anson County’s community transportation provider transported clients to 18 other counties for medical care in 2019.
27
showcases how the health needs of a community ultimately influence the behavior of a rural transit agency.
Introduction
The availability and accessibility of public transportation affects access to employment opportunities, nutritious foods, medical facilities, and other important drivers of health. Viable transportation has a profound impact on a person’s ability to receive medical care, which is why it is considered one of many social determinants of health. Patients who miss health care
appointments experience adverse health outcomes and missed or canceled appointments translate to clinical productivity losses for health care providers (Syed et al., 2013). 5.8 million Americans delayed medical care in 2017 because they did not have transportation and this barrier to care disproportionately impacts individuals who are poor and who have chronic conditions (Wolfe et al. forthcoming).
Americans living in rural areas experience significant health disparities, including higher incidence of chronic disease, increased mortality rates, and lower life expectancies (Rural Health Information Hub, 2019). Risk factors for these disparities include lower socioeconomic status, increased rates of health risk behaviors, and limited access to (sub)specialist health care
providers. Geographic differences in cardiovascular disease mortality led researchers to describe the “mortality penalty” of rural settings in the U.S. (Cosby et al., 2019). Chronic disease
coupled with low-density development patterns and lack of public transit reinforce the issue of access to health care.
Transportation to health facilities has significant implications for acute medical care, such as dialysis treatment. Transportation issues have been cited as a factor in missed and shortened dialysis treatments, which can lead to negative health outcomes including increased
hospitalizations (Ellis et al., 2019). For transit agencies, dialysis transportation has become a critical concern as increasing numbers of individuals with end stage renal disease (ESRD) rely on their community’s public transit service for frequent dialysis trips—often three times per week. This issue is especially critical in rural areas where dialysis centers are located at greater distances from where ESRD patients live.
Background
Transport to Health Care in North Carolina
In North Carolina, there are seven types of public transit systems that serve all 100
counties, ranging from community transportation systems to regional urban systems. Community transportation was designed to allow any human service agency that required transportation for its clients to have an affordable, safe, and cost-effective method of travel; it is characterized by a single-county system that provides transportation to eligible human service agency clients and elderly clients in addition to the general public. Demand response transit, also known as dial-a-ride, is a way for transit agencies of all sizes to provide critical transportation for people with disabilities, and those who are elderly, low-income, or living in a rural area.
29
individually, coordination of NEMT with public transit and other human services transportation is different for each state. North Carolina follows a fee-for-service model in which the state Department of Health and Human Services delegates management of NEMT to the 100 county departments of social services (DSS) who then enter into contracts with local entities that provide the transportation services or manage the NEMT benefit. While in many cases,
community transportation programs (or their equivalents) in other states do not provide NEMT, virtually all North Carolina community transportation providers have provided NEMT in their history (North Carolina Public Transportation Association, 2015).
Under Medicaid managed care, newly-formed health plans in North Carolina will be required to provide the same NEMT services as before, but health plans may use transportation brokers to arrange and provide transportation or contract directly with transportation providers (NC Medicaid Division of Health Benefits, 2019). Potential transportation providers include new health care mobility services, such as those using ridehailing technology as a way to streamline rides to and from medical facilities. It is unclear what these health policy changes will mean for rural areas in North Carolina.
Anson County, NC
Anson County was chosen for this study for several reasons. The Anson County Transportation System (ACTS) collects robust data allowing for detailed analysis and they are the only transportation provider in the county which allows for a complete picture of transit provision. Anson County also has significant health disparities: it ranks close to the bottom of all North Carolina counties (90th/100) based on the County Health Rankings, which assesses quality of life, health behaviors, clinical care, socioeconomic, and environmental factors (Robert Wood Johnson Foundation, 2019). 22% of Anson residents are smokers, 36% have adult obesity, and 28% are physically inactive. Compared to a statewide prevalence of 9.6%, the prevalence of adults with diabetes in Anson County is 14.1% (Robert Wood Johnson Foundation, 2019). Anson County ranks among the worst outcomes nationally (in the top tenth percentile) for both premature deaths and low birth weight (12% of all births). In 2018, there were 4.7
physicians/10,000 population compared to 25.9/10,000 nationally (AccessNC, 2019; World Health Organization, 2019).
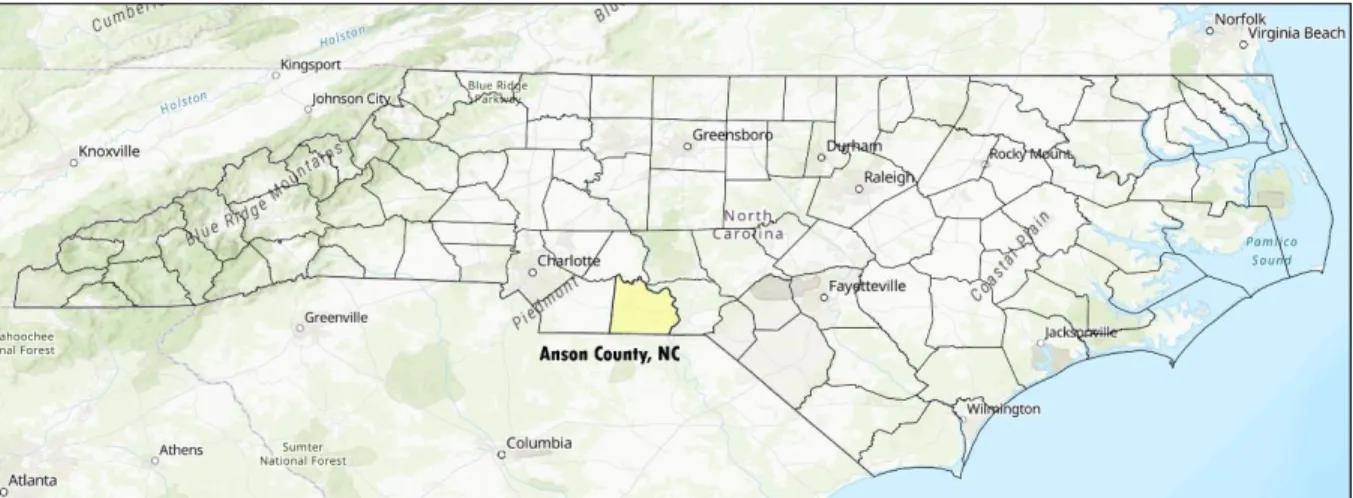
Anson County is located southeast of Charlotte, NC on the border of South Carolina (Figure 2). With a population of 25,306, the county was 49% Black, 45% White, 4% Hispanic, and 1% Asian in 2018 (US Census Bureau, 2018). Households in Anson County have a median household income of $39,126 compared to $52,413 for all of North Carolina in 2018 (US Census Bureau, 2018). While 23% of the population in Anson County lived below the federal poverty threshold in 2017 (compared to 13% nationally), the rate for Black residents was nearly 60% (Deloitte et al., 2020). 85% of Anson County residents have health insurance, with the majority on employee plans, 22% on Medicaid, and 14% on Medicare (US Census Bureau, 2018).3 The
31
largest share of households in Anson County have two cars, followed by three cars. Anson County does not have fixed-route public transportation.
Figure 2. Anson County, North Carolina
ACTS is the community transportation system that provides demand response service in Anson County, maintaining a fleet of vehicles offering two types of transportation: regulary scheduled routes and demand response. Regularly scheduled routes transport clients to the same destination on a consistent basis, such as nutrition sites, dialysis treatment, and employment centers; however, this is not considered fixed route transit. Demand response transportation is accessible by calling at least 24 hours in advance to scheduld a trip; however, it does operate on a first come first served basis. All riders of ACTS must allow for a 30-minute variation in their pick-up time.
Data and Methods
Education (ITRE) at NC State University. These data include information about trip purpose; funding source; cost billed; subscription status; client use of mobility aids; scheduled pick-up and off times; manually-recorded odometer readings and timestamps at pick-up and drop-off; origin and destination name; and XY coordinates (WGS 1984) for pick-up and drop-off. XY coordinates contain six decimal places for non-home locations and were truncated to two
decimal places for home locations to preserve anonymity. Researchers at ITRE used Bing Maps to generate network distance in miles for each trip.As timestamps at pick-up and drop-off were manually recorded by drivers, some errors are expected when transcribing the handwritten data. I examined travel time and average travel speeds in order to systematically detect any outlier trips in the data and clean any potential errors in data recording.
First, I provide an overview of all health-related trips provided by community
transportation in Anson County by tabulating trips for medical and nutritional purposes relative to all trips provided by ACTS in 2019. Next, I examine funding sources for these health-related trips to determine the scope and cost of Medicaid NEMT utilization in the county relative to other sources of state and federal funding.
33 Results
ACTS provided 28,602 trips in 2019 (Table 3). Of all trips provided, 82% were health-related— categorized as having a medical (66%) or nutritional (16%) trip purpose. Over half of medical trips (55%) were regularly-scheduled, subscription-based trips which includes trips to dialysis. All nutritional trips are subscription-based trips where riders are driven to congregate meal sites, often a church or senior center, to socialize and share a nutritious meal.
Table 3. Community Transportation Trips by Trip Purpose in Anson County, NC (2019)
Trip Purpose:
Medical 66%
Nutritional 16%
Other trip purpose 18% All Completed Trips (n=28,602) 100%
were excluded from analysis if the origin was identical to the destination (n=22). The total sample size was 23,443 health-related trips.
35
Table 4. Funding for Health-Related Community Transportation in Anson County, NC (2019)
Funding Source (n=16)
Medical Trips (n=18,841) Nutritional Trips (n=4,602)
Anson County Dept. of Social Services (Medicaid NEMT) 54% 0%
Elderly and Disabled Transportation Assistance Program (EDTAP) 24% 2%
Rural General Public (RGP) funds 11% 0%
Union County Transportation (coordinated services) 5% 0%
5310 Elderly Individuals & Individuals with Disabilities Program 4% 0%
Meadowview Terrace (assisted living facility) 1% 0%
Wadesboro Council on Aging <1% 51%
Morven Council on Aging 0% 47%
Anson Health & Rehab (nursing facility) <1% 0%
Atrium Health Anson (hospital) <1% 0%
Disability Determination Services <1% 0%
Employment Transportation Assistance Program (EMP) <1% 0%
MassMutual Trust Co. (financial planner) <1% 0%
Mecklenburg County Health Dept. (coordinated services) <1% 0%
Office of Disability <1% 0%
Wadesboro Health & Rehab Center (nursing facility) <1% 0%
100% 100%
Together, three sources funded almost 90% of all medical trips carried by ACTS in 2019: 54% were funded by Medicaid as NEMT trips, 24% were funded by EDTAP, and 11% were funded by RGP (Table 5). Across all trip characteristics, RGP-funded trips were the longest distances and travel times; had the greatest billed costs; and yielded the highest operating costs compared to Medicaid- and EDTAP-funded trips. While the median Medicaid trip was 9.4 miles and lasted 29 minutes, the median RGP-funded trip was 26 miles and lasted just over an hour. The most costly trip billed was $259.94 to transport a client for care at Duke Neurology paid for by Medicaid.
Table 5. Trip Characteristics by Purpose and Funding Source
By Trip Purpose By Funding Source
All Medical Trips (n=18,841) Dialysis Trips (n=9,326) Other Medical Trips (9,515) Medicaid NEMT (n=10,123) EDTAP (n=4,485) RGP (n=2,045)
Share of all medical trips: 100% 49.5% 50.5% 53.7% 23.8% 10.9%
Network Distance (mi)
mean 15.8 6.8 24.7 15.0 10.0 28.2
median 9.9 5.0 25.6 9.4 6.6 25.8
min 0.1 0.1 0.1 0.1 0.1 0.1
max 202 53.0 202 155 73.0 202
Travel Time (00h:00m)
mean 0:49 0:26 1:12 0:49 0:34 1:15
median 0:30 0:20 1:04 0:29 0:24 1:04
min 0:01 0:02 0:01 0:01 :02 :03
max 7:27 5:16 7:27 7:27 5:10 6:52
Amount Billed ($)a
mean $22.39 $13.15 $31.44 $25.21 $14.34 $26.17
median $16.06 $13.92 $21.60 $15.76 $14.11 $22.14
min $0.08 $0.17 $0.08 $0.17 $0.47 $0.08
max $259.94 $90.50 $259.94 $259.94 $29.99 $144.30
Operating Cost ($)
mean $41.31 $17.70 $64.46 $39.24 $26.02 $73.67
median $25.84 $13.05 $66.82 $24.53 $17.23 $67.34
min $0.26 $0.26 $0.26 $0.26 $0.26 $0.26
max $527.22 $138.33 $527.22 $404.55 $190.53 $527.22
37
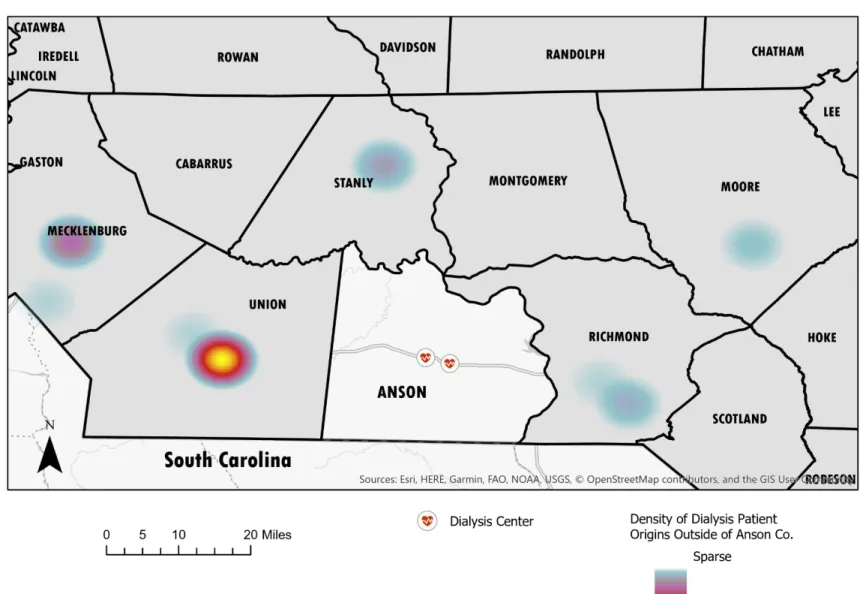
There are two dialysis centers located in Anson County. ACTS provided 9,326 total trips to and from dialysis centers in 2019, representing 49% of all trips with a medical purpose. The median dialysis trip distance was 5 miles, and the greatest distance was 53 miles. The vast majority of trips to dialysis originated within the county (Figure 3), yet ACTS did pick up dialysis patients from origins elsewhere; in fact, the longest dialysis trips were those that connected ESRD patients with another medical facility outside of the county, such as a surgical specialist, wound care center, or endocrinology specialist (many of which can be seen in Figure 4). Mobility aids were commonly utilized by ESRD clients: 36% of clients traveling to or from dialysis appointments used a wheel chair, 8% used a walker, and 3% used a cane.
38
39
40
41
Discussion
Community transportation provides critical access to health care for residents of Anson County, NC. Medicaid NEMT provided over 10,000 trips—just over half of all medical trips—to and from appointments for Medicaid beneficiaries who did not otherwise have viable
transportation in 2019. The magnitude of NEMT provision in a rural North Carolina county is informative in a time of uncertainty regarding the future of Medicaid management within the state. Because newly-formed health plans under Medicaid managed care will be required to provide the same NEMT services as before, it is helpful to understand the full picture of publicly-provided transportation to medical care for people living in nonurban areas.
While Medicaid funded a significant proportion of all medical trips, nearly half were funded by a separate program. Namely, the Elderly and Disabled Transportation Assistance Program (EDTAP) and Rural General Public (RGP) funds played a critical role in funding medical transportation in Anson County in 2019. Both EDTAP and RGP funds are made
available through the Rural Operating Assistance Program (ROAP), which is a state- and federal-funded public transportation program administered annually and allocated to counties by the NC Department of Transportation’s Public Transportation Division based on formulas. County governments or regional transportation authorities are the only eligible applicants for ROAP funds.
43
the rider’s origin or destination must be in a nonurbanized area (according to the Census), which is likely why RGP-funded trips were the longest and, as a result, had the highest operating costs in this study.
Conclusion
This study showcases how the health needs of a community ultimately influence the behavior of a rural transit agency. Community transportation in Anson County connects residents with medical care in 18 other counties, demonstrating that their demand for health care exceeds the supply of providers and services within the county. As the health of residents changes over time, the picture of transit provision—along with the resources required to sustain it—will also change.
45
CHAPTER 4: INNOVATIVE HEALTH CARE MOBILITY SERVICES IN THE U.S.4
Abstract
Background: Transportation barriers prevent millions of people from accessing health care each year. Health policy innovations such as shared savings payment models (commonly used in accountable care organizations) present financial incentives for providers to offer patient transportation to medical care. Meanwhile, ridesourcing companies like Uber and Lyft have entered the market to capture a significant share of spending on non-emergency health care transportation. Our research examines the current landscape of innovative health care mobility services.
Methods: We conducted an environmental scan to identify case examples of utilization of ridesourcing technology to facilitate non-emergency health care transportation and developed a typology of innovative health care mobility services. The scan used a keyword-based search of news publications with inductive analysis. For each instance identified, we abstracted key information including: stakeholders, launch date, transportation provider, location/service area, payment/booking method, target population, level of service, and any documented outcomes.
Results: We discovered 53 cases of innovation and among them we identified three core types of innovation or collaboration. The first and most common type of innovation is when a health care provider leverages ridesourcing technology to book patient trips. This involves both
established and nascent transportation companies tailoring the ridesourcing experience to the health care industry by adding HIPAA-compliance to the booking process. The second type of innovation involves an insurer or health plan formally partnering with a ridesourcing company to expand transportation offerings to beneficiaries or offer these services for the first time. The third type of innovation is when a paratransit provider partners with a ridesourcing company; these cases cite increased flexibility and reliability of ridesourcing services compared to traditional paratransit.
Conclusions: Ridesourcing options are becoming a part of the mode choice set for patients through formal partnerships between ridesourcing companies, health care providers, insurers, and transit agencies. The on-demand nature of rides, booking flexibility, and integration of ride requests and payment options via electronic medical records appear to be the strongest drivers of this innovation.
Background
Access to Health Care
47
A systematic review concluded that transportation barriers are a significant impediment to health care access, especially for people with lower incomes or those who are underinsured or uninsured. Such barriers often include lack of access to a vehicle (Arcury et al., 2005).
Neighborhoods with access to public transportation commonly rely on aging transportation infrastructure, unreliable service, or fixed routes that do not align with the location of health care facilities. In many cases, riding the bus or the subway can be physically challenging for people who are disabled, obese, or chronically ill.
The United States has seen a proliferation and normalization of shared mobility technology in recent years; it is estimated that 36% of Americans used some form of
ridesourcing service in 2018 (Jiang, 2019). There is federal recognition of the swiftly evolving landscape of shared mobility as transit agencies grapple with opportunities presented by these technological advancements. The U.S. Department of Transportation has sponsored research and pilot projects aimed at exploring partnerships between transit and shared mobility providers (Federal Transit Administration, 2019a, 2019b). Ridesourcing companies like Uber and Lyft have entered the market to capture a significant share of current spending on non-emergency health care transportation (Surampudi, 2019) and health care providers are leveraging shared mobility services to establish new ways for patients to access on-demand rides to and from medical appointments.
Traditional Provision of Health Care Transportation
For many people, driving oneself, getting a ride from a friend or family member, taking public transportation, or ordering a taxi are viable modal options to travel to health care facilities and medical appointments. For individuals with mobility- or financial-related barriers, such as lack of a personal vehicle, there are various specialized transportation options for such trips. We describe several of these alternatives here.
Paratransit, in the broadest sense, refers to flexibly scheduled and flexibly routed
passenger transportation that supplements fixed-route systems run by public transit agencies. The 1990 Americans with Disabilities Act (ADA) requires that transit operators provide accessible paratransit service (often called ‘ADA complementary’). While paratransit services are
commonly perceived as a dedicated service for elderly riders and riders with disabilities, a range of paratransit services exists serving all rider types. Paratransit serves a number of trip purposes, with health care-related trips among them. In many cases, the service is funded by 5310 and 5311 formula grants, which are transportation funding opportunities passed from federal to state to local governments with the aim of reducing operational and capitals costs of transit providers. Paratransit can be provided by both public transportation agencies and other (private or not-for-profit) entities. Paratransit modes can include demand-responsive buses, van services, hospital and care provider-based shuttles, and vehicles for hire including livery vehicles and taxis.
49
least costly form of transportation. Through this required benefit, states purchase hundreds of millions of rides from taxis, livery vehicles, vans, ambulettes, and public transit every year. Although comprehensive data about Medicaid NEMT expenditures do not exist because states are not required to separately report on this item, the Transit Cooperative Research Program estimates NEMT spending at $3 billion annually, which is less than one percent of total Medicaid expenditures (Garrity & McGehee, 2014).
The majority of states have evolved to deliver NEMT through NEMT brokers or managed care organizations (MCOs). In most of these states, the broker or MCO receives a per capita payment to manage the NEMT benefit.5 A few states directly fund government entities such as Departments of Transportation to provide NEMT while others deliver NEMT on a fee-for-service basis through local service providers. Some jurisdictions provide gas cards or bus passes to beneficiaries. Administration of NEMT services is a significant logistical undertaking for state Medicaid programs.
Beyond Medicaid, health care transportation is becoming more prevalent in other federal programs and health insurance markets. Traditional Medicare covers NEMT via ambulance only;6 however, NEMT has become a popular supplemental benefit in the Medicare Advantage program. In 2016, NEMT was available to roughly 25% of Medicare Advantage’s 19 million enrollees (Pope, 2016). In May 2018, CMS issued a final rule on a new policy as part of a broad 2019 Medicare payment rule that gives Medicare Advantage plans greater flexibility in choosing supplemental benefits offered to chronically ill enrollees; non-medical benefits can include
5Capitation is a payment arrangement for health care service providers; Medicaid pays the broker or MCO a set amount for each enrolled beneficiary assigned to them, per period of time, whether or not that person seeks care.
ridesourcing services. In 2019, about 22 million Americans are enrolled in Medicare Advantage plans, which is slightly greater than one third of all Medicare beneficiaries (Jacobson et al., 2019).
The U.S. Department of Veterans Affairs (VA) offers mileage reimbursement and transportation services for travel to medical and rehabilitation appointments for disabled veterans that meet at least one of their qualifying criteria. The VA’s Veterans Transportation Program offers travel solutions to and from VA health care facilities at little or no cost to eligible veterans.
In March 2010, the Patient Protection and Affordable Care Act brought about
comprehensive health care reform including provisions and programs to test and expand new models of delivering and paying for care, such as the creation of accountable care organizations (ACOs). Under the ACO concept, health care providers are organized into teams that together are responsible for the health of a given patient population and the cost of providing its care. ACOs receive bonuses for meeting quality and cost targets while in some cases, incurring penalties for falling short of targets. Some ACOs provide beneficiaries with transportation, recognizing that it is one of many strategies to address social needs that have an impact on health, commonly referred to as social determinants of health.
51
cancer. In some cases, hospitals and other care facilities have ad-hoc, charity-based funds to facilitate transportation.
Dynamic Policy Context
Important policy shifts have occurred which directly (and indirectly) shape the context in which people seek out transportation to health care. Several health care delivery system reforms of the Affordable Care Act were mentioned above; here we will briefly discuss amendments to the Anti-Kickback statute as well as Medicaid waivers.
Effective January 2017, the Department of Health and Human Services and the Office of Inspector General issued a federal Safe Harbor ruling, changing the system of the provision of medical transportation (Statute and Civil Monetary Penalty Rules Regarding Beneficiary
Inducements, 2016). Prior to this, the Anti-Kickback Statute, originally enacted by the Office of Inspector General in 1972, stated that no health care provider or institution receiving federal dollars could offer anything of financial value that may increase referrals for their publicly- or privately-insured patients; these “inducements” yielded criminal penalties and substantial fines. This criminal statute was intended to protect patients and federal health care programs from fraud and abuse. The 2017 ruling amended this statute by adding new safe harbors that protect certain payment practices and business arrangements from sanctions, making it permissible for eligible medical providers—including hospitals, clinics, physician’s offices, dialysis clinics, medical laboratories, and physical therapists—to offer or facilitate transportation for established patients.