RNA Structures and their Molecular Evolution in HIV;
Evolution of Robustness in RNA Structures and Theoretical
Systems
by
Kristen Kamerath Dang
A Dissertation submitted to the faculty of the The University of North Carolina at Chapel Hill in partial fulfillment of the requirements for the degree of Doctor of Philosophy in the Department of Biomedical Engineering (Bioinformatics and Computational Biology).
Chapel Hill 2008
Approved by:
Carol N. Lucas, Chair
Christina L. Burch, Advisor
Ronald I. Swanstrom, Advisor
Shawn Gomez, Reader
Copyright c2008 Kristen Kamerath Dang
Abstract
Kristen Kamerath Dang
RNA Structures and their Molecular Evolution in HIV; Evolution of Robustness in RNA Structures and Theoretical Systems.
(Under the direction of Christina L. Burch and Ronald I. Swanstrom.)
The known functions of RNA structures have expanded of late, such that RNA is
consid-ered a more active player in molecular biology. The presence of RNA secondary structure in a
sequence should constrain evolution of its constituent nucleotides because of the requirement
to maintain the base-pairing regions in the structure. In a previous work, we found support for
this hypothesis in nine molecules from various organisms, the exception being a structure found
in a protein-coding region of the HIV-1 genome. In this work, I examine the interaction of
con-straints imposed by RNA structures and host-induced hypermutation on molecular evolution
in HIV-1. I conclude that RNA structures in HIV do evolve via compensatory evolution, but
that hypermutation can obscure the expected signal. Since RNA’s known roles have increased,
so have the methods for identification and prediction of RNA structures in genetic sequence.
I use a method adapted for searching in multiple coding regions to identify conserved RNA
structures throughout the HIV-1 and HIV-2 genomes. I find evidence for several new, small
structures in HIV-1, but evidence is less strong for HIV-2. Finally, I consider the evolution of
robustness, the property of phenotypic constancy, using RNA structures and two other
theoret-ical model systems. I find that pervasive environmental variation can select for environmental
and genetic robustness in all three systems, and conclude that it may be a generic mechanism
for the evolution of robustness.
Table of Contents
List of Figures vii
List of Tables viii
List of Abbreviations and Symbols ix
1 Introduction 1
1.1 Functions of RNA . . . 1
1.2 Method development in identifying conserved RNA secondary structure . . . 1
1.3 Selection for RNA structures creates heterogeneous rates of evolution across sites 2 1.4 Overlapping coding regions and multiple constraints . . . 4
1.5 Prediction of RNA secondary structure in coding regions . . . 4
1.6 Evidence suggests RNA structures are robust . . . 5
1.7 How did robustness evolve? . . . 6
2 Compensatory evolution, hypermutation, and RNA secondary structure in HIV 8 2.1 Abstract . . . 8
2.2 Introduction . . . 9
2.3 Methods . . . 12
2.3.1 Alignments and phylogenies . . . 12
2.3.2 Transition-transversion rate ratio in specific structures . . . 12
2.4 Results . . . 13
2.4.1 κfor individual structures in hypermutated and normal alignments . . . . 13
2.4.2 κacross the whole genome . . . 15
2.5 Discussion . . . 16
2.6 Acknowledgments . . . 19
3 Conserved RNA structures in HIV-1 and HIV-2 20 3.1 Abstract . . . 20
3.2 Introduction . . . 21
3.3 Materials and Methods . . . 23
3.3.1 Grammar predictions of structure . . . 23
3.3.2 Phylogenies and evolutionary rate estimation . . . 25
3.3.3 Comparing grammar and chemical-thermodynamic predictions . . . 26
3.4 Results . . . 27
3.4.1 Conserved structures in the HIV-1 M Group predicted by RNA-Decoder . 27 3.4.2 Structure conservation across phylogenetic distance . . . 28
3.4.3 Comparison with chemical mapping techniques . . . 29
3.4.4 Structure predictions for HIV-2 using RNA-Decoder . . . 31
3.5 Discussion . . . 33
3.6 Acknowledgments . . . 36
4 Antagonistic pleiotropy plays a role in the congruent evolution of genetic robustness 40 40 4.2 Introduction . . . 41
4.3 Experimental Design . . . 43
4.3.1 Regulatory network model . . . 44
4.3.2 Digital organisms . . . 45
4.3.3 RNA secondary structure . . . 45
4.4 Results . . . 46
4.4.1 Correlation between environmental and genetic robustness in selection-naive systems . . . 46
4.4.2 Evolution experiments . . . 48
4.4.3 Proximate mechanisms . . . 49
4.5 Discussion . . . 49
4.6 Methods . . . 54
4.6.1 Regulatory networks model . . . 54
4.6.2 Digital organisms . . . 55
4.6.3 RNA . . . 56
4.7 Acknowledgments . . . 58
List of Figures
1 The HIV-1 genome. . . 62
2 Phylogenetic trees inferred from alignments. . . 63
3 Transition-transversion rate ratios in stem and loop sites for selected structures. 64 4 Relationship of genome position to transition-transversion rate ratios. . . 65
5 Sliding-window analysis of transition-transversion rate ratio. . . 67
6 Lentivirus phylogeny. . . 68
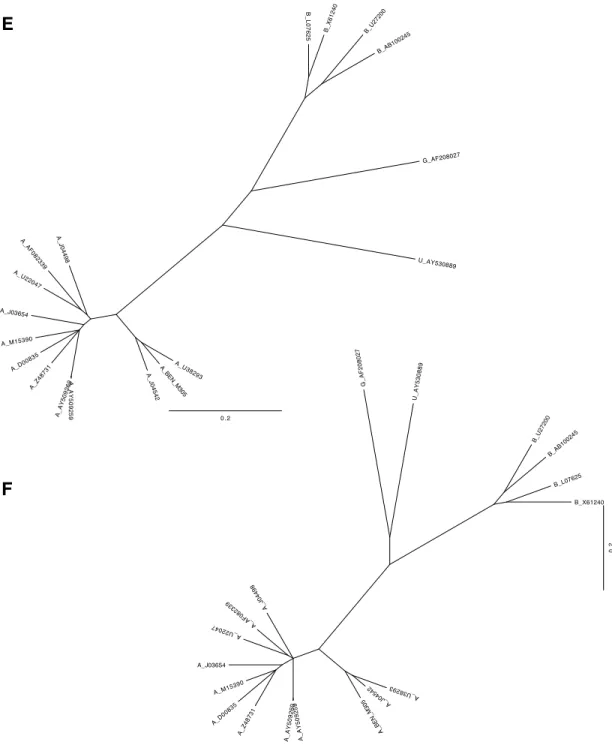
7 Phylogenetic trees inferred from HIV-1 and HIV-2 genome alignments. . . 70
8 Performance of the Matthews correlation coefficient over various pairing proba-bility cutoffs. . . 71
9 Conserved structure predictions for HIV-1 group M genomes. . . 73
10 Selected structures predicted by RNA-Decoder. . . 74
11 HIV-1 M and SIVcpz comparison plot. . . 76
12 Agreement of chemical-thermodynamic method and RNA-Decoder across the HIV-1 genome. . . 78
13 Similarities and differences in predicted structures for HIV-1 and HIV-2. . . 80
14 Regions of predicted structure in HIV-1 and HIV-2. . . 81
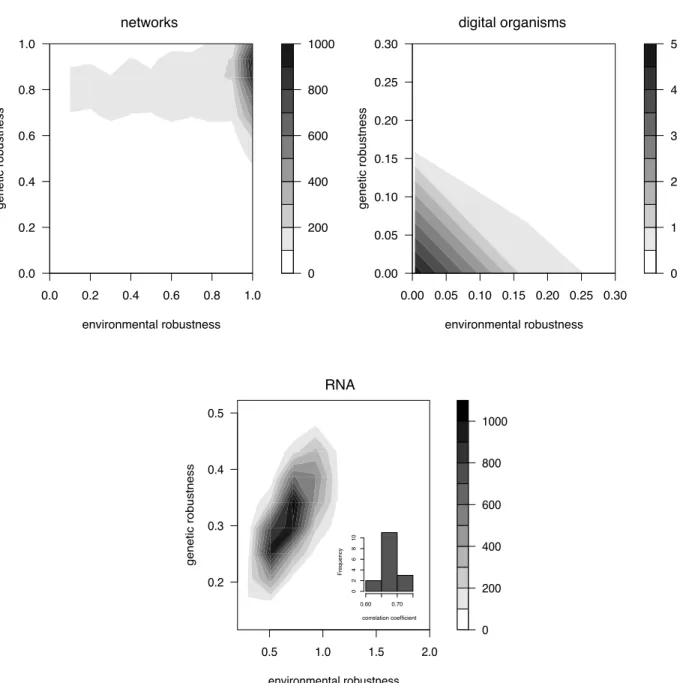
15 Environmental and genetic robustness are correlated in all three models. . . 82
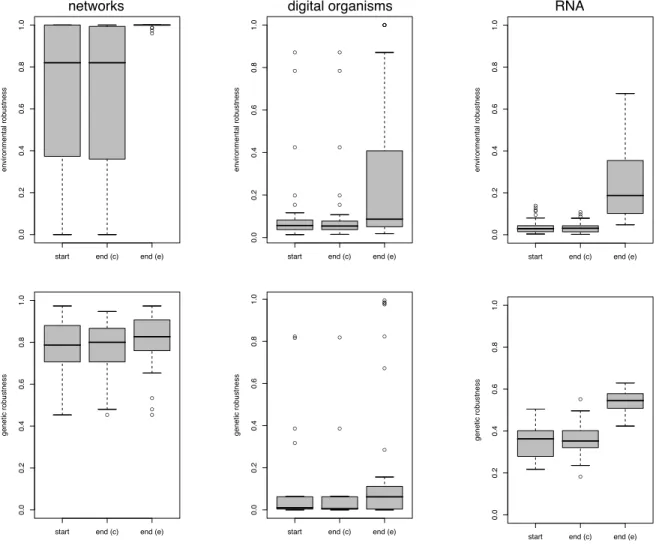
16 Genetic robustness (relative fitness following a mutation) increases under selec-tion for environmental robustness. . . 83
17 Proximate mechanisms for increasing genetic robustness as a correlated response in the digital organisms model. . . 84
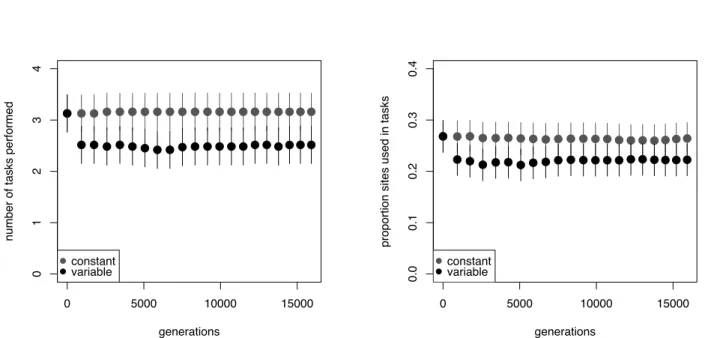
18 Pairwise genetic diversity in digital organism populations is reduced in variable environments. . . 85
List of Tables
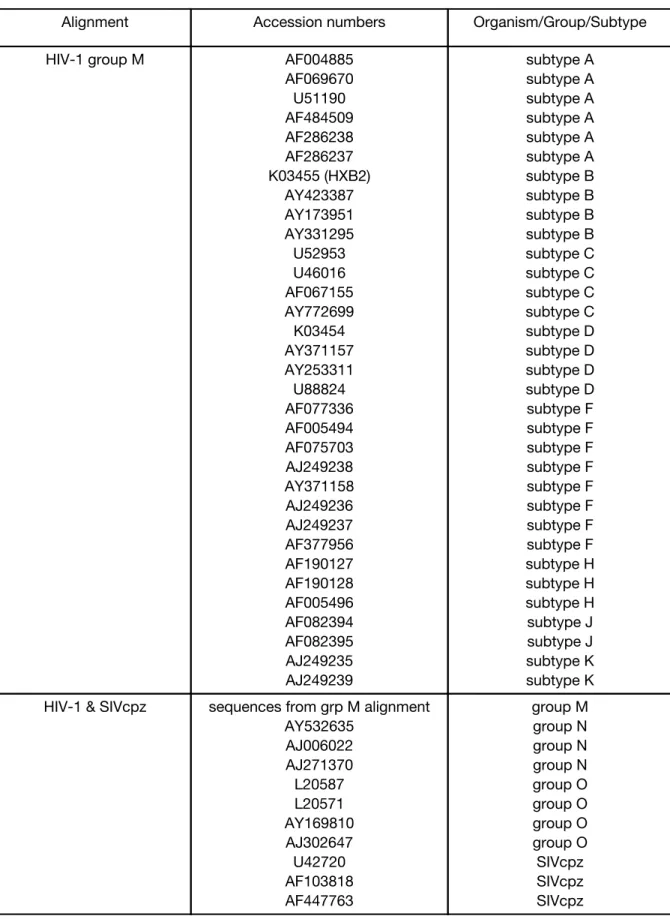
3.1 Sequences used. . . 37
3.2 Evolutionary information in sequence alignments. . . 39
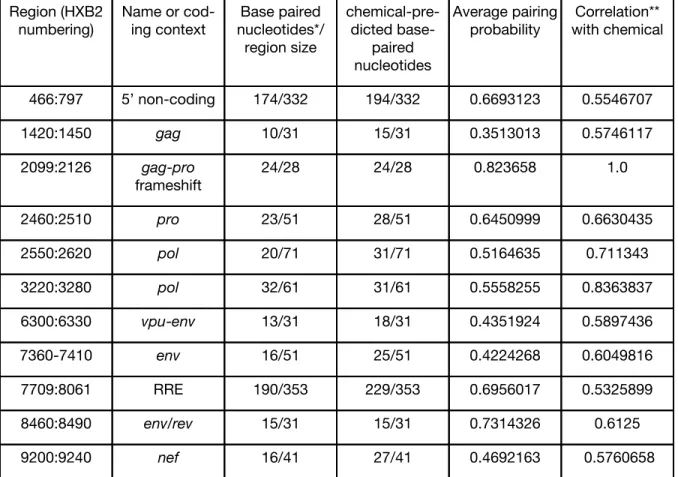
3.3 Regions of agreeing structure predictions in HIV-1, using both RNA-Decoder
List of Abbreviations and Symbols
APOBEC Apolipoprotein B mRNA editing catalytic polypeptide
cPPT/PPT central polypurine tract / polypurine tract
HIV Human Immunodeficiency Virus
κ kappa, the transition-transversion rate ratio: µT i/µT v
RNA Ribonucleic Acid
RRE Rev Response Element
SIV Simian Immunodeficiency Virus
TAR Tat Response Region
Chapter 1
Introduction
1.1
Functions of RNA
RNA is classically known for its roles in transporting and translating protein-coding gene
se-quences. It fulfills these functions as messenger, transfer, and ribosomal RNA molecules.
Begin-ning with the discovery of the catalytic properties of ribozymes (e.g.[118]), it was apparent that
RNA had a more varied role in molecular biology. For example, recent work has illuminated
RNA’s roles in gene regulation as microRNAs[37] and riboswitches[10]. In viruses, RNA
struc-tures have many roles, including as packaging signals that ensure viral genomes are packaged
into viral capsids. They also recruit host cell ribosomes to viral transcripts to allow translation
of viral proteins. Thus, rather than a passive role as a medium for transporting and translating
protein coding genetic sequence, RNA is recognized as an active player in molecular biology.
1.2
Method development in identifying conserved RNA
sec-ondary structure
Due no doubt to the expanding role of RNA in molecular biology, activity has been high in
the development of bioinformatics methods to predict RNA secondary and tertiary structure
(see [15] for a review of relevant reviews). Zuker’s mfold algorithm[120] is the classic one for
predicting the lowest free-energy structure for a given sequence. This is helpful if one already
prediction for the structure. It also assumes that the minimum free-energy structure is in
fact the functional structure. In many cases, rather than asking what is the structure for a
given sequence, one wishes to know whether there is evidence of any conserved structure in
a given sequence(s) or even in a whole genome. Though some attempt has been made to
answer the latter question by looking for structures with significantly lower-than-average free
energies, it has been shown that the folding energies of functional RNA structures are generally
not significantly different from background levels, and cannot be used to distinguish regions of
functional structure from non-conserved structure[90]. This kind of structure identification and
prediction requires a different approach, as described by Meyer[72].
Another type of RNA structure prediction takes into account the information in a multiple
sequence alignment about mutation patterns consistent with conservation of RNA structure.
These methods, known as covariation methods, identify likely stem regions by finding columns
in an alignment containing positions that can form base pairs and that co-vary, such that
single-position mutants are never (or rarely) observed. RNAalifold is a program that combines
ther-modynamic predication with covariation information[111]. In a review by Gardner[32] of several
types of prediction programs, including single-sequence prediction methods such as mfold, other
covariation methods, and methods that both align sequences and predict structures,
RNAal-ifold was one of the most successful. However, these covariation methods do not incorporate
evolutionary models that account for substitution rate and distance between sequences in an
alignment, therefore they can misestimate the significance of co-varying mutations. In addition,
these methods require that enough sequence diversity be present in the alignment that several
co-variations can be observed per stem.
1.3
Selection for RNA structures creates heterogeneous rates
of evolution across sites
A different method, one that surpassed RNAalifold’s performance for some datasets in Gardner’s
study, is Pfold[53], a program that, like RNAalifold, uses information from a sequence alignment
to predict structure. Instead of looking for co-variation in an alignment, Pfold uses differences
in rates between positions to make its predictions. Thus in theory it can make predictions
in alignments where few or no co-variations are observed as long as there is enough diversity
for rate differences between positions to be reliably assessed[76]. Pfold is one of several RNA
prediction methods (e.g. [81]) to take advantage of the observation of a difference in rate (or,
in the same vein, variability[103]) between nucleotides in base-paired regions of RNA structures
and those that are single-stranded, whether in a loop or a non-structured region. The presence of
RNA secondary structure in a sequence should constrain evolution of its constituent nucleotides
because of the requirement to maintain the base-pairing regions in the structure. If structures
are functionally important, single mutations that destabilize the structure by eliminating a
base-pair bond in a stem region will not often become fixed in a population except with the
simultaneous fixation of a compensating mutation on the opposite side of the stem that restores
the bond. Thus, stem positions must simultaneously fix two mutations, a slower process than
fixation of a single mutation. Innan and Stephan use data from an earlier study of secondary
structure in a non-coding region of the Drosophila genome[81] to estimate of the rate of evolution
in RNA base-pairing regions, which they find to be roughly two times lower than the background
rate[44].
In a prior work, I collaborated with Jen Knies, Todd Vision, Noah Hoffman, Ron Swanstrom
and Christina Burch to test the idea that evolution in RNA structures occurs by fixation of
double mutants, a process known as compensatory evolution[48, 14]. We predicted that due
to compensatory evolution we should observe an elevated ratio of transition to transversion
mutation rates in stem-forming regions of structures. In a stem region base-pair, a transition
mutation can be compensated only by another transition, whereas transversions require
com-pensation by transversions. Since transitions occur more frequently than transversions[110],
compensation of transversion mutations is expected to be a rare event compared to transitions.
Thus, the ratio of the two types of mutations will be exaggerated in stem regions. Specifically,
the ratio in stems will be the square of the ratio in loops. We tested this prediction in ten
structures, including mitochondrial tRNAs, rRNAs and viral structures such as the HIV Rev
response element, the hepatitis C virus cis-acting replication element, and the pestivirus
in-ternal ribosome entry site. Our prediction for an elevated transition-transversion rate ratio in
stems was supported for nine of ten structures[51]. We concluded that compensatory evolution
evolution, consistent with the idea that maintenance of RNA structures constrains evolution
at participating sites. In chapter 2, I follow up on this project by examining the interaction of
compensatory evolution and host-induced hypermutation in the HIV-1 genome, the one
exam-ple from the prior study that did not agree with our predicted result for structures experiencing
compensatory evolution.
1.4
Overlapping coding regions and multiple constraints
Many viruses, including HIV, have very small genomes, possibly limited by their error-prone
polymerase[41]. Some theorize that this limitation on length has led to the development of
a more compact genome, by overlapping coding for proteins, RNAs, and other elements[42].
Overlapping may confer another advantage: if the messages overlap such that particular sites
are of high importance in both, this reduces the number of sensitive targets that can be
af-fected by mutation, particularly when mutation rate is high[87]. In a computational simulation
study, Hogeweg and Hesper showed that multiple coding preferentially evolved in situations
with medium-to-high mutation rates, and particularly those with recombination[40], situations
applicable to RNA viruses. A recent survey of RNA viruses found that amount of gene overlap is
significantly inversely correlated with genome size[5]. Regardless of the origin, the fact remains
that coding overlap does occur, in viruses, bacteria[46] and eukaryotes[64], creating multiple
constraints on the evolution of a single position. Huynen simulated evolution of RNA structures
and found that dual protein-RNA coding still allows for evolution of differing structures, but
reduces the ability to fine-tune structural evolution[42].
1.5
Prediction of RNA secondary structure in coding regions
Modeling techniques for molecular evolution have been developed to address among-site rate
heterogeneity[116]. Typically, when examining nucleotide sequences, such variability is modeled
using a gamma distribution. Newer methods implicitly acknowledge the presence of multiple
coding by modeling variation in synonymous rates of coding sequences[54], suggesting that
other forces may be constraining these sites that were previously thought to evolve neutrally.
And at least one RNA prediction method has been developed for finding structures in multiple
coding regions[83]. This method uses several evolutionary models to account for the different
combinations of constraints placed on protein and RNA dual-coding sequences[82]. In chapter 3,
I use this method to search for new RNA structures in the (mostly protein-coding) genomes of
HIV-1 and HIV-2.
1.6
Evidence suggests RNA structures are robust
In Huynen’s simulation study of RNA structure evolution, structures evolved with selection for
a specific secondary structure were more similar to their neighbor structures, (structures that
differ from the evolved structure by point mutations), than were random structures. This means
that the structures evolved to a region in sequence space where mutations have less of an effect on
structure, allowing it to maintain a more-or-less constant phenotype. This property, phenotypic
constancy in the face of mutational perturbation, is commonly referred to as robustness. In
biological terms, we can think of robustness as an organism’s ability to maintain a constant
level of performance despite genetic or environmental perturbations. For example, many genetic
sequences produce proteins that assume similar tertiary structures with equal functionality
despite their mutational differences. Robustness can be achieved through several mechanisms
(reviewed in [49] and [107]), including redundancy and as an emergent system property. The
advantages of robustness are self-evident: an organism that can withstand perturbations while
maintaining a high fitness is more likely to survive. This advantage can also be a disadvantage. If
an organism is unable to change its phenotype in response to environmental or genetic pressure,
it may be unable to adapt to new conditions. Recently, many studies have claimed to show
evidence of robustness in various biological and theoretical systems (for a review, see [22, 49]),
some suggesting that robustness is an evolved property of these systems. In particular, several
studies suggest that conserved RNA structures are robust compared to non-conserved[108, 9]
1.7
How did robustness evolve?
Given that many biological phenotypes, such as RNA secondary structures, may exhibit evolved
robustness, how did natural selection produce this property? Since organisms are thought to
experience more environmental than genetic perturbations during their lifetimes, it seems likely
that they will evolve to be robust to environmental changes[33]. Indeed, theory[109] supports
the evolution of environmental robustness by selection. The origins of genetic robustness are
less clear. One possibility for the evolution of genetic robustness, considered extensively by G.
Wagner[109], is that it will increase as a direct result of selection for it. This is the ”adaptive”
hypothesis discussed by de Visser et al[22]. As argued by G. Wagner, in order for genetic
ro-bustness to evolve directly, there must be sufficient genetic variation present in the population
that will favor selection for robustness to the potential phenotypic changes caused by the
ge-netic variation. Otherwise, the benefits conferred by gege-netic robustness will be of little selective
value. G. Wagner showed that it requires more genetic variation than is maintained in a
pop-ulation at mutation-selection balance to evolve genetic robustness. Flatt[29] argues that other
sources – environmental heterogeneity, pleiotropy, epistasis, and heterosis – can maintain the
necessary genetic diversity that will increase selection for genetic robustness, but he concludes
that stabilizing selection is too weak for evolution of genetic robustness.
Typically, studies of robustness evolution are conducted using theoretical models.
Lab-oratory experiments of robustness can be difficult due to the need to obtain a good fitness
measure and to implement multiple different perturbations and measure their effects. Many of
the theoretical studies use RNA structures and sequences, since this is one system where the
relationship between genotype, phenotype, and fitness is known (with some caveats) and can
be calculated, assuming that the lowest free energy structure is the most fit one, and that it is
the one assumed by the sequence.
I participated in a prior computational study that demonstrated that sexual recombination
can select for robustness, even if the mutation rate is very low[3]. I wrote computer code to
im-plement a test of the idea that mutations that eventually become fixed in sexually-recombining
populations are less deleterious to the population that exists at the time of their occurrence
than are those that fix in asexual populations. Thus, populations that sexually recombine will
retain those mutations that are least likely to have negative interactions with other genetic
ele-ments, leading to a robust population. Another mechanism has been proposed for the evolution
of genetic robustness which suggests genetic robustness is a correlated response to selection for
environmental robustness[109, 33]. This is de Visser et al’s ”congruent” hypothesis[22], which
requires that environmental and genetic robustness are achieved through the same biological
mechanisms. That is, if an organism is robust to an environmental perturbation such as
tem-perature, the same methods of protecting it from thermal changes will also protect it from
mutations[70, 11]. If the same mechanisms that respond to environmental perturbations also
confer genetic robustness, there is no need to postulate a separate theory of evolution of genetic
robustness. I explore this hypothesis in chapter 4, using data from three different theoretical
Chapter 2
Compensatory evolution, hypermutation,
and RNA secondary structure in HIV
2.1
Abstract
The mammalian protein family APOBEC3 is known to cause elevated rates of
Guanine-to-Adenine mutations in retroviral genomes. This activity is thought to be a defense mechanism
evolved to protect host genomes against pervasive endogenous retroviruses. The extent of its
action against HIV in vivo is a matter of some debate, as is the pattern of hypermutation it
creates in the HIV genome. Here I show indirect evidence in support of the action of APOBEC3
proteins against HIV-1in vivoby examining patterns of evolution in regions of conserved RNA
structure. In a previous work, we demonstrated that the presence of conserved RNA structure
predictably constrains molecular evolution, except in the RRE structure in the HIV-1 genome.
Given known characteristics of APOBEC3 protein activity – that it induces transition mutations
only in single-stranded regions of nucleic acid sequence – I can explain deviation from expected
patterns of molecular evolution for regions of RNA structure such as the RRE. The amount
of deviation for a particular RNA structure indicates the amount of hypermutation present in
that region of the genome. I examined several known and predicted RNA structures in HIV-1
for adherence to the pattern predicted for RNA structures. I also extended my analysis to look
at elevation of transition-transversion rate ratios across the whole genome. The results support
the action of APOBEC3 proteins against HIV-1 sequences, and suggest the presence of two
2.2
Introduction
There are many sources of variation in the rate of evolution across the HIV genome. Some
sources are genome-wide, such as the differing level of conservation among nucleotides in a
codon. Others are restricted to certain regions, such as in the variable regions in theenv gene,
where positive selection leads to high rates of evolution due to their roles interacting with host
defenses. Selection on protein sequence is the most obvious source of variation in molecular
evo-lution, but selection can also act specifically on the nucleotide sequence to conserve regulatory
regions, RNA secondary structures, or other important functional nucleotides. For example,
the polypurine tracts are conserved for their role in genome replication and the gag-pro-pol
frameshift slippery sequence and RNA stem-loop structure are conserved for their role in gene
regulation. Finally, some positions have an elevated rate of evolution because their underlying
mutation rate in increased by APOBEC3G and APOBEC3F, two mammalian proteins that
have been shown to mutate retroviral genomes[34, 20]. This chapter examines the interaction
of two of these constraints: conservation of RNA secondary structure and APOBEC3-induced
hypermutation.
I participated in a previous study[51] where we showed that the presence of conserved RNA
structures predictably constrains molecular evolution in a variety of molecules and organisms
in a specific way, leading to an increase in the transition-transversion mutation rate ratio. This
prediction is derived from an assumption that evolution in RNA structures occurs through a
compensatory process, whereby substitutions in stem regions occur in combinations of two, one
on each side of the stem, in order to maintain the base-pair interaction[14]. The double mutant
is thus selection-neutral, because it does not disrupt formation of the secondary structure.
How-ever, due to the chemical requirements of forming a base pair, both mutations must be either
transitions (purine→purine or pyrimidine→pyrimidine) or transversions (purine→pyrimidine
or pyrimidine→purine). Thus, any inherent difference in the rate of these types of mutations is
exaggerated in RNA structure stem regions, where the mutations must occur in pairs.
Specifi-cally, we predicted that the ratio of the transition and transversion rates in stem regions should
be the square of its value in loop regions, which should be unconstrained by structure. We
struc-ture in HIV-1, the Rev response element. There we found the opposite result: the rate ratio was
higher in loops compared to stems. This means that either transition mutations were elevated
or transversion mutations were suppressed in loops compared to stems.
We speculated that this deviation from the prediction for compensatory evolution could be
caused by APOBEC3 proteins, a mammalian protein family known to defend against
retro-viruses by deaminating cytidine residues in single-stranded minus-strand DNA during viral
replication[34]. These residues are then complemented by adenine when the plus strand is
synthesized, causing a G→A transition mutation in the genome. Since these proteins increase
the number of transition mutations, and only operate on single-stranded (i.e. non-stem) DNA,
their action could explain the increased transition-transversion rate ratio in loops compared
to stems. This explanation assumes that genome regions conserved for RNA structure also
fold in the single-stranded DNA, protecting the stem regions from deamination. Potentially
then, both compensatory evolution of RNA structures and APOBEC3-induced hypermutation
elevate the transition-transversion rate ratio, but the former works on stem positions, while the
latter works on loops. This difference of effect should be most apparent in structures that are
heavily hypermutated. If I know the distribution of hypermutation across the genome, I should
be able to predict to what extent a structure in that region will deviate from the compensatory
evolution model.
While it is known that certain APOBEC3 proteins (APOBEC3G and APOBEC3F) can edit
the HIV genome, the pattern of hypermutation they create in the HIV genome is a matter of
some debate. In a study of editing in wild-type and Vif-deleted infections of HOS.CD4.X4 cells,
Yu and colleagues[117] found the highest amounts of editing in theenvandnefregions of the
Vif-deleted viruses (see Figure 1 for gene locations). The viral protein Vif is known to counteract
the effects of APOBEC3, by prohibiting it from being packaged with the viral genome. In
viruses containing a functional Vif, the editing was highest in the progene and the upstream
two-thirds of the env gene. However, the intervening region was not analyzed. The authors
proposed a single gradient of editing across the genome, with the amount of editing depending
on the length of time the minus-strand DNA spends in a single-stranded state. Based largely on
the results of the Vif-deleted viruses, they proposed that thenefregion immediately upstream
of the polypurine tract (PPT) should experience the most hypermutation. Though their study
did not examine this region, they noted that they also expected a drop in hypermutation
immediately downstream of the central polypurine tract (cPPT).
These studies are complemented by several studies of sequences extracted from infected
patients. Kieffer and colleagues[47] examined patterns of mutation from the proteaseand RT
genes taken from resting CD4+ T cells of HAART patients, finding that each patient contained
a minority of hypermutated genomes. The variability in editing consistent with APOBEC3G
across the sequenced regions was large, with some sites showing G→A mutations in more
than 80% of sequences, while the median fraction of sequences experiencing G→A mutation
was 19%. Suspene et al[101] examined full-length genomes from several studies in two ways:
by comparing the number of edited nucleotides per position in a hypermutated and reference
sequence, and by calculating a product-substrate ratio for APOBEC3G/F target sites across
the genome. For one HIV-1 group O hypermutated sequence, both types of analysis showed a
distinct pattern of two mutation gradients across the genome, with peaks immediately upstream
of both polypurine tracts. For a separate collection of 29 sequences, all obtained via a database
search for hypermutated annotations, mostly consistent but less distinct results were obtained.
In the most heavily mutated sequences, the pro and pol genes generally showed the greatest
amount of editing, while editing was also high but less pronounced in theenvandnefgenes. The
authors conclude theses results are consistent with dual origins of plus-strand DNA synthesis,
one at each polypurine tract. Regions immediately upstream (relative to the plus strand) of
the polypurine tracts are expected to be single-stranded and susceptible to APOBEC3G/F
editing the longest. Generally consistent with these results were findings by Pace et al[78], who
examined editing of sequences of varying length from 127 patients. They calculated several
metrics of editing by comparing mutated positions to the population consensus. Considering
only G→A mutations, regardless of di-nucleotide motif context, they found results consistent
with a two-peak model, though the peak in the env-nef region was lower than for the pro-pol
region. No peaks were observed when the metric was changed to look for AOBEC3G-specific
target motif editing.
All of the above studies support elevated rates of APOBEC3G/F mutations in the pro-pol
region, and three of them support elevated rates in the env-nef region (Keiffer’s study did
a drop in APOBEC3-editing following the central polypurine tract, but the relative height of
the peaks in the pro-pol vs. env-nef region are not clear. There seems to be general support
for a correlation between amount of hypermutation and length of time a position spends as
single-stranded DNA.
Here we measure adherence to the compensatory evolution model for RNA secondary
struc-tures across the HIV-1 genome in order to determine whether instances of high deviation
cor-relate with regions of high hypermutation. We compare the results in unedited and
hypermu-tated genomes for regions of known and predicted structure. We also look at the pattern of
the transition-tranversion rate ratio across the whole genome. We discuss implications for the
presence of conserved structures and for the pattern of APOBEC3 action across the genome.
2.3
Methods
2.3.1 Alignments and phylogenies
An alignment of non-recombinant group M subtype reference sequences[60] was obtained from
the Los Alamos HIV database (http://www.hiv.lanl.gov/content/index). Minor manual
editing was done to improve the alignment and to adjust it to match the numbering of the HXB2
reference sequence. To examine hypermutated sequences, I downloaded from GenBank all the
HIV-1 group M sequences from a previous study[101], excluding circulating recombinant forms.
I aligned them to the HXB2 reference sequence using the FFT-NS-2 method of MAFFT[45]
and manual editing. This resulted in a total of 23 sequences in the hypermutated alignment,
plus HXB2. Phylogenetic trees were inferred for each alignment using Tree-Puzzle[92], with the
GTR+γ(4) model (Figure 2). Accurate parameter estimation was used, with quartet sampling
used for substitution process and the neighbor-joining tree used for rate variation.
2.3.2 Transition-transversion rate ratio in specific structures
The transition-transversion rate ratio, κ, was estimated for specific structures as described
previously[51], with one modification for equilibrium frequencies. Briefly, the HKY85 model
of nucleotide substitution was separately fit to stem and loop sites for each structure using
HyPhy[55]. Given the expected differences in APOBEC3-induced mutation rates at stems and
loops, equilibrium nucleotide frequencies were calculated separately for them. Rate
heterogene-ity was modeled using a discretized gamma distribution and four rate categories. Confidence
intervals are calculated from the Fisher information matrix by HyPhy, assuming asymptotic
normality of the estimator. Stem and loop designations for each position were obtained from
the highest-probability fold of the given region using the phylo-grammar (see chapter 3 for
explanation of phylo-grammar predictions).
2.3.3 Sliding-window analysis of κ
The local transition-transversion rate ratio was estimated across the genome using a sliding
window of 150 nucleotides and an increment of 30 nucleotides. κ was estimated separately for
each window using a common phylogenetic tree and γ-distributed rate variation as described
above. To estimate the rate ratio for non-stem positions only, gaps were created at all positions
with a high probability of being a stem (i.e. pairing probability greater than 0.8 – see chapter 3).
These columns are subsequently treated as missing information in the rest of the analysis. Due
to the heterogeneous distribution of stem sites, the actual number of non-stem sites in each
150-nucleotide window used to estimateκ is variable.
2.4
Results
2.4.1 κ for individual structures in hypermutated and normal alignments
I chose seven regions of predicted structure in which to examine the transition-transversion
rate ratio. They include two known structures: the Rev response element and the 5’
non-coding region. Other structures were predicted as part of a whole-genome analysis of HIV-1
using a phylo-grammar (see chapter 3). I measuredκ, the rate ratio, for each structure in two
alignments: the reference sequences for the HIV-1 group M subtypes and a separate collection
of group M hypermutated sequences that have been analyzed previously[101]. The rate ratios
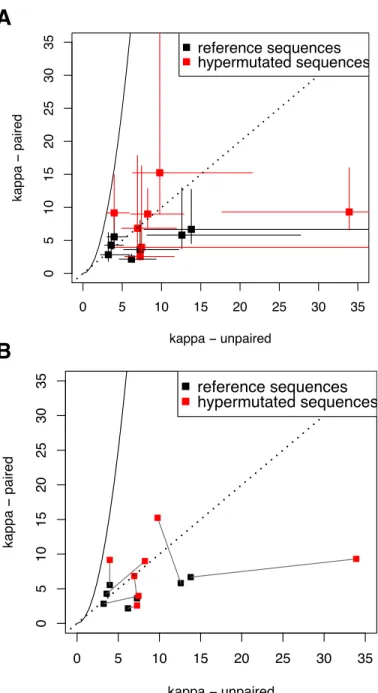
for paired and unpaired sites for all structures are shown in Figure 3. If the structures are
unaffected by APOBEC3-induced hypermutation, I expect they will adhere to the prediction
for compensatory evolution, κstems = κ2loops, which is indicated by the solid line in Figure 3.
the stems, since double-stranded regions such as stems should be protected from APOBEC3
mutation. Thus, structures experiencing more hypermutation should be further to the right in
Figure 3 compared to non-hypermutated structures, but no difference in the vertical direction
is expected due to hypermutation.
No structure from either alignment has confidence intervals that overlap the expected value
for sites undergoing compensatory evolution, shown by the solid line, although one
hypermu-tated structure comes close. All of the structures fall to the right of this line, and several are well
to the right of the dashed line, indicating an elevated κloops compared to κstems. The dashed
line indicatesκstems =κloops, a result expected when constraints on molecular evolution do not
differ between sites identified as stems and loops. This could happen due to misidentification
of some stem sites as loops, or vice versa. It could also result from incorrectly predicting a
structure where none in fact exists. Thus, one or two of the structures that have both points
falling very near this line are possibly not real structures, or some of their positions have been
misidentified. In Figure 3b, the same data is shown, but with lines connecting the two
align-ments for the same structure. For visual clarity, confidence intervals are not shown. From this
figure, it can be seen that four hypermutated structures are further to the right in the graph
compared to the same structures measured in the reference sequences, indicating that they have
higherκloops. These hypermutated structures also have elevated κstems compared to the
refer-ence sequrefer-ences, but the differrefer-ence is not as great as forκloops. The other three structures have
higherκstems in hypermutated as opposed to reference sequences, but little difference is seen in
κloops. Overall, some consistent trends are apparent, particularly that no structure meets the
prediction for compensatory evolution, and several of the hypermutated structures are more
deviant from the compensatory evolution prediction than the reference sequences.
Some prior studies of APOBEC3 action suggest that different regions of the genome
experi-ence different amounts of hypermutation as a result of the amount of time those regions spend
as single-stranded DNA during replication[101, 117]. If this is so, I expect the structures in
regions that are single-stranded the longest during replication will have the highest
transition-transversion rate ratios for their loops compared to the other structures because they should
have the most opportunity for hypermutation. In contrast, the (double-stranded) stem sites
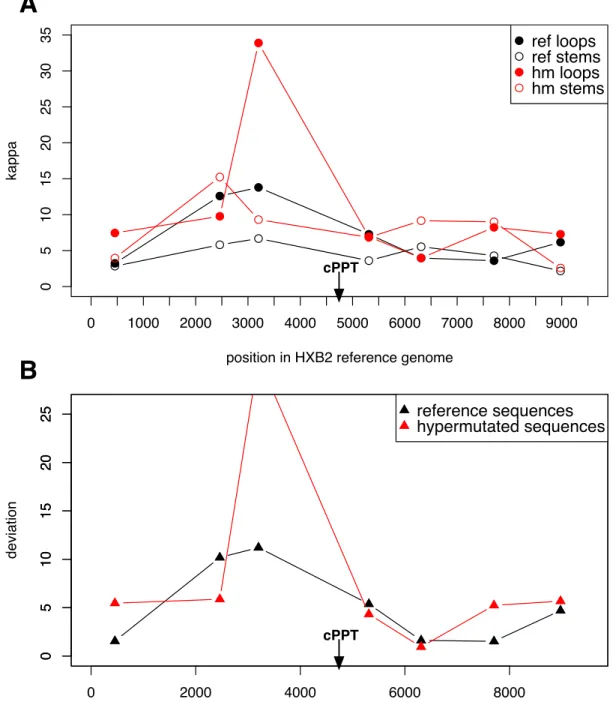
should be relatively unaffected by hypermutation. To examine whether there is a
specific effect on κ in loops, I plotted the κ values for loops and stems versus the position of
their structure in the HIV-1 genome (Figure 4a). Given the results of prior studies, I expect
the highest κloops values to be in the pro-pol region, followed by the env-nef region. Due to
the effect of the central polypurine tract, I expect a dip in κloops immediately downstream of
it. Observed values of κloops in both the reference sequences and the hypermutated sequences
do appear elevated in the pro-pol region compared to the rest of the genome, and to a lesser
extent in the env-nef region. Also, a dip in κloops consistent with the position of the central
polypurine tract is observed. Interestingly, κloops in the last half of the genome is not
partic-ularly elevated compared to the rest of the genome, in contrast to what would be expected if
hypermutation was most dense in this region, as suggested in[117]. Compared to κloops,κstems
is less variable across the genome, particularly in the reference sequences, which is consistent
with the hypothesis that stem regions are protected from APOBEC3 mutations.
A more precise characterization of the relationship between genome location and deviation of
the transition-transversion rate ratios from the prediction for compensatory evolution is plotted
in Figure 4b. The deviation, √κstems−κloops, quantifies how much κloops differs from its
pre-dicted value from the compensatory model described in[51], assuming thatκstems is unaffected
by hypermutation. A high deviation could be indicative of a large amount of
APOBEC3-induced hypermutation, because it signifies an elevated rate of transitions in single-stranded
regions, characteristics consistent with APOBEC3 mutation. The hypermutated sequences
gen-erally show equal or greater deviation than the reference sequences, which is consistent with
their status as hypermutated. Deviation for both is greatest in the pro-pol region. There is
also a peak in deviation at theenv-nefregion, though less so for the reference sequences. This
suggests support for a double gradient of hypermutation peaking at each of the polypurine
tracts.
2.4.2 κ across the whole genome
To observe the effect of hypermutation on all sites, whether in a structure or not, I performed
a sliding-window analysis of κ across the HIV-1 genome for both alignments. κ was estimated
for overlapping 150-nucleotide windows across the genome. The results are shown in Figure 5a.
sites from the alignment by replacing those columns with gaps (Figure 5b). In both analyses,
it is apparent that there are two distinct patterns of κ values, one represented by positions
1200-5000, and the other by positions 450-1200 and 5000-9600. In the former, κ is generally
higher and more variable, with several high peaks. In the latter,κ is lower and nearly flat, with
a few small peaks. In both graphs, κ is elevated for the hypermutated sequences compared
to the reference sequences throughout the genome. This is likely an effect of genome-wide
hypermutation in those sequences. The difference between the κ for the two alignments is
generally greater in the upstream portion of the genome.
The peaks in κmay represent regions of RNA structure in the genome. The RRE is visible
in both graphs as a modest peak between 7700-8000. Compensatory evolution would predict
that this peak is a result of a higher κstems compared to κloops, but previous results and this
study show that in factκloops ≥κstemsin the RRE. Several other peaks inκcorrespond to areas
of known or predicted structure throughout the genome. The peak at ˜ 2000 corresponds to the
location of the known gag-pro-pol frameshift signal. Peaks at (roughly) 1250, 7000, and 8500
match elevated regions of pairing probability (see chapter 3). As with the RRE, compensatory
evolution would suggest that these peaks are visible due to their high κstems. However, the
increase in κ for most of the peaks in 5(b) compared to 5(a) suggests that κloops > κstems
for these structures also. Since the only difference in the data between 5(a) and 5(b) is the
removal of likely stem sites, the increase ofκin 5(b) suggests that the removed sites had lower
κ. This would be the case if hypermutation was prevalent in the loops of these structures.
Assuming, then, that a higher κ indicates a larger amount of hypermutation, it appears that
loops experience more hypermutation than do non-structured regions. This can be seen, for
example, by comparing the elevatedκ for the RRE with baseline κ observed throughout most
of the downstream half of the genome (Figure 5b). This suggests that loops are more accessible
to APOBEC3 proteins than are non-structured regions.
2.5
Discussion
The results of our prior study[51] suggested that the Rev response element RNA structure did
not evolve via compensatory evolution, since we did not observe the expected relationship
tweenκloops and κstems. It now appears that this deviation was caused by APOBEC3-induced
hypermutation, which greatly increased κloops. As the regions of highest deviation also
corre-spond to places where APOBEC3 hypermutation is most prevalent (i.e. the pro-pol region),
it is reasonable to conclude that the deviation is caused by elevated rates of mutations in the
loops of structures, not by lack of adherence to compensatory evolution by the stems.
Com-pensatory evolution likely does occur in these structures, and in places where hypermutation is
low, their deviation from the prediction is small (Figure 4b). Both compensatory evolution of
RNA structures and APOBEC3 hypermutation cause elevated transition-transversion rate
ra-tios, but APOBEC3 has the stronger effect, as seen by the higherκloops compared toκstems for
several of the individual structures (Figure 4a). The genome-wideκanalysis also supports this
conclusion, since the most of the highestκvalues occur after stem sites are removed (Figure 5b).
Several methods have been used to study the pattern of APOBEC3 hypermutation across
the genome. Most involve counting the number of differences from a consensus sequence[78,
47] and/or calculating a ratio of observed target nucleotides or dinucleotides to product
(di)nucleotides[101, 78]. In contrast, the method used here uses sequence relationships
de-scribed by a phylogenetic tree to infer substitution rate parameters describing the evolution of
the sequences. I use the HKY85 model of evolution[35], which allows two categories of rate –
one for transitions and one for transversions – and estimates their relative rate ratio as a single
parameter: κ. This model allows me to observe the effect of APOBEC3 on the parameter,
because APOBEC3 increases transition rates, but not transversions. I could also use a model
that estimates the rate parameters for all types of mutations separately, so that I could look
at the rate of the specific mutation caused by APOBEC3, but estimation of more parameters
also leads to more error in the estimation of each parameter. The HKY85 model is the
sim-plest model that allows me to estimate a separate parameter for transition mutations and to
estimate different equilibrium frequencies for each nucleotide. Compared to the methods that
count differences from a consensus sequence, this method has the distinct advantage that it is
easy to use. All that is required is a good alignment and phylogeny. It also takes advantage of
the information in the phylogeny to estimate rates, rather than counts. However, the method is
not good for precisely identifying hotspots of APOBEC3 mutation on a very small scale, since
My results for deviation from compensatory evolution (Figure 4b) and for κ across the
genome (Figure 5) suggest a pattern for APOBEC3 activity with a broad peak in the pro
-pol region, tapering off near the central polypurine tract. This is consistent with the
above-mentioned studies that show elevation of in this region compared to thegaggene. The
genome-wide analysis does not support a second broad peak in the env-nef region (suggested by [117,
101]). The study by Pace[78] also finds no support for a second peak in theenv-nefregion. My
data do support isolated regions of elevated κ in this region, most corresponding to regions of
structure (Figure 4a and Figure 5). The predominant hypothesis explaining the distribution
of hypermutation across the genome is that the amount of APOBEC3 activity in a given
genome region is proportional to the time the region spends as single-stranded DNA during
replication[101, 117] (but see [23]). For my data to be consistent with this hypothesis, it
must be assumed that the downstream region spends less time than the upstream region as
single-stranded DNA, in contrast to the model proposed by Suspene[101]. One possible cause
is if the upstream region contains more conserved secondary structure that takes longer to
unfold for replication, though this is not likely given that structural predictions do not support
substantially more structure here (see chapter 3). Another possibility is that the strand transfer
of the plus-strand (strong stop) DNA that initiates at the polypurine tract is slow compared
to initiation of replication at the central polypurine tract. This would create a proportional
difference in timing of initiation or strand transfer that could leave the upstream segment
single-stranded longer than the downstream segment.
Several peaks in κ in Figure 5 correspond to regions of known and predicted structure. It
is interesting, then to note that loops appear to be more hypermutated than non-structured
regions. This suggests that loops in conserved structures are more accessible to APOBEC3 than
are non-structured regions, a reasonable possibility if the loops are projected away from the rest
of the genome by stems and are therefore less sterically hindered substrates. Another possibility
is that much of the minus-strand DNA forms transient, non-conserved structures that protect
otherwise non-structured regions from hypermutation, while leaving the loops in conserved
structures open. In our prior work, we suggested that κ could be used as a simple diagnostic
for validating predicted structures, with regions of high κ indicating conserved structures due
to the effect of compensatory evolution in stems. However, due to the complicating signal of
hypermutation, the elevated κ is likely a result of elevated κloops, rather than elevated κstems.
Since κloops appears to be elevated in loops compared to non-structural regions, it may still be
a useful diagnostic for structure in retroviral sequences that are affected by APOBEC3.
2.6
Acknowledgments
Chapter 3
Conserved RNA structures in HIV-1 and
HIV-2
3.1
Abstract
Lentiviral genomes are known to contain several functional RNA structures, including the Rev
Response Element (RRE), the highly-structured 5’ non-coding region which includes the Tat
Responsive Region (TAR), and the stem-loop ribosomal frameshift site within the overlapping
region of thegagandpro-polreading frames. These structures have been characterized in HIV-1
and to some extent in HIV-2 using thermodynamic or covariation predictions, chemical assays,
and imaging methods. No strong evidence has been published supporting other comparable
structures in the remainder of the genome. Here I use a phylogenetic stochastic grammar
method to predict conserved structures throughout the HIV-1 and HIV-2 genomes. My results
replicate the known structures, and suggest a handful of previously unknown ones. These
results are robust to methodological parameter adjustments and some appear to be conserved
between HIV-1 and HIV-2 and their nearest simian relatives (SIVcpz and SIVsm, respectively).
The most significant difference between the HIV-1 and HIV-2 results is at the 5’ end, where
HIV-2 is predicted to contain a structure approximately twice the size of the corresponding
structure in HIV-1. This 5’ HIV-2 structure also overlaps the gag gene by approximately 400
nucleotides, compared to approximately 50 nucleotides of overlap into gag in HIV-1. Other
conserved structures are found throughout the genome, but their functions are unknown. The
that some differences exist between the two human viruses. Also, genetic analysis of these new
structures to determine function can now be undertaken.
3.2
Introduction
In recent years, as the number of known functional RNA structures has expanded, we have begun
to ascribe to RNA a more prominent role in molecular biology. In viruses, RNA structures are
known to function in genome packaging, regulation of transcript splicing, translation, and RNA
transport, among others. Structures can also provide protection from RNase and, in the case
of DNA structures formed by retroviral genomes, from the cytidine deaminase host defense
(APOBEC) proteins. Sequences that produce these structures are not genes in the traditional
sense, but the structures constitute functional phenotypes on which selection can act. In this
sense, the structures and their corresponding sequences describe another genetic code, one that
encodes RNA structures rather than polypeptides.
Most of the well-known RNA structures in viruses, such as the internal ribosome entry sites
and packaging signals, are found in non-protein-coding regions, but some structures that exist
in coding regions are known. Sequences that encode both an RNA structure and a protein
represent an interesting group of sequences that have multiple constraints on their molecular
evolution. Silent nucleotide substitutions that might otherwise be considered selection-neutral
to the relevant coding region can be deleterious if they affect RNA structure folding. Indirect
ev-idence for the presence of structures in coding regions has been inferred by studies demonstrating
reduced rates or numbers of synonymous substitutions, for example in mRNAs in mammals[12]
and in viral genomes[96]. Bioinformatics studies using co-variation and/or thermodynamic
pre-diction have predicted structures in the coding regions of a variety of viruses, including hepatitis
C and G viruses[103, 102], other Flaviviridae[102], and the Picornaviridae[114, 96]. Some of
the predictions for HCV have been supported by enzymatic mapping[104] and by site-directed
mutagenesis followed by studies of viral replication [69]. A separate, but similar study used
site-directed mutagenesis and characterization of viral replication to show support for the role
of a proposed stem-loop structure in regulating translation initiation in dengue virus[16].
(e.g. [4, 80, 7]), but two structures in coding regions are well known. The Rev response
element (RRE), located in the env gene of lentiviral genomes, consists of approximately 350
nucleotides comprising a long stem-loop and several smaller stem-loops that branch off the main
loop. It forms in unspliced and singly-spliced transcripts, is recognized and bound by the viral
protein Rev, and the protein-RNA complex is then exported from the nucleus. Elements of
the RRE structure in HIV-1 have been studied using NMR and crystallography (see [63] for
review of the RRE in lentiviruses). In addition, the entire structure has been predicted using
many computational/sequence analysis methods[38, 65, 59, 13]. Another known structure in a
coding region is thegag-pro-pol frameshift stem-loop that causes the ribosome to slip from the
gag reading frame to the pro-pol reading frame. Other studies have suggested the presence of
additional structures within coding regions[39, 86], but none of these structures have have been
consistently supported.
HIV-1 and HIV-2 are related primate lentiviruses resulting from transmissions of different
simian immunodeficiency viruses (SIVcpz from chimpanzees and SIVsm from sooty mangabeys,
respectively) into the human population (Figure 6). They share a similar genome organization
with differences in the placements of the accessory genes (vpr/vpu/vpx) and approximately
50% nucleotide identity. Previous work has described differences in the RNA structures of
the two viruses, again focusing mostly on the 5’ non-coding region and the RRE. The TAR
of HIV-2 is proposed to be a double-branched stem-loop, based on the evidence from several
thermodynamic predictions and covariation analyses,[6, 8, 57], whereas the HIV-1 structure is
unbranched. A recent study suggests that the TAR region of the HIV-2 transcript can assume
more than one form, and proposed an alternative extended stem structure using a combination
of enzymatic cleavage, gel shift mobility, and structural prediction techniques[79]. The HIV-2
dimerization initiation site (stem-loop 1), also located upstream of thegag gene, is proposed to
be longer and to have more stem sections than its HIV-1 counterpart[56]. Differences in stem
and loop lengths are also proposed for the stem-loop structure containing the primer binding
site and the poly-A signal[8], but the overall structure of both is similar between HIV-1[80] and
that predicted for HIV-2[8]. Predictions for the structure of the HIV-2 RRE also show overall
similarity to the HIV-1 structure, though the organization and relative length of the branches
is somewhat different[13, 59].
Here I compare predicted RNA structures derived from RNA-Decoder, a phylogenetic
stochastic grammar, for the complete genomes of HIV-1 and HIV-2. This method builds
on developments in structure prediction via machine learning methods (grammars) for
sin-gle sequences by combining the method with evolutionary information in a multiple sequence
alignment and phylogeny[82]. Its predictions are based both on sequence patterns and
differ-ences in evolutionary rates in base-paired versus non-base-paired regions. Essentially, regions
of conserved RNA base-pairs are expected to evolve more slowly than non-pairing regions due
to the necessity of maintaining the pairing interaction[44, 100, 82]. If positions with slower
rates also show sequence patterns characteristic of those observed for base-paired regions in the
training data set, such as the presence of matching base pairs, the method identifies these
po-sitions as stem popo-sitions with a high probability. To investigate the accuracy of the structural
predictions, I also compare the results of RNA-Decoder to a chemical analysis of the entire
HIV-1 genome[112] and note regions of congruence.
3.3
Materials and Methods
3.3.1 Grammar predictions of structure
I used the RNA-Decoder program, a phylo-grammar method, to identify regions of conserved
structure in the HIV-1 and HIV-2 genomes. Grammars and evolutionary models have been
previously combined into a single program called Pfold[52, 53]. An assumption of Pfold is
that the primary constraint on the rates of evolution in the input sequence alignment is the
presence or absence of RNA secondary structure; it does not take protein coding constraints
into account. Nearly all ( approx. 95%) of the HIV genome is protein-coding, and it is
well-known that the nucleotides within a codon evolve at different rates, the fastest being the third
position. In order to accurately observe rate differences between nucleotide positions that are
due to RNA structure, RNA-Decoder takes into account the rate differences expected based on
position within the codon. This method has been validated on HCV structures, where it was
shown to have a significantly better signal to noise relationship than other methods, including
thermodynamic methods, co-variation methods, and even Pfold. It has also been used to search
RNA-Decoder takes a multiple-sequence alignment, a phylogenetic tree, and grammar
pa-rameters as input. For this study, I used grammar papa-rameters derived from a previous training
on hepatitis C virus[82], tRNAs, and rRNAs. There are two possible outputs from
RNA-Decoder depending on the mode in which it is run. Scanning experiments output the pairing
probability for each nucleotide position, which is effectively the probability of that position
being in a stem in any possible structure containing it, given the phylogenetic tree and the
grammar structural model. More precisely, the pairing probability for positioni in alignment
Dwith the phylogenetic tree T is:
X k
P(πi =k|M)P(D|π, T, M) (3.1)
where k is over all stem structural labels (i.e. right-stem, left-stem), π is the structure, M is
the grammar model parameters, and P(πi =k|M) is the posterior probability that position i
has the specific structural labelk, given the grammar, and is calculated via the inside-outside
algorithm[24]. In Bayesian terms,P(π|M) is the prior probability of structureπ. P(D|π, T, M)
is the alignment probability, which is calculated using the Felsenstein algorithm[27]. Folding
experiments output the single highest-probability fold for an input sequence, which is calculated
via the CYK algorithm[24].
Using the scan mode, I performed a sliding window analysis of pairing probability across
the entire genomes. In order to accommodate as many pairing interactions as possible, I used
the largest scan window size the program would permit (1300 nucleotides), and spaced the
scans at 300-nucleotide intervals. Pairing probabilities for each scan were combined using R
into a prediction for the entire genome, for each site taking the maximum pairing probability
of the multiple overlapping predictions for that site. I also used the fold mode to fold entire
genomes in overlapping 800-nucleotide pieces. Folding and scanning jobs were executed on the
University of North Carolina’s Linux cluster. Accession numbers for all sequences used are
listed in Table 1. I wrote MATLAB code to convert the multiple sequence alignment files into
the specific input format required by RNA-Decoder, which is essentially a matrix transpose of
the standard alignment layout.
All HIV-1 predictions were made using the alignment of non-recombinant group M subtype
reference sequences (excluding subtype G, which has lately been shown to be a recombinant[1])
obtained from the Los Alamos HIV database, with minor manual editing. The input file also
requires that each nucleotide be assigned a number to indicate its position within a codon.
Codon positions in overlapping genome regions were designated according to the first member
of the following pairs: gag-pro, pol-vif, vpr-vif, vpr-tat, rev-tat, env-vpu, env-tat2, env-rev2.
Given the differences in nucleotide content and evolution patterns in the two halves of the HIV
genome, I scanned the genome in two sections, upstream and downstream, that overlapped in
thevifgene. This allowed use of separate phylogenetic trees for each scan with branch lengths
calculated according to the rates of evolution of those genome regions.
All HIV-2 predictions were made using a reduced version of the HIV-2 web alignment
available from the Los Alamos site (downloaded Dec. 6, 2007). The alignment was adjusted to
the coordinates of its reference sequence from SIVmac, MAC239 (GenBank accession: M33262),
but the MAC239 sequence was not included in the analysis. Codon positions in overlapping
regions were designated according to the reading frame of the first member of the following
pairs: gag-pro, pol-vif, vif-vpx, vpr-tat1, tat1-rev1, env-tat2, env-rev2, env-nef. As for the
HIV-1 genome, the alignment was scanned using separate trees for the upstream and downstream
sections.
3.3.2 Phylogenies and evolutionary rate estimation
All phylogenetic trees were generated by Tree-Puzzle[92], using the GTR+γ (4) model, 10,000
puzzling steps, accurate parameter estimation, and other default settings. The phylogenetic
tree for the first half of the HIV-1 genome was built on the third codon positions of the gag,
pro,pol, andvifgenes and the 5’ non-coding region, while the tree for the second half was built
on the third positions ofvif, vpr, rev, vpu, env,andnefgenes and the 3’ non-coding region. For
HIV-2, the upstream section tree was inferred from the third codon positions of thegag,pro,pol,
and vif genes and the 5’ non-coding region, while and the downstream tree was inferred from
the third positions of the vpx, vpr, tat1, env,and nefgenes and the 3’ non-coding region. The
topology of the trees for each genome did not significantly change between the upstream and
downstream trees. All trees are shown in Figure 7. I characterized the amount and distribution
distance, and maximum pairwise distance (Table 2). Total tree length is the sum of all branch
lengths in the tree and was calculated using the BioPerl Tree module[98]. Median and maximum
pairwise distances were calculated by HyPhy[55] using the branch lengths from the Tree-Puzzle
trees.
I used HyPhy to estimate relative rates of evolution across the HIV-1 genome. Rates were
estimated using the GTR model with beta-gamma rate distribution and eight categories.
3.3.3 Comparing grammar and chemical-thermodynamic predictions
I compared my results to a biochemical analysis of RNA structure in the HIV-1 genome[112]
that annotates each sequence position as either stem or non-stem. Since the pairing probability
output from RNA-Decoder is not binary, I chose a cutoff value to enable comparison of its results
to those of the thermodynamic method for each position. I aligned the
chemical-thermodynamic-derived structural annotation of the NL4-3 genome to the pairing probability
results for the HXB2-based genome alignment used for the RNA-Decoder input. I used the
R module ROCR[97] to plot the Matthews correlation coefficient across various cutoffs for the
pairing probability:
φ= p T P ∗T N−F P ∗F N
(T P +F N)(T P +F P)(T N+F P)(T N+F N) (3.2)
Instances of agreement between the two methods are considered true positives (TP) if both
methods predict a stem and true negatives (TN) if loop. False positives (FP) are cases where
RNA-Decoder predicts stem but the chemical-thermodynamic does not, while false negatives
(FN) are the converse. I also examined agreement between the two methods across various
cutoffs, where agreement is defined as the fraction of positions with matching structural
desig-nations between the two methods, but concluded that this measure was not appropriate for the
dataset because it does not take into account the fractions of false positives and false negatives
and thus gives a similar accuracy result across a wide range of cutoff values. I compared the
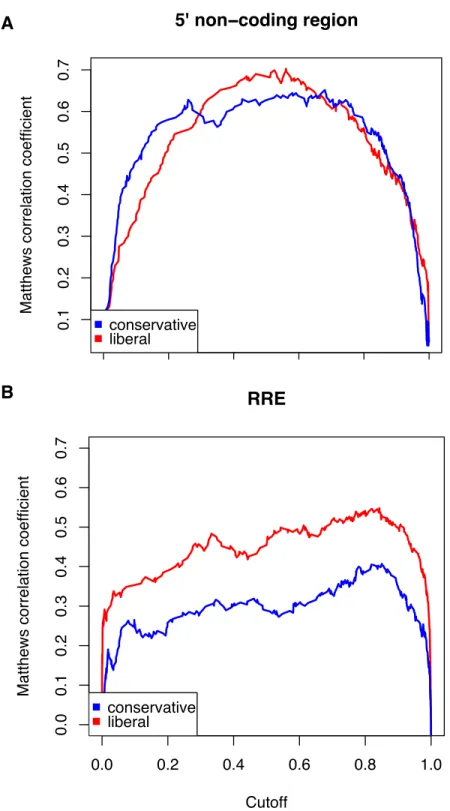
results of the correlation analysis in the RRE and the 5’ non-coding regions (Figure 8) for two
sets of grammar parameters – a more conservative and a more liberal set. The more liberal set
showed a significantly better correlation for the RRE than did the conservative set, while in
the 5’ non-coding region there was little difference. I selected the liberal parameter set since
most of the genome is protein-coding, as is the RRE, and the parameters that do best in the
RRE region were expected to perform best in the rest of the coding parts of the genome. For
the same reason, the cutoff value for calling a position a stem in RNA-Decoder (0.8) was also
selected to be the value that gave the highest correlation in the RRE region.
3.4
Results
3.4.1 Conserved structures in the HIV-1 M Group predicted by
RNA-Decoder
I examined conserved structures in the HIV-1 group M genomes by using RNA-Decoder to
calculate the pairing probability for each nucleotide position (Figure 9, large panels). Rather
than choose a single subtype to study, I included all of the non-recombinant subtypes of group
M in order to derive structure predictions that were relevant for all subtypes. All positions in
this alignment are numbered according to the HXB2 genome (accession number K03455). The
pairing probability represents the probability of the given position being in a base-paired stem
region of any possible structure containing the position. The effect of evolution rate on pairing
probability can be seen by comparing the top and bottom panels of Figure 9. Since structure
constraints are expected to slow evolution, regions of strong structure signal, such as the RRE,
should have a low rate. The reverse pattern can also be observed, where fast-evolving regions
have very low pairing probability.
RNA-Decoder’s grammar transition parameters were previously trained on hepatitis C virus
structures[82]. To determine whether those parameters were appropriate for HIV, I examined
the pairing probability results for the most well-described structures in HIV-1: the 5’
non-coding region, the RRE, and thegag-pro-polframeshift site structure (see Table 3 for structure
locations). These structures are effective positive controls because they represent a range of
structure complexity: the simple stem-loop structure of the gag-pro-pol frameshift site, the
series of stem-loops in the 5’ non-coding region of the genome (including TAR), and the large,
complex, 350-nucleotide RRE inenv. Our results clearly show strong predictions for conserved
all stem and loop sites for each structure. The highest-probability fold that is calculated by
RNA-Decoder for the RRE is similar to other published predicted structures, and most
base-pairs have a reliability (i.e. posterior probability) greater than 80% (Figure 10). These results
suggest that the method parameters are appropriate for structure identification in HIV-1 and
related viruses with similar mutation rates and patterns.
The RRE is the largest cohesive structure observed in the results for all the coding sequence.
A search for other regions with a similar magnitude of pairing probability identified several
regions. There are small predicted structural elements, particularly in the pro and pol genes,
and a series of peaks at the end of env and the middle of the nef gene. There are also several
regions where a distinct lack of structure is predicted, as evidenced by the several sharp peaks
of low pairing probability. These typically correspond to regions of high evolution, including the
envhyper-variable regions 1, 4, and 5 (located near positions 6600, 7400, and 7600, respectively).
These regions could be selected to lack structure to increase their rate of evolution[58] or for
other functional reasons, such as translation speed. The window size used for the genome scans
was large enough to pick up all pairing interactions within 1000 nucleotides of each other, with
the exception of pseudoknots, which are not predicted by RNA-Decoder. These results suggest
that structures in the coding region are either smaller than the RRE or have interactions that
span more than 1000 nucleotides and thus are not detected.
To get an idea of the type of structures represented by the regions of elevated pairing
probability, I examined the highest-probability structure reported by RNA-Decoder for several
regions (Figure 10). Most predictions are typically for an extended stem-loop, with a base stem
of at least two nucleotides and including a few bulges or smaller, branching stem-loops. Some
predictions show stems with as few as two base-pairs, but these are unlikely to be
thermody-namically stable and probably do not formin vivo. Although RNA-Decoder is clearly capable
of predicting structures as large as the RRE, the highest-confidence new folds are much smaller
structures.
3.4.2 Structure conservation across phylogenetic distance
To determine how well the structure signals described above were conserved across larger
phy-logenetic distances, I performed a similar genome scan of pairing probability using an alignment
![Figure 6: Phylogenetic tree for lentiviruses, inferred from the gag gene, as shown in [63].](https://thumb-us.123doks.com/thumbv2/123dok_us/8226974.2180827/77.918.163.666.448.744/figure-phylogenetic-tree-lentiviruses-inferred-gag-gene-shown.webp)