Kevin Eagan
Jennifer B. Lozano
Sylvia Hurtado
Matthew H. Case
the american freshman:
national norms fall 2013
COOPERATIVE INSTITUTIONAL RESEARCH PROGRAMat the HIGHER EDUCATION RESEARCH INSTITUTE AT UCLA
cirp
COOPERATIVE INSTITUTIONAL RESEARCH PROGRAM
The American Freshman:
National Norms Fall 2013
Prepared by the Staff of the
Cooperative Institutional Research Program
Kevin Eagan
Jennifer B. Lozano
Sylvia Hurtado
Matthew H. Case
Higher Education Research Institute
Graduate School of Education & Information Studies
University of California, Los Angeles
Higher Education Research Institute
University of California, Los Angeles
Sylvia Hurtado, Professor and Director
HERI Affiliated Scholars
Walter R. Allen, Allan Murray Cartter Professor of
Higher Education
Alexander W. Astin, Founding Director and
Senior Scholar
Helen S. Astin, Senior Scholar
Mitchell J. Chang, Professor
Patricia M. McDonough, Professor
Linda J. Sax, Professor
Rick Wagoner, Assistant Professor
Victor B. Sáenz, Associate Professor,
University of Texas at Austin
The Higher Education Research Institute
(HERI) is based in the Graduate School of
Education & Information Studies at the
University of California, Los Angeles. The Institute
serves as an interdisciplinary center for research,
evaluation, information, policy studies, and
research training in postsecondary education.
3005 Moore Hall/Mailbox 951521
Los Angeles, CA 90095-1521
www.heri.ucla.edu
310-825-1925
CIRP Advisory Committee
Betsy O. Barefoot
Vice President
John N. Gardner Institute
Victor M. H. Borden
Associate Vice President and Professor
Indiana University
Mark L. Gunty
Assistant Director of Institutional Research
University of Notre Dame
Marsha Hirano-Nakanishi
Assistant Vice Chancellor, Academic Research
California State University
Office of the Chancellor
Christine M. Keller
Associate Vice President for Academic Affairs
Association of Public and Land Grant Universities
Kurt J. Keppler
Vice Chancellor for Student Life and
Enrollment Services
Louisiana State University
Randy L. Swing
Executive Director
Association for Institutional Research
Sylvia Hurtado
Professor and Director, HERI
(ex-officio)
M. Kevin Eagan, Jr.
Interim Director, CIRP
(ex-officio)
ACKNOWLEDGMENTS:
Cover design by Escott & Associates. Page layout and text design by The Oak Co.
The authors wish to thank Lesley McBain and Melissa Aragon for their assistance in the preparation of this
manuscript.
Published by the Higher Education Research Institute.
Suggested citation:
Eagan, K., Lozano, J. B., Hurtado, S., & Case, M. H. (2013). The American freshman: National norms
fall 2013. Los Angeles: Higher Education Research Institute, UCLA.
To download additional copies of this monograph with expanded tables, please visit
http://heri.ucla.edu/tfsPublications.php
.
Copyright © 2013
By the Regents of the University of California
ISBN 978-1-878477-27-9
(paperback)
ISBN 978-1-878477-23-1
(e-book)
ISBN 978-1-878477-26-2
(e-book, expanded edition)
iii
CONTENTS
Introduction 1
The American Freshman: National Norms Fall 2013
4
Students Submitting More College Applications
5
Fewer Students Enroll in Their First-Choice Institution
6
Increasing Importance of Cost and Financial Aid in Students’ College Choice
7
Participation in Online Education
8
Taking Stock of Students’ Views One Year after Obama’s Re-Election
10
Gays’ and Lesbians’ Right to Adopt a Child
10
Undocumented Students and Access to Public Education
10
Raising Taxes
11
Control of Handgun Sales
12
Students’ High Schools and Neighborhoods Increasingly Diverse
12
Skills for a Diverse Workplace
13
Revised Careers in 2013
14
References 16
The 2013 National Norms
All First-Time, Full-Time Freshmen by Institutional Type
17
Appendix A: Research Methodology
43
Appendix B: The 2013 CIRP Freshman Survey Instrument
53
Appendix C: Institutions Participating in the 2013 CIRP Freshman Survey
61
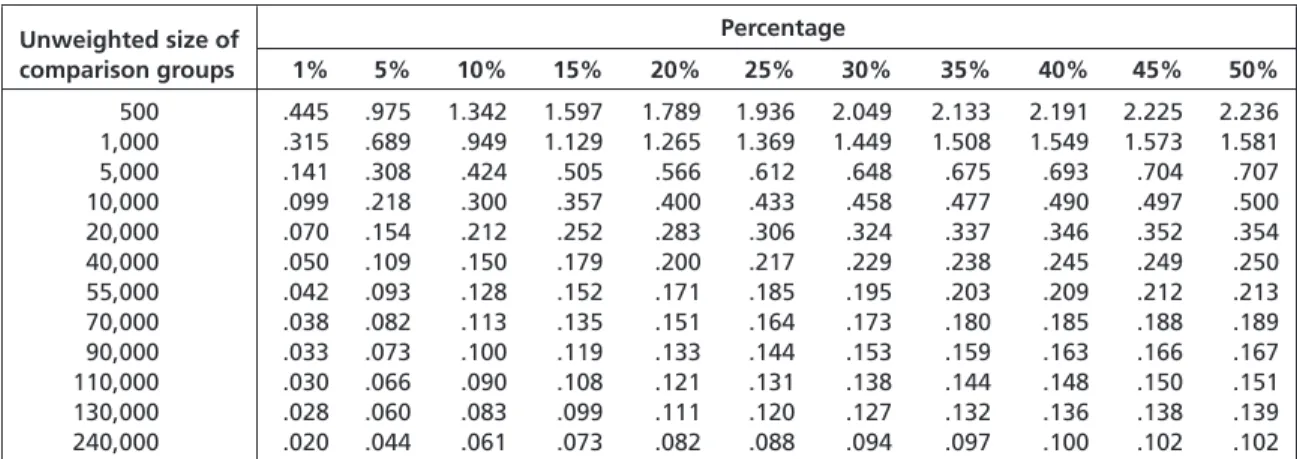
Appendix D: The Precision of the Normative Data and Their Comparisons
71
Appendix E: Changes to the Career Category Response Options
for the 2013 Survey
75
1
INTRODUCTION
undergraduate experience. They found that
students who interact more with faculty in their
first year are more likely to develop mentoring
relationships by their senior year. The authors
suggest that this early contact with faculty serves
as a way to socialize students into developing
interpersonal and navigational skills necessary to
establish meaningful, productive relationships
with faculty later in college.
A number of publications have focused on
diver-sity and climate-related issues. Two longitudinal
studies used the CIRP Freshman Survey and the
College Senior Survey to examine students’
cross-class interaction. Park and Denson (2013)
found that students attending more racially
diverse and socioeconomically diverse
institu-tions are more likely to have cross-class inter-
actions, increasing diversity engagement on
campuses. These findings point to a need for
institutions to think broadly about diversity, as
the authors emphasize the role of socioeconomic
diversity within institutions as one factor that
can address broader equity concerns within
higher education. Park, Denson, and Bowman
(2013) also found that, through cross-class
interactions, students attending racially diverse
institutions are more likely to be involved with
curricular/co-curricular diversity activities. The
authors conclude that both socioeconomic
diver-sity and racial diverdiver-sity collectively contribute to
a healthier campus racial climate for students,
while emphasizing that socioeconomic diversity
and racial diversity are not interchangeable.
Issues of college access, affordability, admissions
policies, and completion have continued to
dominate discussions of the role of higher
educa-tion in the past year. Court decisions regarding
affirmative action in college admissions as well
as proposals from the Obama administration to
create a college rating system have only served
to intensify these debates. At both federal and
state levels, colleges and universities are under
increasing scrutiny for their cost of attendance,
prevalence of part-time instructors, criteria used
to admit students, and the added value of the
credentials they confer. The Higher Education
Research Institute (HERI) continues to inform
national conversations regarding higher
educa-tion policy, and below we highlight several
publications that contribute to ongoing debates.
Research published in the last year analyzed data
from all five national surveys administered by
the Cooperative Institutional Research Program
(CIRP): the CIRP Freshman Survey, the Your
First College Year survey, the Diverse Learning
Environments survey, the College Senior Survey,
and the HERI Faculty Survey. Many of these
studies used multiple CIRP surveys, highlighting
the longitudinal advantages of the CIRP surveys
in examining and understanding student
experi-ences and outcomes throughout college. For
example, Fuentes, Ruiz Alvarado, Berdan, and
DeAngelo (2013) used the CIRP Freshman
Survey, the Your First College Year survey, and
the College Senior Survey to look at students’
interactions with faculty over the course of their
2
the faculty and in the curriculum to cultivating
academic validation and inclusive learning
envi-ronments for diverse student bodies. Victorino,
Nylund-Gibson and Conley (2013) examined
the relationship between faculty perceptions
of campus racial climate and satisfaction with
opportunities for research, teaching load, and
autonomy. The authors found that faculty who
perceive positive climates on their campus also
tended to report higher levels of satisfaction.
These findings held irrespective of faculty’s race/
ethnicity or gender, indicating that a positive
campus racial climate matters for all faculty.
Hurtado and Figueroa (2013) compared the
experiences of STEM women of color with
White, female, male, and Asian counterparts,
and show distinct experiences across race and
gender with regard to stress related to
discrimi-nation and bias. In another faculty study, an
op-ed describing institutions’ use of part-time
faculty appointments (Eagan, 2013) contributed
to the national discussions about contingent
faculty. More information about the HERI
Faculty Survey, which is available for
adminis-tration through May of 2014, can be found at
http://heri.ucla.edu/facoverview.php
.
In addition to publishing research articles,
monographs, and briefs, HERI staff and
affili-ates have disseminated CIRP findings at national
and regional conferences. In 2013 we also
intro-duced the HERI Faculty Institute on Work/Life
Issues. Given the strong demand from this
inaugural offering, we look forward to the 2014
Faculty Institute where we will unveil findings
from the 2014 HERI Faculty Survey. More
information on the 2014 Faculty Institute,
which is one of four summer institutes for
2014, can be found at
http://heri.ucla.edu/
facultyInstitute.php
.
Another longitudinal study using the CIRP
Freshman Survey and the College Senior Survey
looked at undocumented students’ access to
college (Herrera, Garibay, Garcia, & Johnston,
2013). Herrera et al. found that Latino students
and female students were more likely to support
educational access for undocumented
immi-grants. Likewise, the authors found that students
who engaged with diversity while in college—by
attending a racial/cultural awareness workshop,
by enrolling in an ethnic studies course, or by
participating in study abroad—tended to be
more supportive of undocumented students
enrolling in college. As this continues to be an
important public policy issue, it is important to
understand how students’ perspectives toward
undocumented student populations change.
Continuing roughly a decade of research on the
pathways taken by students pursuing science,
technology, engineering, and mathematics
(STEM) degrees, a team led by Drs. Sylvia
Hurtado and Kevin Eagan published results
from analyses of CIRP Freshman Survey and
College Senior Survey data. Eagan, Hurtado,
Chang, Garcia, Herrera, and Garibay (2013)
examined whether participation in a structured
undergraduate research program significantly
contributed to STEM students’ intentions
to pursue graduate or professional degrees in
STEM disciplines. Their findings show that
students who participate in undergraduate
research programs are substantially more likely
to express intentions to pursue a STEM graduate
or professional degree compared to their peers
who do not participate in these opportunities.
Hurtado and Ruiz Alvarado (2013) used data
from the Diverse Learning Environments survey
and the HERI Faculty Survey to look at
inclu-sive learning environments. Their findings
highlighted the importance of diversity in both
3
New Reporting Feature:
First Choice Institution Freshmen
in Comparison with Peers
This year we are also excited to include a new
feature in our standard reporting package
deliv-ered to campuses. Institutions will find an
enrollment management report in their
institu-tional profile that compares the responses from
students who indicated they had enrolled in their
first-choice institution against their peers who
did not enroll in their first-choice campus. We
hope this additional cut of the data will provide
campuses with helpful information about the
needs and expectations of their students.
Kevin Eagan
Interim Director
4
THE AMERICAN FRESHMAN:
NATIONAL NORMS FALL 2013
Analyses of the 48th annual administration of the CIRP Freshman Survey find substantive
shifts in students’ college application strategies, as students increasingly apply to more than
four institutions. With fewer students enrolling in their first-choice institution, the data show
that college cost and financial aid issues have become even more salient in students’ college
choice process. Given the proliferation of online education in recent years, students’
partici-pation in online instruction before coming to college and expectations to enroll in online
courses while in college are examined. More than a year after President Barack
Obama was re-elected, we take stock of students’ attitudes about some of the
most-discussed political issues in 2013, including gun control, taxes, and gay
rights. We also review the changing demographics of students’ high schools and
neighborhoods, and changes in the CIRP Freshman Survey made to more
accurately capture students’ cognitive and interpersonal skills associated with
engaging in a diverse society. Finally, we analyze the impact of changes made to the 2013
CIRP Freshman Survey that expanded and revised our set of response options for students’
and their parents’ careers.
The results reported in this monograph are based upon 165,743 first-time, full-time students
who entered 234 four-year U.S. colleges and universities of varying levels of selectivity and
type. Weights have been applied to these data to reflect the more than 1.5 million first-time,
full-time undergraduate students who began college at 1,583 four-year colleges and
universi-ties across the U.S. in the fall of 2013. This means that differences of one percentage point
in the results published here reflect the characteristics, behaviors, and attitudes of more than
15,000 first-year students nationally. We describe the full methodology of the CIRP Freshman
Survey administration, stratification scheme, and weighting approach in Appendix A.
College cost and financial
aid issues have become even
more salient in students’
college choice process.
5
Students Submitting More
College Applications
The proportion of students submitting
applica-tions to more than three additional colleges
jumped substantially in 2013. Figure 1 shows
that 55% of first-time, full-time students
applied to more than three other colleges in
addition to the application they submitted for
their current institution. Since 2008, the
propor-tion of students applying to more than three
other colleges has increased by more than
10 percentage points (44.5% in 2008 to 55%
in 2013). Just more than one in ten (10.9%)
students reported that they did not apply to any
other institutions for the fall 2013 admissions
cycle—their one and only application was
submitted to the institution in which they
enrolled.
It may be that students
have perceived stronger
competition in the college
admissions process and thus
are applying more broadly to
increase their likelihood of
being admitted to at least
one campus. The increase in
the number of applications
may also be due to services
such as The Common
Application making the
process of applying to
multiple institutions less
burdensome for students.
Figure 2 shows how recent
increases in the proportion
of students submitting
college applications to more
than three other colleges
correspond with new
member institutions being
added to The Common
Application program. Just in
the last 10 years, institutional
membership in The Common
Application has more than
doubled, while the proportion
of students submitting
applica-tions to more than three other campuses has
risen by nearly 20 percentage points. Similarly,
many state systems, such as the University of
California and the California State University
system, enable prospective students to apply to
multiple institutions within the system using a
single application. These same systems offer
students with demonstrated financial need fee
waivers to alleviate the costs associated with
multiple applications.
% of St udents 60 50 40 30 20 10 0 1977 1980 1983 1986 1989 1992 1995 1998 2001 2004 2007 2010 2013 No additional applications 1–3 additional applications More than threeadditional applications
Figure 1. Trends in the Number of Additional College Admissions Applications Students Submitted
55% of first-time, full-time
students applied to more
than three other colleges in
addition to the application
they submitted for their
current institution.
6
Fewer Students Enroll in Their
First-Choice Institution
As students apply for admission at increasing
numbers of colleges and universities, fewer
students are enrolling at their first-choice
institu-tion. The proportion of students enrolling at
their first-choice institution is at its lowest point
since we began asking the question in 1974. In
2013, 56.9% of students enrolled at their
first-choice campus, which is down 2.4 percentage
points from 2012. This contrasts with more than
three-quarters (75.5%)
of students having been
admitted to their
first-choice campus.
The top reasons why
students who are accepted
to their first choice
institu-tion opt to enroll elsewhere
mostly center around cost.
As shown in Figure 3,
roughly a quarter (25.7%)
of students accepted to
their first-choice college or
university chose to enroll
at a different institution
because they were not
offered aid by their first-choice campus. Just over
40% of students said that being unable to afford
their first-choice college was a “very important”
consideration in deciding to enroll in an
institu-tion other than their first-choice college.
Although inadequate aid and higher costs
prompted many students to turn down
admis-sions offers by their first-choice institutions
in lieu of admissions offers elsewhere, other
students who were accepted to their first-choice
college enrolled elsewhere
due to more attractive
finan-cial aid packages and lower
college costs at competing
campuses. Nearly 60% of
students who were accepted
to but turned down their
first-choice insti tution
decided to enroll elsewhere
due to the financial aid
package offered by their
current institution. Like-
wise, 62.1% of students
admitted to but not enrolled
% of St udents Number of Common Application Member s 60 50 40 30 20 10 0 600 500 400 300 200 100 0 1977 1980 1983 1986 1989 1992 1995 1998 2001 2004 2007 2010 2013
More than three additional applications
Number of Member Institutions in the Common Application Figure 2. Trends in College Admissions Applications and
Common Application Member Institutions
Not offered aid by first choice
institution
% of St
udents
Could not afford first choice institution Was offered financial assistance by current institution The cost of attending this college 25.7 70 60 50 40 30 20 10 0 40.4 59.7 62.1
Figure 3. College Choice Factors among Students Accepted to But Not Enrolled in First-Choice Institution (% Indicating “Very Important”)
7
in their first-choice campuses indicated that
the cost of their current institution was a “very
important” factor in their college choice.
Increasing Importance of Cost and
Financial Aid in Students’ College Choice
The top reasons for choosing a particular college
continue to be the institution’s “very good”
academic reputation (64% indicating “very
impor-tant” in 2013) and the college’s graduates getting
good jobs (53.1% indicating “very important” in
2013); however, cost considerations increasingly
weigh on students’ enrollment decisions. Fig-
ure 4 shows trends in the most salient factors in
students’ college choice process. The percentage of
students indicating that the cost of attending their
current institution was a “very important” factor
in their college choice process is at its highest
point in the 10 years we have asked the question.
Figure 4 shows that the cost of attendance at
this college was rated as being “very important”
in students’ enrollment decision by 45.9% of
students—up 2.6 percentage points from 2012
and up 14.9 percentage points from 2004.
Similarly, the percentage of students indicating
their financial aid packages as “very important”
in their college choice decision is also at its
highest point in the 42-year history of the item.
Nearly half (48.7%) of students reported that
their current institution’s financial aid offer was
a “very important” factor in their decision to
enroll at that campus—up from 33.7% in 2004.
Parsing the data by education levels of students’
parents reveals that college costs and financial
aid packages are particularly salient for
first-generation students (i.e., students in families
where neither parent attended any college).
Figure 5 breaks down financial aid and cost
concerns by first-generation status. The findings
indicate that more than half (53.9%) of
first-generation students reported that the cost of
attendance at their current institution was a
“very important” factor in their decision to
enroll at that college. By contrast, 43.8% of
continuing generation students rated cost of
attendance as being “very important” in their
enrollment decision.
% of St udents 60 70 50 40 30 20 10 0 1977 1974 1980 1983 1986 1989 1992 1995 1998 2001 2004 2007 2010 2013 I was offered financial assistance The cost of attending this collegeThis college has a very good academic reputation This college’s graduates get good jobs
Figure 4. Top Reasons for Choosing Current Institution (% Indicating “Very Important”)
8
Financial aid weighs even more heavily for
first-generation students, as more than 60% of
first-generation students reported that being
offered financial aid was a very important
consideration in deciding to enroll at their
current institution. By contrast, less than half
(46%) of continuing generation students
expressed a similar sentiment.
The issues of college costs and financial aid
pack-ages are becoming more crucial at a time when
more than half (50.8%) of students report relying
on loans to pay for college, and nearly
three-quarters (72.9%) report funding their education
through grants, scholarships, and other aid that
does not need to be repaid. Collectively, the
trends regarding the role of financial aid and
college costs in students’ college choice process
should signal to institutions that they must
continue their efforts to simultaneously constrain
costs and craft financial aid packages that
adequately address students’ financial needs.
Participation in Online Education
Recent years have seen a push for online access to
education; as a result, there have been significant
developments of Open Educational Resources
(OER) through sites such as Khan Academy and
MIT OpenCourseWare,
and Massive Open Online
Courses (MOOCs) through
providers such as edX,
Udacity, and Coursera. To
learn more about incoming
students’ use of these online
resources, the 2013 CIRP
Freshman Survey added
two new questions asking
how often students in the
past year have “used an
online instructional website (e.g., Khan Academy,
Coursera): as assigned for a class, or to learn
The cost of attendingthis college % of St udents I was offered financial assistance 43.8 70 60 50 40 30 20 10 0 53.9 46.0 60.4 Continuing Generation First Generation Figure 5. College Choice Factors by First-Generation Status
(% Indicating “Very Important”)
Students who chose to
independently use online
instructional websites are
also more likely to exhibit
behaviors and traits
associated with academic
success and lifelong learning.
something on your own.” About four out of ten
(41.8%) incoming students “frequently” or
“occasionally” used an online instructional
website as assigned for a class in the past year.
Students were, however, much more likely to
utilize these resources independently—almost
seven out of ten (69.2%) incoming first-year
students have used such sites “frequently” or
“occasionally” to learn something on their own.
Students who chose to independently use online
instructional websites are also more likely to
exhibit behaviors and traits associated with
9
academic success and
life-long learning, measured by
the CIRP Habits of Mind
construct. Table 1 shows the
proportion of students
engaging in instructional
websites by their Habits of Mind construct
scores. Among the students who “frequently”
used an online instructional website to learn
something on their own, 42.3% scored in the
high Habits of Mind group and only 15.4% in
the low group. By comparison, of the incoming
students who “occasionally” or never used
instructional websites to learn something on
their own, only 22.3% and 25.5%, respectively,
scored in the high group.
As colleges and universities across the country
have been increasing online course offerings to
accommodate larger enrollments and constrain
costs, the 2013 CIRP Freshman Survey also
included two new items asking incoming
students whether they expected to take a course
exclusively online either at their institution or at
a different institution. Overall, few incoming
first-year students indicated there is a “very good
chance” that they will enroll in online courses
while attending college (6.5%
at their institution and 2.9%
at a different institution).
Students’ expectations to
take courses online at their
institution also vary by the
type of institution in which
they enroll. As shown in
Figure 6, a substantially
higher percentage of
students at Historically
Black Colleges and
Universities (HBCUs) than
students attending other
institution types expect there to be a “very good
chance” that they will take a course exclusively
online at their institution (13.9%). By contrast,
students attending private
colleges and universities are
among the least likely to expect
to enroll in online courses at
their institutions (5.8% at
private colleges, 3.9% at private
universities).
Students who have used an
online instructional website in
the past year are also more likely
to be drawn to taking courses
online while in college. Nearly 30% of incoming
first-year students who used an online
instruc-tional website frequently in the past year indicate
there is either “some chance” or a “very good
chance” they will take a course exclusively online
at their institution.
Table 1. Habits of Mind among Students Who Used an Online Instructional Website in the Past Year
Used an online instructional website
(e.g., Khan Academy, Coursera) TFS Habits of Mind Group
to learn something on your own Low Average High
Not at all 31.6 42.9 25.5 Occasionally 34.7 43.0 22.3 Frequently 15.4 42.3 42.3 3.9 5.8 6.7 8.0 13.9 0 2 4 6 8 10 12 14 16 Private
Universities 4-Year Colleges Private Universities Public 4-Year Colleges Public HBCUs
% of Students
Figure 6. Students’ Expectations That They Will Take a Course Exclusively Online at Their Institution, by Institution Type
(% Indicating “Very Good Chance”)
Students who have used
an online instructional
website in the past year
are also more likely to be
drawn to taking courses
online while in college.
10
Taking Stock of Students’ Views
One Year after Obama’s Re-Election
Freshmen started college in 2013 slightly less
than a year after Barack Obama was re-elected
for a second term; the year since his re-election
featured a great deal of political wrangling both
in Washington, D.C. and in the states. In June
of 2013, the Supreme Court issued a landmark
ruling in United States vs. Windsor, striking down
a key portion of the Defense of Marriage Act
(DOMA) that denied federal benefits to married
same-sex couples. The shooting at Sandy Hook
Elementary School sparked an intense debate on
gun control both in Congress and in the states.
Congress passed a hotly contested bill that raised
taxes on the wealthiest Americans, and the
Senate passed a comprehensive immigration
reform package. Given these widely publicized
political debates, we examined students’ political
views related to some of these events.
Gays’ and Lesbians’ Right to Adopt a Child.
In
2013, the survey included a question on gays’
and lesbians’ right to legally adopt a child, and
the vast majority of first-year students were
supportive (83.3%). First introduced three years
ago, this is the second time this item has
appeared on the CIRP Freshman Survey. As
reported in 2010, over three quarters (76.5%) of
students were supportive of gays’ and lesbians’
right to adoption; this year’s support increased
by 6.8 percentage points. Last year’s survey
results also showed widespread support of
same-sex marriage (75.0%) among first-year students.
Although most students are supportive, and
both men and women have increased their
support since 2010, women continue to be
considerably more supportive than men. In
2013, 86.8% of women and 79.2% of men
endorsed the rights of gays and lesbians to adopt
children, compared to 2010 when 82.1% of
women and 69.8% of men supported this
senti-ment (see Figure 7). These findings, coupled
with students’ support in 2012 of same-sex
marriage, underscore the
overwhelming support for
gay rights among college
students.
Undocumented Students
and Access to Public
Education.
While Congress
continues to debate a
comprehensive immigration
reform package,
undocu-mented students have
garnered support for access
to higher education with
state-level DREAM Acts
69.8 79.2 82.1 86.8 0 10 20 30 40 50 60 70 80 90 100 2010 2013 % of Students Men Women Figure 7. Support for Gays and Lesbians to Legally Adopt a Child, by Year and Sex(% Indicating “Agree Strongly” or “Agree Somewhat”)
Incoming college
students have voiced
stronger and stronger
support over time for
undocumented students’
access to education.
11
having passed in over a dozen states. The
freshman cohort of 2013 posted the lowest level
of support for the idea that undocumented
immigrants should be denied access to public
education since the question was first asked in
1996. Figure 8 shows an overall drop from
56.3% in 1996 to 40.7% in 2013, a 15.6
percentage point drop, and a steady decline since
2008. Thus incoming college students have
voiced stronger and stronger support over time
for undocumented students’ access to education.
Regional differences persist in support for the
idea of granting access to public education
among undocumented students, and this is
reflected by only some states having enacted
legislation allowing undocumented students to
pay in-state tuition rates to facilitate their access
to a college education. Students attending
insti-tutions located in the Far West (69.4%) and the
Plains states (64.7%) were the most likely to
support allowing undocumented students to
access public education. These regions include
California, Kansas, and Nebraska, all states that
have passed measures supportive of
undocu-mented students being granted access to
education. By contrast, students at colleges and
universities in the Southwest (48.5%) and Rocky
Mountains (49.7%) were among the most likely
to support the notion of denying access to public
education for undocumented students.
Raising Taxes.
In the year after Congress passed
the first set of significant tax increases on the
wealthy since the Clinton administration,
incoming freshmen’s support of raising taxes to
reduce the deficit has reached its highest level
since this question was first asked in 1985, with
over a third (36.9%) of incoming students in
agreement (see Figure 8). Last year we reported
on the substantial increase in students’
agree-ment that wealthier people should pay more
taxes, and support for this idea jumped another
3.5 percentage points in 2013. Now more than
two-thirds (68.1%) endorse the idea that
wealthier people should pay a larger share of
taxes than they do now. Economic populism
appears to be resonating with this year’s college
freshmen.
15 25 35 45 55 65 75 85 95 1974 1977 1980 1983 1986 1989 1992 1995 1998 2001 2004 2007 2010 2013 % of StudentsThe federal government should raise taxes to help reduce the deficit Wealthier people should pay a larger share of taxes than they do now Undocumented immigrants should be denied access to public education The federal government should do more to control the sale of handguns Figure 8. Trends on Students’ Political and Social Views
(% Indicating “Agree Strongly” or “Agree Somewhat”)
Now more than two-thirds (68.1%)
endorse the idea that wealthier
people should pay a larger share
of taxes than they do now.
12
As the government struggles for bipartisan
agree-ments on budget issues, differences in support
for increased taxes to reduce the deficit and for
increasing taxes on the wealthy are apparent
across students’ political ideologies. Nearly half
(49.7%) of all students identifying as liberal or
far left agree that the government should raise
taxes to reduce the deficit, which compares to
just more than a third (35.1%) of students
iden-tifying as middle of the road and a quarter
(25.1%) of students with conservative or far
right political ideologies.
Control of Handgun Sales.
Another closely
watched political issue in 2013 was gun control.
Since 1989 first-year students have responded to
an item on the CIRP Freshman Survey regarding
their level of agreement with a statement that
the federal government should do more to
control the sale of handguns. Support peaked
in 1998 with over eight out of ten students
(84.1%) supporting the federal government in
controlling handgun sales (see Figure 8). In
2013, just over six out of ten students (63.8%)
supported stronger gun control from the federal
government, an overall drop of 20 percentage
points from this item’s 1998 peak. While the
majority of students still support this statement,
the level of support has diminished since 1998.
The political ideological divides are even starker
in the case of gun control compared to taxes,
with just over one-third (36.5%) of conservative
and far right students endorsing stronger gun
control compared to 82.2% of liberal and far left
students. Nearly two-thirds (64.8%) of students
identifying their political ideology as “middle of
the road” agreed that the federal government
should do more to control the sale of handguns.
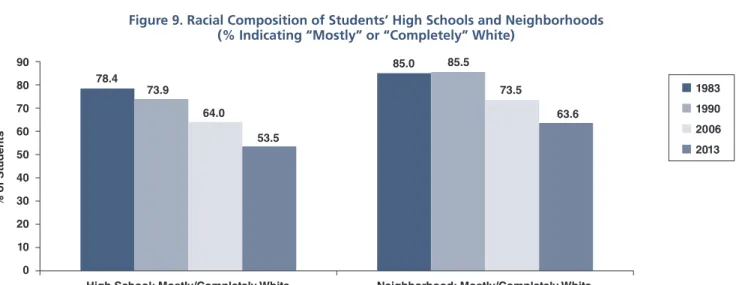
Students’ High Schools and
Neighborhoods Increasingly Diverse
The pace at which students report coming from
more racially diverse high schools and
neighbor-hoods has accelerated in the last several years.
Figure 9 shows four data points: 1983, 1990,
2006, and 2013. In the 23 years spanning 1983
to 2006, the proportion of incoming students
indicating that their high school was “mostly” or
“completely” White dropped 14.4 percentage
points. In the seven years spanning 2006 to
High School: Mostly/Completely White
% of St
udents
Neighborhood: Mostly/Completely White 78.4 73.9 64.0 53.5 85.0 85.5 73.5 63.6 70 80 90 60 50 40 30 20 10 0 1983 1990 2006 2013 Figure 9. Racial Composition of Students’ High Schools and Neighborhoods
13
2013, that figure has dropped another 10.5
percentage points, with just more than half
(53.5%) of students indicating their high school
was “mostly” or “completely” White.
Similarly, neighborhoods are rapidly becoming
more racially diverse. Between 1983 and 2006,
the proportion of students indicating that their
neighborhood was “mostly” or “completely”
White dropped 11.5 points from 85% to 73.5%.
In the seven years since 2006, the proportion of
students indicating they came from a
neighbor-hood that was “mostly” or “completely” White
fell nearly 10 more percentage points to 63.6%.
These data point to large demographic changes
currently underway across the U.S., and they
correspond with the increasing racial diversity
of the student sample represented in the CIRP
Freshman Survey. The data portend substantial
shifts in the composition of future incoming
cohorts at colleges and universities nation-
wide, and campuses need to consider how to
accommodate the needs of a more diverse
student body.
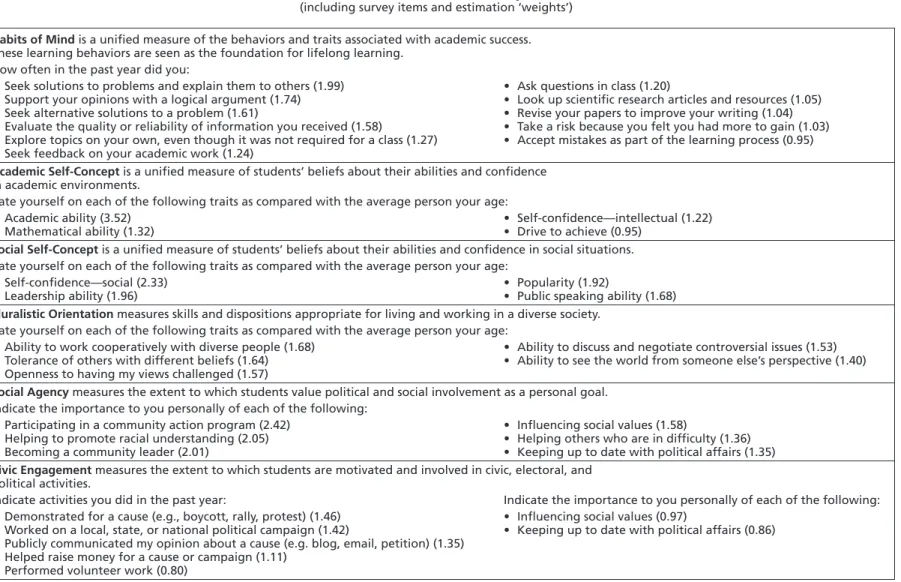
Skills for a Diverse Workplace
The 2013 CIRP Freshman Survey had a new set
of response options for items developed from
research on preparing college students for a
diverse workplace
and democracy,
following
longitu-dinal research on the
pluralistic
orienta-tion scale (Engberg
& Hurtado, 2011;
Hurtado, 2005). The
new response categories ask whether students
view each skill as “a major strength,” “some-
what strong,” “average,” “somewhat weak,”
or “a major weakness” for survey items shown
in Table 2. Although previous CIRP items are
not comparable in terms of trends, the survey
items now correspond with published empirical
evidence. This research identifies the college
experiences associated with gains students make
while in college on a set of cognitive and
inter-personal skills that compose the pluralistic
orientation scale.
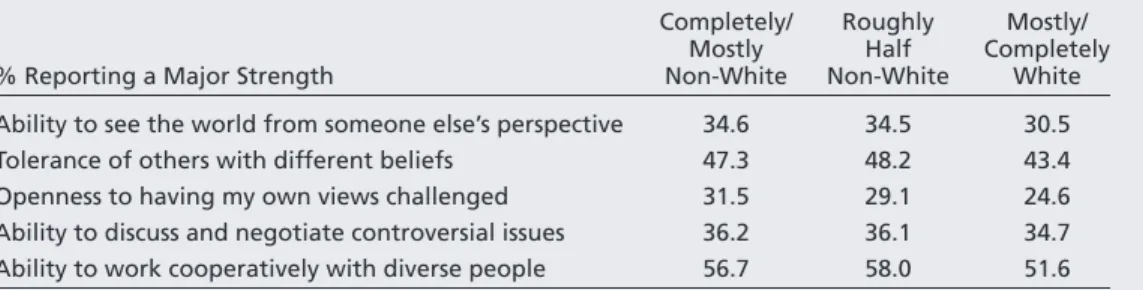
Freshmen, in general, believe they have the
ability to work cooperatively with others and
to tolerate others of different beliefs; however,
freshmen scored themselves lowest on their
openness to having their own views challenged.
Table 2 shows distinctions among students’
major strengths based on the racial composition
of the high school. Students attending “mostly”
or “completely” White high schools are least
Table 2. Skills for a Diverse Workplace: Pluralistic Orientation Scale Items by Racial Composition of the High School
Completely/ Roughly Mostly/ Mostly Half Completely % Reporting a Major Strength Non-White Non-White White Ability to see the world from someone else’s perspective 34.6 34.5 30.5 Tolerance of others with different beliefs 47.3 48.2 43.4 Openness to having my own views challenged 31.5 29.1 24.6 Ability to discuss and negotiate controversial issues 36.2 36.1 34.7 Ability to work cooperatively with diverse people 56.7 58.0 51.6
Freshmen scored
themselves lowest
on their openness
to having their own
views challenged.
14
confident across all the skill measures of
perspective-taking, tolerance, openness, ability
to discuss controversial issues, or cooperation
with diverse people. For example, only one
quarter (24.6%) of students at predominantly
White high schools indicate openness to having
their own views challenged as a “major strength,”
compared with 31.5% of students at non-White
and 29.1% of students from roughly half
non-White high schools. These different experiences
and skills become evident in classrooms and
interactions on college campuses, requiring
faculty and staff to be attentive to students’
backgrounds and how they can move students
from their own embedded worldviews.
Revised Careers in 2013
We revised the list of career categories for
students and their parents on the 2013 CIRP
Freshman Survey in an effort to modernize the
set of options offered (Appendix E shows how
the new career categories map onto the previous
ones). We more than doubled the number of
career options in business (going from five
cate-gories to eleven) and added three new choices
to better distinguish the broad category of
education (early childcare provider, librarian,
and teacher’s assistant/ paraprofessional). We also
created a new aggregated category referred to as
“Service/Industry.” This new service/industry
category included new occupations such as
custodian/janitor/housekeeper, food service, and
hair stylist. Additionally, existing careers related
to skilled trades and interior design were
included in this broad classification.
Expanding the set of career options available
for students to select had the desired effect of
substantially reducing the proportion of students
who selected “other.” In 2012, 11.5% of
students did not find a relevant career category
in our list and opted to mark “other.” In 2013,
the proportion of students marking “other”
dropped to just 4.9%, showing that the updated
categories are capturing more of students’
intended future careers.
Business continues to be the most popular
career aspiration for entering college students, as
13% of incoming first-time, full-time students
reported planning to pursue a career in business
after graduation. Roughly 11% of students
reported aspirations to be a medical doctor,
surgeon, dentist, or orthodontist. Health care
support (e.g., home health worker, medical/
dental assistant) was the third most popular
career aspiration with 9.2% of students
indi-cating plans to pursue an occupation in this area.
Another change made to the career question in
2013 had to do with how students reported
their parents’ occupational status. In previous
surveys, students had the option of choosing
“unemployed” as a career category for each of
their parents. In the survey redesign process,
we decided to ask students about their parents’
employment status separately from parents’
careers. This new employment status question
included three options: employed, unemployed,
and retired.
Having students report parental employment
status this way significantly changed
unemploy-ment rates for parents when compared against
previous CIRP Freshman Survey
administra-tions. For example, in 2012, 9.1% of students
reported that their mother was unemployed
and 4.7% of students indicated that their father
was unemployed. In 2013, 20.5% of students
indicated their mother was unemployed, and
8.5% reported their father was unemployed.
15
Digging into the data, we found that students
were more likely to report a parent as
unem-ployed if that parent also had a designated
occupation/career as a homemaker. For example,
13.8% of students reported that their mother
worked as a homemaker, and 57.1% of those
respondents also indicated that their mother was
unemployed.
Given that students now have the option of
identifying a career or occupation for each
parent and indicating each parent’s current
employment status, the proportion of students
indicating that they have an unemployed parent
is no longer comparable to previous years’
surveys.
16
References
Eagan, M. K. (2013, February). The plight of part-time faculty. University Business.
http://www.
universitybusiness.com/article/plight-part-time-faculty
.
Eagan, M. K., Hurtado, S., Chang, M. J., Garcia, G., Herrera, F., & Garibay, J. (2013). Making a
difference in science education: The impact of undergraduate research programs. American Educational
Research Journal, 50(4), 683–713.
Engberg, M., & Hurtado, S. (2011). Developing pluralistic skills and dispositions in college:
Examining racial/ethnic group differences. Journal of Higher Education, 82(4), 416–443.
Fuentes, M. V., Ruiz Alvarado, A., Berdan, J., and DeAngelo, L. (2013). Mentorship matters: Does
early faculty contact lead to quality faculty interaction? Research in Higher Education, (online version).
Herrera, F. A., Garibay, J. C., Garcia, G. A., & Johnston, M. P. (2013). Documenting attitudes toward
undocumented immigrant access to public education: A multilevel analysis. The Review of Higher
Education, 36(4), 513–549.
Hurtado, S. (2005). The next generation of diversity and intergroup relations research. Journal of
Social Issues, 61(3), 595–610.
Hurtado, S. & Figueroa, T. (2013). Women of color among STEM faculty: Experiences in academia.
Proceedings of the National Academy of Sciences Conference, “Seeking Solutions: Maximizing American
Talent by Advancing Women of Color in Academia.” Washington, DC.
Hurtado, S. & Ruiz Alvarado, A. (2013). Diversity in teaching and learning: Affirming students as
empowered learners. Diversity & Democracy: Civic Learning for Shared Futures, 16(3).
Park, J. J., & Denson, N. (2013). When race and class both matter: The relationship between
socio-economic diversity, racial diversity, and student reports of cross-class interaction. Research in Higher
Education, 54(7).
Park, J. J., Denson, N., & Bowman, N. A. (2013). Does socioeconomic diversity make a difference?
Examining the effects of racial and socioeconomic diversity on the campus climate for diversity.
American Educational Research Journal, 50(3), 466–496.
Victorino, C., Nylund-Gibson, K., & Conley, S. (2013). Campus racial climate: A litmus test for
faculty satisfaction at four-year colleges and universities. Journal of Higher Education, 84(6).
2013 National Norms
All First-Time, Full-Time Freshmen
by Institutional Type
Please refer to the HERI website publications section for
information on how to obtain the expanded set of tables.
http://heri.ucla.edu/research-publications.php
2013 CIRP Freshman Survey
Weighted National Norms—All RespondentsBaccalaureate Black Colleges
All Bacc Institutions 4-year Colleges Universities and Universities Institutions 4-yr Coll Universities Public Private Nonsec Catholic Oth Relig Public Private All HBCU Public Private
19
First-Time, Full-Time Freshmen 165,558 96,488 69,070 33,635 62,853 28,699 13,777 20,377 43,363 25,707 3,995 2,670 1,325
How old will you be on December 31 of this year?
17 or younger 2.0 1.9 2.1 2.1 1.7 1.7 1.7 1.6 2.1 2.1 2.9 2.7 3.2
18 68.8 67.5 70.2 69.3 65.2 67.0 69.8 61.3 70.5 69.1 67.2 65.6 70.3
19 27.7 28.5 26.8 26.4 31.2 29.3 27.1 34.9 26.5 27.9 26.1 27.5 23.6
20 or older 1.5 2.1 0.9 2.2 2.0 2.0 1.4 2.2 0.9 0.9 3.8 4.3 2.8
Is English your native language?
Yes 89.4 90.4 88.4 88.8 92.4 90.7 90.7 94.9 88.7 87.1 97.6 97.7 97.5
No 10.6 9.6 11.6 11.2 7.6 9.3 9.3 5.1 11.3 12.9 2.4 2.3 2.5
In what year did you graduate from high school?
2013 98.0 97.4 98.7 97.1 97.7 97.5 98.5 97.5 98.8 98.4 96.3 95.5 97.9
2012 1.4 1.8 0.9 2.0 1.6 1.7 1.0 1.7 0.8 1.2 2.3 2.8 1.2
2011 or earlier 0.5 0.7 0.3 0.8 0.6 0.7 0.5 0.7 0.3 0.3 1.2 1.4 0.8
Passed G.E.D./Never completed high school 0.1 0.1 0.1 0.1 0.1 0.1 0.1 0.1 0.1 0.1 0.2 0.2 0.0
Are you enrolled (or enrolling) as a:
Full-time student 100.0 100.0 100.0 100.0 100.0 100.0 100.0 100.0 100.0 100.0 100.0 100.0 100.0
Part-time student 0.0 0.0 0.0 0.0 0.0 0.0 0.0 0.0 0.0 0.0 0.0 0.0 0.0
How many miles is this college from your permanent home? 5 or less 5.5 6.5 4.4 7.8 4.9 4.3 7.0 4.5 4.5 4.0 5.8 6.4 4.8 6 to 10 7.0 8.0 6.0 9.9 5.5 4.7 9.5 4.4 6.2 5.0 5.8 5.6 6.1 11 to 50 25.6 26.5 24.5 30.8 21.3 17.9 31.0 19.9 25.3 21.5 17.1 17.8 15.7 51 to 100 15.5 16.8 14.2 16.3 17.3 16.5 16.2 18.5 15.6 8.6 17.3 20.6 11.2 101 to 500 29.5 26.4 32.9 23.6 29.7 29.8 23.0 32.9 35.0 24.1 31.1 34.5 24.9 Over 500 16.9 15.9 18.0 11.5 21.2 26.8 13.2 19.8 13.4 36.9 22.8 15.1 37.2
What was your average grade in high school?
A or A+ 25.8 19.4 32.8 15.5 24.2 24.8 21.8 24.8 31.3 38.8 12.4 9.1 18.7 A- 27.0 22.9 31.4 20.7 25.5 27.0 25.7 24.0 31.1 32.4 13.5 11.5 17.2 B+ 21.3 23.4 19.0 24.8 21.6 21.7 24.6 20.1 19.5 16.7 23.4 22.5 25.1 B 17.6 22.1 12.7 25.6 17.8 17.2 18.5 18.0 13.5 9.3 23.1 24.8 19.8 B- 5.1 7.4 2.7 8.4 6.1 5.8 5.6 6.7 2.9 2.0 13.3 15.7 8.6 C+ 2.4 3.7 1.0 3.8 3.5 2.6 2.8 4.6 1.2 0.5 11.2 12.9 7.9 C 0.8 1.1 0.4 1.1 1.2 0.8 0.9 1.6 0.5 0.2 3.0 3.3 2.5 D 0.0 0.0 0.0 0.0 0.1 0.0 0.0 0.1 0.0 0.0 0.1 0.1 0.2
From what kind of high school did you graduate?
Public school (not charter or magnet) 75.8 77.0 74.5 82.3 70.4 69.9 62.9 74.5 78.3 59.0 78.2 83.8 67.5
Public charter school 2.9 3.6 2.2 4.3 2.8 2.6 3.6 2.6 2.4 1.5 6.3 4.8 9.1
Public magnet school 3.5 3.0 4.1 3.3 2.7 3.2 2.4 2.3 4.4 2.8 7.1 6.8 7.7
Private religious/parochial school 10.9 9.8 12.0 6.6 13.8 10.5 22.5 12.8 9.9 20.6 5.3 2.6 10.5 Private independent college-prep school 6.3 5.8 6.9 3.1 9.1 13.2 7.7 5.9 4.7 15.6 2.8 1.8 4.9
2013 CIRP Freshman Survey
Weighted National Norms—All RespondentsBaccalaureate Black Colleges
All Bacc Institutions 4-year Colleges Universities and Universities Institutions 4-yr Coll Universities Public Private Nonsec Catholic Oth Relig Public Private All HBCU Public Private
Prior to this term, have you ever taken courses for credit at this institution?
Yes 5.4 5.5 5.2 5.8 5.2 4.2 6.4 5.5 5.4 4.4 7.9 6.0 11.6
No 94.6 94.5 94.8 94.2 94.8 95.8 93.6 94.5 94.6 95.6 92.1 94.0 88.4
Since leaving high school, have you ever taken courses, whether for credit or not for credit, at any other institution (university, 4- or 2-year college, technical, vocational, or business school)?
Yes 10.8 11.2 10.4 11.4 11.0 10.3 10.3 11.9 10.7 9.1 13.3 11.6 16.5
No 89.2 88.8 89.6 88.6 89.0 89.7 89.7 88.1 89.3 90.9 86.7 88.4 83.5
Where do you plan to live during the fall term?
With my family or other relatives 17.3 19.8 14.5 27.0 11.0 10.3 18.6 7.9 15.4 10.8 9.5 8.1 12.2 Other private home, apartment, or room 2.5 2.0 3.0 2.9 0.9 1.1 1.1 0.7 3.6 0.6 2.4 2.5 2.1 College residence hall 76.9 74.9 79.0 65.7 86.4 86.6 79.3 89.8 77.0 87.4 85.3 86.2 83.7
Fraternity or sorority house 0.6 0.2 1.0 0.1 0.3 0.7 0.0 0.0 1.2 0.0 0.1 0.1 0.1
Other campus student housing 2.4 2.7 2.1 3.8 1.2 1.2 0.9 1.4 2.4 1.0 2.3 2.7 1.7
Other 0.3 0.3 0.3 0.4 0.2 0.1 0.1 0.2 0.3 0.1 0.4 0.5 0.3
To how many colleges other than this one did you apply for admission this year?
None 10.9 11.6 10.3 12.1 10.9 10.2 8.8 12.6 11.6 4.6 8.0 8.6 6.9 1 8.4 8.6 8.1 9.1 8.1 6.7 6.3 10.3 9.3 3.3 6.5 6.6 6.1 2 11.3 11.7 11.0 12.2 11.0 9.0 9.0 13.9 12.4 5.1 11.9 12.4 10.8 3 14.4 15.4 13.4 16.0 14.5 12.2 13.2 17.4 14.6 8.4 17.6 18.2 16.5 4 12.9 14.1 11.6 14.7 13.3 12.5 12.4 14.6 12.0 10.0 16.3 17.7 13.5 5 10.5 10.9 10.0 10.7 11.2 11.6 12.1 10.4 9.8 10.9 12.6 12.3 13.0 6 8.0 7.8 8.2 7.6 8.0 8.9 9.7 6.4 7.6 10.9 8.5 8.0 9.5 7 to 10 17.7 15.2 20.4 14.1 16.7 20.6 21.0 10.8 17.5 32.1 12.0 10.3 15.3 11 or more 5.9 4.7 7.0 3.5 6.3 8.4 7.5 3.7 5.2 14.6 6.6 5.7 8.4
Were you accepted by your first choice college?
Yes 75.6 78.4 72.4 77.0 80.2 76.9 78.9 84.1 74.2 65.4 75.6 74.4 78.1
No 24.4 21.6 27.6 23.0 19.8 23.1 21.1 15.9 25.8 34.6 24.4 25.6 21.9
Is this college your:
First choice 56.9 57.3 56.5 55.5 59.5 58.2 56.7 62.0 57.2 53.6 38.5 36.4 42.5
Second choice 27.1 27.5 26.6 29.0 25.7 26.5 28.3 23.6 26.3 27.8 31.5 33.6 27.6
Third choice 9.9 9.8 10.1 9.9 9.6 10.0 10.1 9.0 9.8 11.3 16.5 16.8 16.1
Less than third choice 6.1 5.4 6.8 5.5 5.3 5.3 4.9 5.4 6.7 7.3 13.4 13.2 13.8
The current economic situation significantly affected my college choice:
Agree strongly 26.4 27.0 25.7 28.8 24.9 25.2 27.6 23.3 26.6 22.1 28.0 27.4 29.2
Agree somewhat 42.1 43.3 40.8 44.2 42.2 39.9 42.8 44.0 41.5 37.7 39.3 40.7 36.6
Disagree somewhat 18.6 17.9 19.3 16.5 19.6 19.5 18.4 20.4 18.7 21.7 20.7 20.5 21.1
Disagree strongly 13.0 11.8 14.3 10.6 13.3 15.4 11.3 12.3 13.2 18.5 12.0 11.4 13.1
21
2013 CIRP Freshman Survey
Weighted National Norms—All RespondentsBaccalaureate Black Colleges
All Bacc Institutions 4-year Colleges Universities and Universities Institutions 4-yr Coll Universities Public Private Nonsec Catholic Oth Relig Public Private All HBCU Public Private
Citizenship status:
U.S. citizen 95.4 96.0 94.8 96.5 95.4 93.6 96.5 96.6 95.4 92.2 98.2 98.3 98.0
Permanent resident (green card) 2.2 2.0 2.3 2.4 1.5 1.8 1.9 1.0 2.4 2.3 1.0 1.0 0.8
Neither 2.4 2.0 2.9 1.1 3.1 4.6 1.5 2.4 2.3 5.5 0.9 0.7 1.2
Are your parents:
Both alive and living with each other 69.3 65.1 73.8 62.7 68.1 69.3 69.6 66.2 72.5 79.3 33.3 30.3 38.9 Both alive, divorced or living apart 27.2 30.9 23.2 33.2 28.1 26.9 26.4 30.2 24.4 17.9 59.8 62.5 54.7
One or both deceased 3.5 4.0 3.0 4.1 3.8 3.9 4.0 3.6 3.1 2.8 6.9 7.2 6.4
How many AP courses did you take in high school?
Not offered at my high school 6.3 7.3 5.2 5.8 9.0 8.7 6.6 10.4 4.8 6.8 7.8 7.2 9.0
None 21.0 29.7 11.9 32.1 26.7 23.7 27.8 28.9 12.6 9.2 40.0 45.7 29.2
1 to 4 47.6 48.4 46.9 49.1 47.4 46.8 51.3 46.1 48.2 41.3 43.5 40.6 49.0
5 to 9 22.1 13.2 31.5 11.6 15.2 18.6 13.3 12.8 30.3 36.4 7.1 5.1 10.8
10 to 14 2.7 1.2 4.3 1.1 1.4 1.9 0.8 1.3 3.9 5.8 0.9 0.8 1.2
15+ 0.3 0.3 0.3 0.2 0.3 0.3 0.2 0.4 0.2 0.5 0.7 0.7 0.8
How many AP exams did you take in high school?
Not offered at my high school 6.5 7.8 5.1 6.6 9.3 8.6 6.8 11.3 4.9 6.1 8.5 8.0 9.3
None 27.1 37.3 16.4 40.1 33.9 30.1 35.0 37.2 17.4 12.6 48.6 54.9 36.8
1 to 4 44.8 43.5 46.2 43.6 43.3 44.3 46.8 40.6 47.0 42.8 36.9 32.9 44.4
5 to 9 19.1 10.4 28.3 8.9 12.2 15.5 10.7 9.7 27.1 33.4 5.0 3.2 8.5
10 to 14 2.2 0.9 3.7 0.7 1.0 1.4 0.5 0.8 3.4 4.8 0.5 0.6 0.3
15+ 0.2 0.2 0.3 0.1 0.2 0.2 0.1 0.3 0.2 0.4 0.5 0.4 0.6
Please mark which of the following courses you have completed:
Algebra II 98.0 97.4 98.7 97.9 96.7 96.8 97.6 96.2 98.8 98.1 96.0 96.2 95.6
Pre-calculus/Trigonometry 85.1 79.7 90.7 78.7 80.9 84.7 83.8 75.5 89.9 94.0 70.2 66.1 77.2 Probability & Statistics 32.4 30.8 34.0 29.2 32.6 34.4 29.1 32.7 34.0 34.0 25.4 21.6 32.0
Calculus 36.6 27.3 45.8 23.9 31.3 36.7 29.3 27.2 43.9 53.0 18.5 15.1 24.4
AP Probability & Statistics 19.3 13.2 25.4 12.0 14.7 17.0 12.5 13.6 25.0 27.1 8.9 7.1 12.1
AP Calculus 35.9 22.7 48.6 20.3 25.6 31.5 22.6 21.3 47.0 55.1 14.8 11.1 21.0
Have you had any special tutoring or remedial work in any of the following subjects?
English 9.6 11.4 7.7 11.1 11.8 11.3 12.2 12.0 7.6 8.1 18.5 19.0 17.4 Reading 8.3 10.0 6.4 9.6 10.4 9.5 11.1 10.8 6.5 6.4 17.5 17.3 17.7 Mathematics 17.9 20.2 15.4 19.4 21.3 21.8 22.1 20.3 14.7 17.9 22.6 22.4 23.0 Social Studies 6.0 7.4 4.5 7.3 7.6 6.8 8.4 8.0 4.4 4.6 15.0 14.7 15.3 Science 8.4 9.6 7.1 9.0 10.3 10.3 11.4 9.8 6.7 8.6 14.8 14.8 14.9 Foreign Language 7.6 9.0 6.2 8.5 9.6 9.3 10.2 9.7 5.9 7.2 14.5 14.6 14.2 Writing 7.7 9.1 6.2 8.5 9.7 9.4 10.2 9.7 6.0 6.9 15.0 15.1 14.8
Do you feel you will need any special tutoring or remedial work in any of the following subjects?
English 11.3 12.7 9.8 12.9 12.4 12.2 11.6 13.1 10.1 8.6 15.2 16.0 13.6 Reading 6.5 7.3 5.7 7.5 7.1 7.1 7.0 7.2 5.7 5.6 9.5 10.8 7.0 Mathematics 27.2 31.2 22.9 34.0 27.8 26.7 28.0 28.7 23.9 18.6 39.5 41.3 36.0 Social Studies 5.1 5.9 4.3 6.1 5.7 5.2 5.3 6.4 4.4 3.7 12.3 13.6 9.9 Science 15.4 16.5 14.2 16.7 16.4 16.0 17.4 16.3 14.7 12.1 22.5 23.0 21.5 Foreign Language 13.2 16.1 10.2 15.9 16.3 15.1 15.3 17.9 10.2 10.2 29.0 29.7 27.8 Writing 15.1 17.0 13.0 16.8 17.2 17.5 16.6 17.2 13.1 12.9 19.9 21.2 17.5
22
2013 CIRP Freshman Survey
Weighted National Norms—All RespondentsBaccalaureate Black Colleges
All Bacc Institutions 4-year Colleges Universities and Universities Institutions 4-yr Coll Universities Public Private Nonsec Catholic Oth Relig Public Private All HBCU Public Private
Do you consider yourself:
Pre-Med 22.3 19.9 24.8 19.1 20.8 19.0 25.3 20.2 25.6 21.7 33.9 27.5 45.8
Pre-Law 7.0 7.1 7.0 6.9 7.2 8.0 6.6 6.8 6.5 8.8 13.4 14.1 12.1
Your intended major: Arts and Humanities
Art, fine and applied 1.4 1.9 0.9 1.6 2.2 3.5 1.0 1.5 0.9 0.9 0.8 0.9 0.4
English (language and literature) 1.4 1.6 1.3 1.4 1.8 2.1 1.7 1.6 1.2 1.5 0.6 0.4 1.1
History 1.0 1.2 0.7 1.2 1.3 1.3 0.9 1.4 0.7 0.9 0.5 0.5 0.5
Journalism/Communication 2.2 2.1 2.2 2.0 2.3 2.3 2.6 2.2 1.9 3.5 2.4 2.7 1.8
Classical and Modern Languages and Literature 0.3 0.3 0.3 0.2 0.4 0.4 0.2 0.4 0.3 0.3 0.0 0.0 0.0
Media/Film Studies 0.9 1.2 0.7 1.3 0.9 1.1 0.4 1.1 0.5 1.1 0.7 0.4 1.2
Music 1.3 1.5 1.0 1.3 1.7 1.4 0.5 2.6 1.0 1.2 1.4 1.6 1.0
Philosophy 0.2 0.2 0.2 0.1 0.2 0.3 0.2 0.2 0.2 0.3 0.2 0.3 0.1
Theatre/Drama 0.9 1.1 0.7 1.0 1.2 1.6 0.3 1.3 0.6 1.1 0.5 0.6 0.4
Theology/Religion 0.2 0.3 0.2 0.2 0.6 0.2 0.4 1.0 0.1 0.3 0.4 0.3 0.5
Other Arts and Humanities 0.8 1.0 0.7 1.0 0.9 1.0 0.6 1.0 0.6 0.7 0.4 0.4 0.4
Biological & Life Sciences
Biology (general) 7.6 7.1 8.2 6.0 8.4 7.6 10.9 7.9 8.1 8.4 14.1 9.1 23.2
Animal Biology (zoology) 0.7 0.7 0.7 0.6 0.8 1.0 0.4 0.8 0.8 0.2 0.4 0.3 0.6
Ecology & Evolutionary Biology 0.1 0.1 0.2 0.1 0.1 0.1 0.1 0.1 0.2 0.2 0.1 0.1 0.1
Marine Biology 0.8 1.0 0.5 1.3 0.6 0.6 0.1 0.7 0.6 0.2 0.1 0.1 0.1
Microbiology 0.3 0.1 0.4 0.1 0.1 0.1 0.1 0.1 0.5 0.1 0.1 0.1 0.1
Molecular, Cellular, & Developmental Biology 0.6 0.4 0.8 0.5 0.3 0.5 0.3 0.2 0.8 0.7 0.2 0.2 0.2
Neurobiology/Neuroscience 1.2 0.5 1.8 0.2 0.9 1.2 0.7 0.8 1.9 1.7 0.3 0.2 0.4
Plant Biology (botany) 0.1 0.1 0.1 0.1 0.2 0.1 0.3 0.1 0.1 0.1 0.2 0.1 0.4
Agriculture/Natural Resources 0.3 0.3 0.3 0.4 0.3 0.3 0.2 0.4 0.3 0.2 0.7 1.0 0.2
Biochemistry/Biophysics 1.6 1.1 2.1 1.0 1.3 1.4 1.1 1.4 2.2 1.8 0.5 0.4 0.6
Environmental Science 0.6 0.6 0.6 0.4 0.9 1.2 0.4 0.9 0.6 0.6 0.1 0.1 0.2
Other Biological Science 0.8 0.4 1.3 0.4 0.4 0.4 0.3 0.5 1.5 0.5 0.3 0.3 0.4
Business
Accounting 2.3 2.5 2.1 2.5 2.4 2.1 3.2 2.4 2.0 2.3 2.6 3.1 1.7
Business Administration (general) 2.8 3.0 2.6 2.8 3.2 2.5 3.2 3.9 2.4 3.4 3.3 3.4 3.0
Entrepreneurship 0.7 0.6 0.7 0.5 0.7 0.8 0.5 0.7 0.6 1.2 0.8 1.0 0.5
Finance 2.0 1.1 2.9 0.9 1.4 1.6 2.0 0.8 2.3 5.1 0.9 0.7 1.4
Hospitality/Tourism 0.3 0.3 0.3 0.4 0.1 0.1 0.1 0.1 0.4 0.1 0.4 0.5 0.1
Human Resources Management 0.1 0.1 0.1 0.2 0.1 0.1 0.1 0.2 0.2 0.1 0.2 0.3 0.0
International Business 0.9 0.9 0.9 0.7 1.1 1.5 1.0 0.9 0.8 1.4 0.2 0.3 0.1
Marketing 2.2 2.0 2.5 2.0 1.8 1.7 2.7 1.5 2.5 2.8 1.4 1.2 1.7
Management 2.0 2.4 1.6 2.5 2.3 2.1 2.7 2.3 1.5 1.7 2.6 3.0 1.7
Computer/Management Information Systems 0.3 0.3 0.3 0.3 0.4 0.3 0.4 0.5 0.3 0.1 0.2 0.4 0.0
Real Estate 0.1 0.1 0.1 0.1 0.1 0.1 0.1 0.1 0.1 0.1 0.1 0.2 0.1 Other Business 0.8 0.7 0.9 0.5 0.9 0.8 0.6 1.1 0.9 0.8 0.4 0.6 0.1 Education Elementary Education 2.0 2.9 1.0 2.9 2.9 2.0 2.6 3.8 1.0 0.9 2.5 2.4 2.7 Music/Art Education 0.6 0.8 0.3 0.8 0.7 0.6 0.3 1.0 0.4 0.2 0.8 1.1 0.3 Physical Education/Recreation 0.5 0.7 0.2 0.8 0.6 0.2 0.3 1.2 0.2 0.1 1.9 2.8 0.3 Secondary Education 1.0 1.1 0.8 0.9 1.4 0.9 1.3 1.8 0.8 0.6 0.9 1.0 0.6 Special Education 0.7 0.9 0.4 0.9 1.0 0.8 1.0 1.1 0.4 0.4 0.7 0.9 0.4 Other Education 0.4 0.5 0.2 0.6 0.3 0.2 0.3 0.4 0.3 0.1 0.4 0.4 0.3