Research Article
Analysis of Perceived Value and Travelers’ Behavioral Intention to
Adopt Ride-Hailing Services: Case of Nanjing, China
Ke Lu
and Xuefen Wang
School of Management Science and Engineering, Nanjing University of Information Science & Technology, Nanjing 210044, China
Correspondence should be addressed to Ke Lu; k.lu1@outlook.com
Received 19 February 2020; Revised 22 April 2020; Accepted 15 May 2020; Published 30 May 2020 Academic Editor: Wenqing Wu
Copyright © 2020 Ke Lu and Xuefen Wang. This is an open access article distributed under the Creative Commons Attribution License, which permits unrestricted use, distribution, and reproduction in any medium, provided the original work is properly cited.
This study explored travelers’ behavioral intention to adopt ride-hailing services. With regard to perceived value, several factors related to perceived benefit and perceived sacrifice were considered. Moreover, subjective norm and perceived policy support were further introduced into the concept model. After the construction of the concept model, an empirical analysis was put forward to test the hypotheses proposed. In addition, the effect of sociodemographic factors and usage frequency was further investigated. The empirical analysis was based on a survey that put forward in Nanjing, China. The results demonstrate that perceived value is positively related to behavioral intention. And factors of perceived benefit are related to perceived value positively, while factors of perceived sacrifice have a negative effect on perceived value.
1. Introduction
In 2017, DiDi announced that its number of orders is 7.43 billion, which shown that ride-hailing services have been one of the most important travel modes in China. The popularity of ride-hailing services is based on the rapid development of mobile Internet technology. What is more, ride-hailing services also related to the development of vehicle tech-nology and energy consumption [1, 2]. Ride-hailing plat-forms have provided new travel options to urban residents, and the role in urban transport is becoming more and more critical [3, 4]. In China, the new travel options that ride-hailing platforms offer include fast-ride, tailored-ride, and carpool [5]. Among them, fast-ride is cheaper and the quality or brand of car is standard. As for tailored-ride, the quality or brand of car is better and the price is higher. For carpool, the quality or brand of car is similar to fast-ride, but the price level is cheaper than fast-ride. Moreover, the target con-sumers of these travel options vary a lot. For fast-ride, the target consumers are typical travelers who pursue similar travel experience as a taxi. And the target consumers of tailored-ride mainly are business travelers. The target
consumers of carpool are travelers who willing to share a car with others. Similarly, Uber has also provided differentiated options that targeted on different traveler’s groups, such as UberX, UberBlack, and UberVan.
People’s travel behavior is gradually changing with the promotion of such new travel options facilitated by ride-hailing platforms. In assessing the potential of ride-ride-hailing services for these travelers, behavioral intention toward ride-hailing provides a vital direction [6, 7]. What is more, methods of behavioral intention analysis have been intro-duced into the study of transportation services [8, 9]. And such purposes indicate future behavior and adoption rates of hailing services. Also, it will be helpful for both ride-hailing platforms and government or transportation man-agement organizations to understand travelers’ behavioral intention of using hailing services. For example, ride-hailing platforms may provide better service and yield more profit, while government or transportation management organizations can put forward more effective policies.
Most studies to date have focused on travelers’ intention to adopt ride-hailing based on factors such as price, safety, convenience, and access, which have a significant effect on
Volume 2020, Article ID 4380610, 13 pages https://doi.org/10.1155/2020/4380610
the travelers’ choice behavior [3, 10–12]. What is more, feelings related to travel plays an important role on the adoption of specific travel services [13]. In addition, more specific factors have been investigated as well, for example, social norm [14], environmental concern [15], performance and effort expectancy on ride-hailing services [16], and trust [17]. Besides, social influence has a direct effect on users’ behavioral intention [18]. It shows that behavior of ride-hailing travelers was studied with the consideration of various factors. However, to our best knowledge, little re-search has been done from viewpoint of perceived value and the attention of social influence and perceived policy support can be strengthened.
Unlike current studies, this research is mainly studied based on the research of perceived value to reflect travelers’ behavior more accurately. The definition of perceived value is “consumer’s overall assessment of the utility of a product based on the perception of what is received and what it is given” [19]. Perceived value mainly focuses on people’s judgment on a specific product or service especially from the aspects of benefit and sacrifice, which has shown to be an effective method in the research of consumer behavior. Since perceived benefit and perceived sacrifice can embody travelers’ perceived value comprehensively, it can be helpful to understand travelers’ intention to adopt ride-hailing services by considering it from two aspects, i.e., perceived benefit and perceived sacrifice. Hence, it is important to study travelers’ behavior intention of ride-hailing services based on perceived value. Further, the effect of social in-fluence and perceived policy support can be considered more comprehensively. As a result of the rapid growth of social media in recent days, people are easier to be influenced by social factors than before. And their perception of policy support toward ride-hailing also plays a vital role in trav-eler’s decision behavior. Moreover, the policy support dis-cussed in this study is the measure taken by the government that intends to improve the development of ride-hailing industry. For example, in 2016, the Chinese government has promoted several policies to build healthier ride-hailing market and provide better services for travelers. Therefore, it is necessary to consider factors of social influence and perceived policy support into the study of ride-hailing.
This research aims to examine travelers’ behavioral in-tention of ride-hailing services. (1) What is the effect of perceived value on the travelers’ behavioral intention? (2) What are the factors included in perceived benefit or per-ceived sacrifice and their relationship with perper-ceived value? (3) What is the relationship between social factors and perceived value, travelers’ behavioral intention? (4) What is the effect of perceived policy support on travelers’ behavioral intention?
The paper is organized as follows. The literature review is presented in the second section. In Section 3, the re-search model is constructed and hypotheses are proposed. Then data and research methods are described in Section 4. In Section 5, the empirical results are presented. Then, the discussion is put forward in Section 6. Finally, con-clusion and future research directions are discussed in Section 7.
2. Literature Review
The literature related to this paper mainly consists of two parts, i.e., (1) behavior of ride-hailing travelers and (2) perceived value and behavioral intention.
2.1. Behavioral Intention of Ride-Hailing Services. With the expansion of ride-hailing services, the travel behavior of urban residents has changed. Currently, issues of ride-hailing services have been discussed in kinds of literature. Among them, travelers’ behavioral intention of ride-hailing services was studied.
The effect of sociodemographic characteristic and atti-tude of ride-hailing users were explored. By referring to current research, the users tend to be younger, well-edu-cated, and do not own a vehicle [3, 10–12]. Since ride-hailing is a new emerging service, some travelers may still not fa-miliar and even not ever used them. Based on a survey of 15 metropolitan statistical areas in the United States, Dawes [10] showed that 28% of the respondents have never used Uber and the attitude toward ride-hailing services varies a lot among different groups. Nielsen [20] investigated users’ negative and positive perceptions of ridesharing. Among them, availability, safety, and social awkwardness are neg-ative perceptions, and positive perceptions include cost saving, flexibility, and social demand fulfillment. What is more, existing literature shows that both sociodemographic factors and attitudinal factors are also essential in the adoption of ride-hailing services.
The reasons for the adoption of ride-hailing services can further be illustrated from different sides. From the side of travel itself, less cost, shorter waiting time, parking problem, and car ownership are account for the adoption behavior [3, 12, 21]. From the side of nontravel reasons, avoid driving under the influence of alcohol may be one of the top reasons for ride-hailing adoption [3, 12]. Moreover, factors of en-vironmental protection, energy consumption, and habit also contribute to the adoption of ride-hailing services [15, 16]. For example, travelers’ acceptance of ride-hailing services is positively related to their habit [16].
The effect of latent variables was examined. Typically, it has shown that perceived ease of use and perceived use-fulness related to behavioral intention or adoption of ride-hailing services positively [14, 17, 22]. But the effect of subjective norm varies in different research. In most re-search, the impact of subjective norm or social factors on consumers’ behavioral intention is positive, which means usage behavior or positive opinion of friends, colleagues, and family members may increase consumers’ behavioral in-tention [14, 16]. However, Septiani et al. [17] found that subjective norm plays a negative role in behavioral intention. Nevertheless, both results showed that people’s behavior is influenced by social factors significantly and has been a critical factor of the study on consumer behavior.
As for the research methods in the current study, the model was built based on the combination of different theories to examine the relationship between behavioral intention of ride-hailing services and particular variables
[14, 16, 17, 21, 22]. For example, technology acceptance model, theory of planned behavior, diffusion of innovation theory, and unified theory of acceptance and use of tech-nology 2. In these studies, the structural equation model and regression models were constructed and several latent variables were considered. In Table 1, the theory and vari-ables in current studies are summarized.
In more detailed level, the research theories are intro-duced to reflect features of ride-hailing services from specific aspect. Ride-hailing is a new travel service based on ad-vanced mobile Internet technology, which means the technology acceptance model or unified theory of accep-tance and use of technology 2 can be considered to study travelers’ adoption behavior. And it has shown that TAM and UTAUT2 are effective tools to explain ride-hailing adoption behavior [14, 17, 23, 24]. Further, travelers’ adoption behavior of ride-hailing services may change as there are many other transportation modes, and hence the theory of planned behavior could be introduced [17]. Comparing with traditional travel modes, ride-hailing ser-vices are innovative modes, for example, advanced match technology and new economic style. Then, travelers’ adoption behavior can be explained by diffusion of inno-vation theory as well. In summary, the theories considered in extant research are different and each of them focused on specific aspect of ride-hailing service adoption behavior.
Based on several theories of consumer behavior, trav-elers’ behavioral intention on the adoption of ride-hailing services was studied. Then, the effect of factors related to travelers’ behavior can be further investigated. Also, most of the factors considered in existing literature are the positive side of ride-hailing usage. To avoid this shortage, Wang et al. [23] extended technology acceptance model by introducing perceived risk to represent the negative aspect of ride-hailing services. However, in most studies, the negative effect of ride-hailing services was neglected.
2.2. Perceived Value and Behavioral Intention. It has added value to study travelers’ behavioral intention of ride-hailing services with view of perceived value. The concept of per-ceived value has been introduced into plenty of research to reveal the mechanism of consumers’ decision behavior. As mentioned above, a widely cited and more general definition was given by Zeithaml [19] from gain and loss. Generally, the study of perceived value is intended to explain the idea behind these factors and form a theoretical viewpoint.
The model construction of perceived value is the foundation for further research. In the current study, it can be concluded that perceived value contains various factors. And such factors can mainly be classified into the instru-mental function, self-emotional function, and social func-tion [25–27]. Based on the classificafunc-tion of perceived value, hypotheses on the relationship between perceived value and behavioral intention are carried out. And the utilitarian effect, hedonic effect, and social effect of perceived value are further examined.
In summary, consideration of dimensions in extant research can embody perceived value in a more detailed
level, but the perceived value was mainly studied from positive side through this method. This may lead to the problem that some features of perceived value remain un-explored, and then factors which consumer cares and the process of decision-making may not be described well enough. To avoid this drawback, perceived value can further be studied from view of perceived benefit and perceived sacrifice. Then, the positive effect and negative effect of perceived value are introduced and their relationship with behavioral intention is further assumed [28–30].
Based on the construction of perceived value, the effect of perceived value on behavioral intention can be examined. Generally, perceived value has positive effect on behavioral intention, and this conclusion has been verified in different industries, for example, wearable device [29], mobile In-ternet technology [26, 28], tourism [25], shopping mall [27], and green products [30]. As for perceived benefit and perceived sacrifice, it can be concluded from extant studies that perceived benefit is positively related to perceived value and perceived sacrifice is negatively related to perceived value [28–30].
3. Research Model and Hypotheses
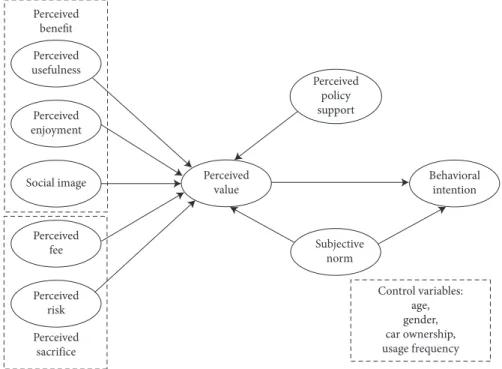
Based on the literature mentioned and characteristics of ride-hailing services, the research model is built as is shown in Figure 1. This concept model is built to investigate the effect of related factors on travelers’ behavioral intention of ride-hailing services adoption. In particular, the perceived value consists of two parts, i.e., perceived benefit and
Table1: Summary of theories.
Theory Key variables Literature
TAM, TPB, DOI
Perceived ease of use
Septiani et al. [17] Perceived usefulness Perceived enjoyment Subjective norm Trust TAM, TPB Perceived usefulness Giang et al. [14] Perceived ease of use
Subjective norm Attitude Perceived behavior control TAM Perceived safety Mohamad et al. [22] Perceived price Perceived convenience Perceived accessibility UTAUT2 Perceived expectancy Chen et al. [16] Effort expectancy Social influence Facilitating conditions Hedonic motivation Price value Habit Extended TAM
Perceived ease of use
Wang et al. [23] Perceived usefulness
Perceived risk Personal innovativeness Environmental awareness
perceived sacrifice. Moreover, perceived policy support and social norm are considered in this model as well. Besides, four control variables are further introduced, i.e., age, gender, car ownership, and usage frequency of ride-hailing services.
3.1. Perceived Value and Behavioral Intention. According to the definition of perceived value, travelers will evaluate both sides to form their behavioral intention to adopt ride-hailing services. Their perceived value is positive when evaluation value of the benefit is more excellent than sacrifice, and then the behavioral intention may form. As a result, travelers will choose whether to use ride-hailing services. Extant research has shown perceived value has a positive effect on behavioral intention [28, 29]. Therefore, the hypothesis can be depicted as follows.
H1. The perceived value of ride-hailing services will positively affect travelers’ behavioral intention.
3.2. Perceived Benefit. According to extant research, the factors related to a customer’s behavioral intention mainly consist of utilitarian, hedonic, and social effects. Utilitarian effect is the basic function the product or service provides. Also, hedonic effect is an internal effect which can reflect a customer’s self-emotion or enjoyment. What is more, ex-ternal factors may stem from the social network that cus-tomers belong, i.e., social effect. In this paper, perceived benefit is constituted by perceived usefulness, perceived enjoyment, and social image.
3.2.1. Perceived Usefulness. Perceived usefulness is defined as “the extent to which a person believes that using one specific product or service will enhance his or her job
performance” [31]. Perceived usefulness has been intro-duced into many research studies that focus on IT or new product adoption. Venkatesh and Bala [32] found that perceived usefulness has a strong and positive effect. However, in most research, it implies that perceived use-fulness has an indirect and positive impact on behavioral intention [28, 29, 33].
The usefulness or utilitarian effect is the primary func-tion of ride-hailing services, and travelers’ original purpose of adopting ride-hailing services is to fulfill their travel demands. If travelers can get better travel experience from ride-hailing services, they may tend to have a better per-ception of such services [14]. In this paper, perceived use-fulness is defined as the extent to which an individual believes using ride-hailing services will enhance his or her travel quality or even job performance. The usefulness can be specified as shorter waiting time, faster way to the desti-nation, and lower cost [3]. Then, the hypothesis is proposed.
H2.The perceived usefulness of ride-hailing services will positively affect travelers’ perceived value.
3.2.2. Perceived Enjoyment. Besides fundamental functions, the feeling or enjoyment consumers experienced also plays a vital role in the evaluation of product or service. Perceived enjoyment is defined as suggested by Venkatesh and Davis [34]. And the effect of this factor has been examined, which indicates that perceived enjoyment has a positive effect on perceived value [28, 29, 35].
This paper defines perceived enjoyment as the extent to which the adoption of ride-hailing services is enjoyable aside any other performance. Ride-hailing can be more com-fortable and independent besides of utilitarian functions [20, 36]. What is more, Septiani et al. [17] found that
Perceived benefit Perceived usefulness Perceived enjoyment Perceived fee Perceived risk Perceived sacrifice Social image Perceived policy support Perceived value Behavioral intention Subjective norm Control variables: age, gender, car ownership, usage frequency
perceived enjoyment is one of the main factors that influence travelers’ behavior. Therefore, the hypothesis can be de-scribed as follows.
H3.The perceived enjoyment of ride-hailing services will positively affect travelers’ perceived value.
3.2.3. Social Image. Social image is defined as “the degree to which an individual perceives that use of innovation will enhance his or her status in his or her system” [37]. From many related pieces of research studies, it has shown that social image is a vital factor to consumers’ decision behavior [38–42]. Nowadays, individuals tend to have more social interactions with their social network members. Moreover, the role of social image is further strengthened, especially on the behavioral intention of new emerged services.
In this paper, social image is the extent to which an individual thinks the adoption of ride-hailing services will enhance his or her social status. Social image has also been considered as one of the most important reasons for ride-hailing service adoption [10]. Sweeney and Soutar [43] identified the effect of social value (enhancement of social self-concept) on consumers’ perceived value. Yang et al. [29] found that social image related to perceived value positively. Therefore, the hypothesis can be proposed as follows.
H4.The social image of ride-hailing services will posi-tively affect travelers’ perceived value.
3.3. Perceived Sacrifice. Perceived sacrifice includes not only monetary factors but also nonmonetary factors. On the monetary aspect, travelers need to pay a fee to have access to ride-hailing services, and their perception of the fee may vary with preference heterogeneity. On the nonmonetary aspect, there may be some potential risk of using ride-hailing services, such as accessibility risk, performance risk, and safety risk.
3.3.1. Perceived Fee. Travelers need to pay money to use ride-hailing services. The price charged by ride-hailing platforms includes two main forms, i.e., transaction fee and registration fee. On the context of ride-hailing services, perceived fee can be defined as the extent to which individual perceived on the fee he or she needs to pay for ride-hailing services. Besides, perceived fee can be studied as the monetary aspect of perceived sacrifice.
In many surveys, price or cost has been one of the most frequently mentioned factors [3, 12, 44]. It showed that travelers tend to make more travels using ride-hailing ser-vices if the price or cost is lower. Moreover, the relationship between perceived fee and perceived value has been ex-amined in many research studies. It has been proposed that perceived fee has a negative effect on perceived value [28, 35, 45]. Therefore, the hypothesis can be proposed as follows.
H5.The perceived fee of ride-hailing services will affect travelers’ perceived value negatively.
3.3.2. Perceived Risk. Accompany with adoption of ride-hailing services, travelers may experience risk related to such new transportation modes. Dowling and Staelin [46] defined perceived risk as customers’ perception of uncertainty and adverse outcome of using the product or service. Moreover, perceived risk can be represented by various factors, such as risk being cheated, safety risk, social risk, and privacy risk [29, 35, 47, 48].
In the survey by Dawes [10], safety risk and performance risk (inconvenience, slow) are the main reasons against choosing ride-hailing services. Similarly, safety and per-formance were included in the research of Rayle et al. [3]. Moreover, availability, awkwardness, and social exclusion were considered as the negative reasons for nonadoption of ride-hailing services [20]. In this paper, the perceived risk of ride-hailing services consists of accessibility risk, perfor-mance risk, and safety risk. Therefore, the hypothesis can be given as follows.
H6. The perceived risk of ride-hailing services will negatively affect travelers’ perceived value.
3.4. Subjective Norm. According to social influence theory, the process of people’s attitude or behavioral change can be classified into three parts, i.e., compliance, identification, and internalization [38]. In the process of compliance, people’s behavior will be affected by other members who belong to his or her social network. Usually, people have a demand to achieve a favorable reaction from others and suffer the pressure from his or her social network. This effect is also called subjective norm. Subjective norm is defined from the aspects of an individual’s social network [34, 49]. The factor of subjective norm was considered in many research studies of consumer behavior. However, indirect effect of subjective norm has been rarely examined. This paper defines subjective norm as the extent to which a traveler perceived that most people who are important to him or her think he or she should or should not use ride-hailing services. Further, one of the reasons for ride-ride-hailing service adoption is “my friends do it” [10]. On the one hand, the members of social network can influence the traveler’s behavioral intention directly [32, 50, 51]. On another hand, the traveler’s behavioral intention may be affected by sub-jective norm through perceived value indirectly. Therefore, two hypotheses can be given as follows.
H7. The subjective norm of ride-hailing services will positively affect travelers’ perceived value.
H8. The subjective norm of ride-hailing services will positively affect travelers’ behavioral intention.
3.5. Perceived Policy Support. As a new emerged trans-portation service, ride-hailing platforms have provided several cheaper and more convenient travel options to urban residents. But it has also generated some new problems worldwide, and then some political measures were put forward by governments [52–54]. However, little literature has studied the influence of perceived policy support on travelers’ behavioral intention to adopt ride-hailing services.
According to a survey in the United States, it indicates that a significant proportion of urban residents hold the opinion that the government should regulate and form a partnership with Uber or Lyft [10]. If the government put forward policies to regulate the current ride-hailing market, then the price level may be more stable and fairer. In ad-dition, more qualified drivers can provide better services if policies are taken. Finally, more travelers tend to adopt ride-hailing services. Therefore, the hypothesis can be described as follows.
H9.The perceived policy support of ride-hailing services will positively affect travelers’ perceived value.
4. Data and Method
4.1. Data Collection. A survey was held from October to November 2017 in Nanjing City, China. Nanjing is a city located in the east of China and also the capital of Jiangsu Province. As one of the main cities in China, Nanjing has a square area of 6,587 km2 and 8.27 million residents. The methods of stated preference surveys were applied into this study, which has shown an effective tool on study of emerging services [55]. The targeted respondents in this survey are the residents who live in Nanjing. Then, an online survey was designed for data collection. Moreover, a fraction of the data was collected offline to attract more respondents. With the development of Internet technology, online survey approach has become a popular method for data collection primarily when the product or service is operated based on Internet. In addition, current research has shown that the quality of online survey is similar to the offline survey [35, 56].
The survey includes sociodemographic information, daily travel information, and behavioral intention to adopt ride-hailing services. The items of the questionnaire were designed in English first and then be translated into the Chinese version. The questionnaires written in English and Chinese were compared and revised by authors and qualified translators. After then, the online survey was put forward and distributed through online forum and social media, for instance, WeChat, Weibo, QQ, etc. To attract more re-spondents, a bonus of 10 yuan with a probability of 20 percent was offered. Although most of the data were col-lected through an online method, part of data was also collected offline in the university campus and railway sta-tions. Overall, a total of 503 samples are retained. Among them, 414 samples are valid for further analysis.
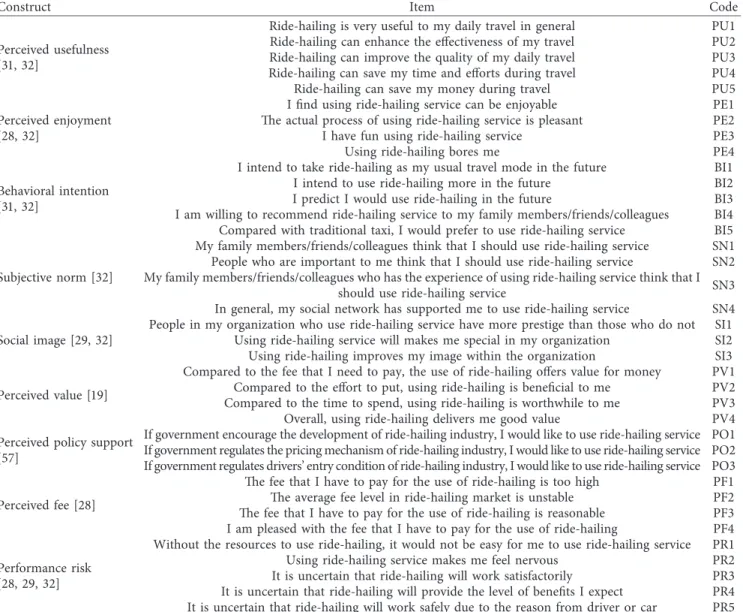
The detail information of items is presented in Table 2. The data were collected with a Likert 5-point scale that ranges from fully disagree (1) to fully agree (5).
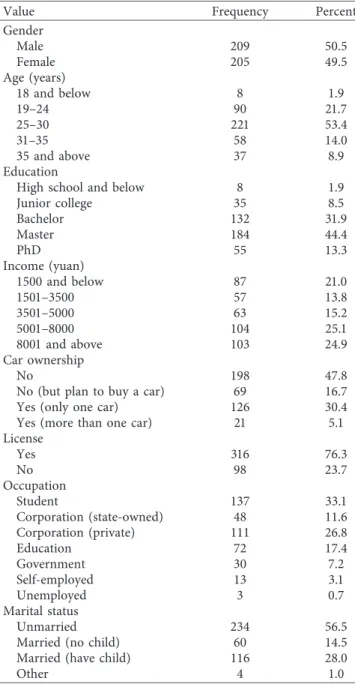
4.2. Descriptive Analysis. Detailed information of descriptive statistics for sociodemographic characteristics of 414 valid respondents is listed in Table 3. Among the valid samples, 50.5% are men and 49.5% are women. Also, the slight skew toward male reflects the actual gender distribution in Nanjing. As for age distribution, the dominant part is 25–30 years old and the proportion is 53.4%. As regard to
education, more than 57.7% have higher education expe-rience. Approximately 63% of the respondents do not have a car, but the proportion of the group that plans to buy a car is 16.7%. Notably, 56.5% of the sample is unmarried. On the view of income, the sample is divided into five groups, viz. 1500 yuan and below (21.0%), 1501–3500 yuan (13.8%), 3501–5000 yuan (15.2%), 5001–8000 yuan (25.1%), and 8001 and above (24.9%).
5. Empirical Results
5.1. Reliability and Validity of Measurements. According to results, items of PE4, PF1, PF2, and PR1 were deleted. Then, the means, factor loading, reliability, and validity of all items are summarized in Table 4. To test reliability, Cronbach’sα
was conducted for given data. Then, the Kaiser-Meyer-Olkin (KMO) test and Bartlett’s test were conducted to test the validity of related measurements. Moreover, factor loading and mean of each item were also examined.
In Table 4, the scales of Cronbach’sαrange from 0.806 to 0.927, and the total scale is 0.920, which significantly exceeds the threshold of 0.7 that is set for further analysis [58]. The KMO value of all items surpasses 0.5, which indicates that the sample data have a good validity [59]. In addition, combining with the factor loading value and significant results of Bartlett’s test, it also established the convergent validity of the sample data [60].
5.2. Hypothesis Test. To examine the effect of control vari-ables, age, gender, car ownership, and usage frequency of ride-hailing services are introduced and coded as dummy variables, as shown in Table 5.
The confirmatory factor analysis was performed based on the Amos 23 software, and results are presented in Table 6 and Figure 2. Before results analysis, the goodness of model fit should be examined first. The fit indices include absolute indices (chi-square, GFI, AGFI, RMSEA, and NCP), in-cremental indices (NFI, RFI, IFI, TLI and CFI), and par-simonious fit indices (PGFI, PNFI, and Chisq/df ). According to the most frequently reported indices that summarized by Zainudin [61], the indices of Chisq/df, RMSEA, GFI, PGFI, IFI, and CFI are introduced. The in-dices’ value of theoretical framework indicates that fitness of basic model is acceptable, and the results in Table 6 and Figure 2 can further be analyzed (Chisq/df�2.696, GFI�0.822, PGFI�0.693, IFI�0.905, CFI�0.905, PCFI�0.806, RMSEA�0.064).
Regarding the empirical results, most of the relationships hypothesized are supported except for perceived risk and perceived value (−0.017 NS). As shown in Table 6 and Figure 2, perceived value has a positive effect on behavioral intention significantly (0.487∗∗∗). Perceived usefulness,
perceived enjoyment, and social image all show a positive effect on perceived value. In addition, the effect of perceived usefulness (0.272∗∗∗) and social image (0.202∗∗∗) on per-ceived value is slightly stronger than perper-ceived enjoyment (0.120∗). As for perceived sacrifice, perceived fee has a
while perceived risk has no significant effect (−0.017 NS). As one of the most critical factors, perceived policy support of ride-hailing is positively related to perceived value (0.545∗∗∗). Further, it is clear that subjective norm has a
positive effect on both perceived value (0.184∗∗) and
be-havioral intention (0.599∗∗∗) significantly. Overall, from the
results of SEM analysis, H1, H2, H3, H4, H5, H7, H8, and H9 are supported, while H6 is not supported.
To further investigate the moderate effect of control variables, the effect of age, gender, car ownership, and usage frequency of ride-hailing services was examined. However, most of the relationship between control variables and perceived value, and behavioral intention, is insignificant except for the effect of usage frequency of ride-hailing services on behavioral intention (0.098∗∗). This result im-plies that travelers’ perceived value and behavioral intention will not be influenced by age or gender significantly. As regard of car ownership, its impact on perceived value and behavioral intention is insignificant. Further, although the relationship between usage frequency and perceived value is
insignificant, but the significant effect of usage frequency of ride-hailing services on behavioral intention indicates that the usage frequency has an influence on travelers’ behavioral intention significantly.
The indirect, direct, and cumulative effects are further examined, as presented in Table 7.
First, it is clear that both perceived benefit and per-ceived sacrifice can affect travelers’ behavioral intention to adopt ride-hailing services indirectly. Among factors of perceived value, the strength of perceived usefulness, social image, and perceived fee are relatively stronger. Second, based on perceived benefit and perceived sacrifice, per-ceived value has a strong and direct effect on behavioral intention. Further, perceived policy support of ride-hailing has an indirect effect on behavioral intention. As for subjective norm, it affects travelers’ behavioral intention of ride-hailing services both indirectly and directly. By the comparison between indirect and direct effect of subjective norm, it indicates that direct effect is much stronger than indirect effect.
Table2: Appendix: list of items.
Construct Item Code
Perceived usefulness [31, 32]
Ride-hailing is very useful to my daily travel in general PU1
Ride-hailing can enhance the effectiveness of my travel PU2
Ride-hailing can improve the quality of my daily travel PU3
Ride-hailing can save my time and efforts during travel PU4
Ride-hailing can save my money during travel PU5
Perceived enjoyment [28, 32]
I find using ride-hailing service can be enjoyable PE1
The actual process of using ride-hailing service is pleasant PE2
I have fun using ride-hailing service PE3
Using ride-hailing bores me PE4
Behavioral intention [31, 32]
I intend to take ride-hailing as my usual travel mode in the future BI1
I intend to use ride-hailing more in the future BI2
I predict I would use ride-hailing in the future BI3
I am willing to recommend ride-hailing service to my family members/friends/colleagues BI4 Compared with traditional taxi, I would prefer to use ride-hailing service BI5
Subjective norm [32]
My family members/friends/colleagues think that I should use ride-hailing service SN1 People who are important to me think that I should use ride-hailing service SN2 My family members/friends/colleagues who has the experience of using ride-hailing service think that I
should use ride-hailing service SN3
In general, my social network has supported me to use ride-hailing service SN4
Social image [29, 32]
People in my organization who use ride-hailing service have more prestige than those who do not SI1 Using ride-hailing service will makes me special in my organization SI2 Using ride-hailing improves my image within the organization SI3
Perceived value [19]
Compared to the fee that I need to pay, the use of ride-hailing offers value for money PV1 Compared to the effort to put, using ride-hailing is beneficial to me PV2 Compared to the time to spend, using ride-hailing is worthwhile to me PV3
Overall, using ride-hailing delivers me good value PV4
Perceived policy support [57]
If government encourage the development of ride-hailing industry, I would like to use ride-hailing service PO1 If government regulates the pricing mechanism of ride-hailing industry, I would like to use ride-hailing service PO2 If government regulates drivers’ entry condition of ride-hailing industry, I would like to use ride-hailing service PO3
Perceived fee [28]
The fee that I have to pay for the use of ride-hailing is too high PF1 The average fee level in ride-hailing market is unstable PF2 The fee that I have to pay for the use of ride-hailing is reasonable PF3 I am pleased with the fee that I have to pay for the use of ride-hailing PF4
Performance risk [28, 29, 32]
Without the resources to use ride-hailing, it would not be easy for me to use ride-hailing service PR1
Using ride-hailing service makes me feel nervous PR2
It is uncertain that ride-hailing will work satisfactorily PR3 It is uncertain that ride-hailing will provide the level of benefits I expect PR4 It is uncertain that ride-hailing will work safely due to the reason from driver or car PR5
6. Discussion
This research found that perceived value has a positive and direct effect on travelers’ behavioral intention to adopt ride-hailing services. This result also supports the conclusions in previous studies that focus on customer behavior [28, 29]. Based on consideration of perceived value, the formation of travelers’ behavioral intention can be explained as a se-quential process from a theoretical point. Travelers tend to evaluate and relate factors first and then form the behavioral intention. After then, their decision to adopt or not adopt ride-hailing services is made.
6.1. Perceived Benefit. Perceived benefit consists of perceived usefulness, perceived enjoyment, and social image. From
empirical results, it indicates that all of them have a sig-nificant and positive effect on perceived value. Also, these factors affect travelers’ behavioral intention to adopt ride-hailing services indirectly through perceived value. More-over, these three factors can reflect perceived benefit from functional, hedonic, and social effects. As a new trans-portation service, ride-hailing not only provide cheaper and more convenient travel options but also with features of higher service level, more flexible, and customized travel time and route [62], which can reflect the functional and hedonic effects of ride-hailing services. To some extent, since ride-hailing is a new service and the behavior of early users may be special, travelers’ social image may also be enhanced. Further, the difference between the effects of perceived benefit implies that travelers of ride-hailing services care more about functional effect and social effect than hedonic effect.
6.2. Perceived Sacrifice. Perceived fee and perceived risk were considered from views of monetary and nonmonetary. Based on the empirical results, perceived fee has a negative effect on perceived value. Similar to perceived benefit, perceived fee and perceived risk have an indirect influence on behavioral intention. However, the effect of perceived risk on perceived value is not significant and the effect of perceived fee is much stronger than the effect of perceived risk. This finding indicates that travelers care more on monetary cost than nonmonetary risk, and this result has been verified by Liu et al. [35]. As a result, perceived sacrifice will lead to a lower or even negative evaluation of ride-hailing services.
6.3. Social Effect. In this paper, subjective norm was in-troduced into the concept model. The empirical results indicate that subjective norm has a positive effect on both perceived value and behavioral intention significantly. The result of the direct effect verified many researches of con-sumer behavior that have considered social factors [17, 34, 63]. Moreover, the indirect effect of subjective norm was further examined in this paper. Usually, travelers’ be-havioral intention is affected by the social network to which he or she belongs. As defined above, subjective norm is the extent to which a traveler perceived that most people in his or her social network think he or she should or should not use ride-hailing services. Among travelers’ group, when most members in his or her social network think he or she should or should not use ride-hailing services, the behavioral intention of him or her may change directly. On the other hand, the formation of behavioral intention to adopt ride-hailing services may be affected by others indirectly. On this context, subjective norm can influence travelers’ behavioral intention to adopt ride-hailing services indirectly through perceived value, which means travelers would evaluate the opinion from his or her social network first and then form behavioral intention of ride-hailing services. According to the empirical results in this paper, the direct effect of sub-jective norm is much stronger than the indirect effect.
Table3: Descriptive analysis of sociodemographic information.
Value Frequency Percent
Gender Male 209 50.5 Female 205 49.5 Age (years) 18 and below 8 1.9 19–24 90 21.7 25–30 221 53.4 31–35 58 14.0 35 and above 37 8.9 Education
High school and below 8 1.9
Junior college 35 8.5 Bachelor 132 31.9 Master 184 44.4 PhD 55 13.3 Income (yuan) 1500 and below 87 21.0 1501–3500 57 13.8 3501–5000 63 15.2 5001–8000 104 25.1 8001 and above 103 24.9 Car ownership No 198 47.8
No (but plan to buy a car) 69 16.7
Yes (only one car) 126 30.4
Yes (more than one car) 21 5.1
License Yes 316 76.3 No 98 23.7 Occupation Student 137 33.1 Corporation (state-owned) 48 11.6 Corporation (private) 111 26.8 Education 72 17.4 Government 30 7.2 Self-employed 13 3.1 Unemployed 3 0.7 Marital status Unmarried 234 56.5
Married (no child) 60 14.5
Married (have child) 116 28.0
Table4: Reliability and validity test.
Value Item KMO Bartlett’s test Load Cronbach’sα Mean
Approx. chi-square df Sig.
Perceived usefulness PU1 0.846 1251.673 10 0.000 0.852 0.876 3.74 PU2 0.897 3.90 PU3 0.891 3.78 PU4 0.869 3.89 PU5 0.598 3.22 Perceived enjoyment PE1 0.729 693.783 3 0.000 0.917 0.881 3.50 PE2 0.914 3.67 PE3 0.868 3.42 Behavioral intention BI1 0.830 1034.513 10 0.000 0.794 0.869 2.90 BI2 0.873 3.10 BI3 0.817 3.57 BI4 0.840 3.52 BI5 0.741 3.63 Subjective norm SN1 0.857 1314.681 6 0.000 0.901 0.927 3.18 SN2 0.918 3.20 SN3 0.928 3.30 SN4 0.877 3.44 Social image SI1 0.691 684.058 3 0.000 0.836 0.869 2.94 SI2 0.903 2.67 SI3 0.932 2.65 Perceived value PV1 0.831 941.443 6 0.000 0.783 0.882 3.32 PV2 0.900 3.57 PV3 0.896 3.61 PV4 0.869 3.63
Perceived policy support
PO1 0.728 750.069 3 0.000 0.875 0.891 3.71 PO2 0.930 3.79 PO3 0.914 3.84 Perceived fee PF3PF4 0.500 335.332 3 0.000 0.9340.934 0.855 2.652.66 Perceived risk PR2 0.733 690.295 6 0.000 0.623 0.806 2.58 PR3 0.880 3.00 PR4 0.906 3.00 PR5 0.767 3.19 Total 0.920
Table5: Control variables.
Variables Definition
Gen Male�1
Female�0
Age
18 years and below�1 19–24 years�2 25–30 years�3 31–35 years�4 36 years and more�5
Car
Do not have a car�1
Do not have a car, but plan to buy one�2 Have only one car�3
Have more than one car�4
RHFre
I never do this�1
I do this, but not in the past 30 days�2 I did this 1–3 times in the past 30 days�3
I did this 1 day per week�4 I did this 2 or more times per week�5
Table6: Results of SEM analysis.
Path Standardized regression weights C.R.
PV<---PU 0.272∗∗∗ 4.057 PV<---PE 0.120∗ 1.774 PV<---SI 0.202∗∗∗ 4.513 PV<---PF −0.143∗∗ −3.086 PV<---PR −0.017 −0.471 PV<---SN 0.184∗∗ 3.273 PV<---PO 0.545∗∗∗ 8.591 BI<---PV 0.487∗∗∗ 8.263 BI<---SN 0.599∗∗∗ 8.922 PV<---Gen 0.021 0.635 PV<---Age −0.008 −0.222 PV<---Car 0.029 0.775 PV<---RHFre −0.002 −0.062 BI<---Gen 0.021 0.630 BI<---Age 0.034 0.875 BI<---Car −0.015 −0.381 BI<---RHFre 0.098∗∗ 2.592 ∗p<0.1;∗∗p<0.05; and∗∗∗p<0.001.
6.4. Policy Support. The policy of ride-hailing services has been widely discussed, and the effect of perceived policy support was examined in this paper. From the empirical study, it indicates that perceived policy support related to perceived value positively and has an indirect effect on behavioral intention. This further verified the pivotal role of perceived policy support in travelers’ acceptance of ride-hailing services. In early stage, ride-ride-hailing is a trans-portation service for travelers and most of them may not be familiar with such new travel modes. On the other hand, the legal status is ambiguous in some areas. Then, the price level and quality of drivers or cars vary a lot as a result of a lack of effective policy support. However, if some available mea-sures and policies that intend to construct a better ride-hailing market put forward by the government, then more travelers will adopt such services.
6.5. Sociodemographic Factors. According to the results of sociodemographic factors and usage frequency related to ride-hailing services, age and gender will not affect perceived value and behavioral intention significantly. The insignifi-cance of age and gender also exists in some studies of new emerged services or products [35, 64–66]. As for car ownership, the relationship is not significant. In a survey put forward by Clewlow [12], the adopters of ride-hailing ser-vices tend to have lower vehicle ownership rates than nonadopters of such services. Moreover, Dias et al. [11]
demonstrate that car ownership plays a negative effect on travelers’ underlying propensity of ride-sourcing. Further, previous studies showed that the usage frequency of Uber and Lyft is positively related to travelers’ attitude toward Uber and Lyft [10]. In this study, the significant and positive relationship between usage frequency of ride-hailing services and behavioral intention verifies this result and indicates that if travelers use ride-hailing more frequently, then his or her behavioral intention to adopt ride-hailing services may further be strengthened with a satisfied performance of ride-hailing services.
7. Conclusions
7.1. Main Results. Ride-hailing service is becoming one of the most essential components of urban transportation. Some research studies were accomplished to reveal the regular pattern of consumer behavior related to ride-hailing services. However, little of them have considered both positive and negative aspects of ride-hailing services and the process of travelers’ decision-making. Based on the research on perceived value, this paper analyzed the factors travelers concerned in order to construct a conceptual model. The factors can be classified into perceived benefit and perceived sacrifice. Moreover, factors of social influence and perceived policy support were introduced into this model as well. Based on a survey in Nanjing, China, an empirical analysis was put forward to investigate the relationships between
Perceived usefulness Perceived enjoyment Perceived fee Perceived risk Social image Perceived policy support Perceived value Subjective norm Behavioral intention
Age Gen Car RHFre
0.272 ∗∗∗ 0.202 ∗∗∗ 0.120 ∗ –0.143 ∗∗ –0.017 0.184 ∗∗ 0.545 ∗∗∗ –0.008 0.021 0.029 –0.002 0.487 ∗∗∗ 0.0340.021 –0.015 0.098 ∗∗ 0.599 ∗∗∗
Dotted lines indicate non-significant paths
Figure2: Results of SEM analysis. Note:∗p<0.1;∗∗p<0.05; and∗∗∗p<0.001.
Table7: Indirect effect, direct effect, and total effect.
Path Indirect effect Direct effect Total effect
PO⟶BI 0.265 — 0.265 SN⟶BI 0.090 0.599 0.689 PR⟶BI −0.008 — −0.008 PF⟶BI −0.069 — −0.069 SI⟶BI 0.098 — 0.098 PE⟶BI 0.059 — 0.059 PU⟶BI 0.133 — 0.133 PV⟶BI — 0.487 0.487
related factors and travelers’ behavioral intention to adopt ride-hailing services.
7.2. Limitations and Future Directions. There are still some limitations that should be noted. First, more factors that can reflect the characteristic of perceived value need to be considered. Hence, a more accurate and objective model should be established to reflect the actual behavior of ride-hailing service adoption better. Second, the size of sample data in this paper is still limited, and more surveys in dif-ferent cities could be carried out to investigate the differ-ences in travelers’ adoption behavior of ride-hailing services in different cities or cultural background. Moreover, the differences in car ownership and public transport may be one of the reasons for the adoption of ride-hailing services, and then several surveys with a difference of car ownership and public transport could be put forward. Third, the consideration of policy purposes is still a limitation. In future, research on behavior of ride-hailing travelers can be studied by considering policy purposes.
Data Availability
The data used to support the findings of this study have not been made available because the data also form part of an ongoing study.
Conflicts of Interest
The authors declare no conflicts of interest.
Acknowledgments
This work was jointly supported by research grants from the Philosophy and Social Science Fund of Education Depart-ment of Jiangsu Province (2019SJA0155), the Natural Sci-ence Foundation of the Jiangsu Higher Education Institutions of China (19KJB580015), National Nature Sci-ence Foundation of China (Grant no. 71732003), the Startup Foundation for Introducing Talent of NUIST (Grant no. 2019r021), and China Scholarship Council (Grant no. 201706190073). The authors also would like to thank Prof. Dick Ettema for his kind suggestion.
References
[1] X. Sun, H. Zhang, W. Meng, R. Zhang, K. Li, and T. Peng, “Primary resonance analysis and vibration suppression for the harmonically excited nonlinear suspension system using a pair of symmetric viscoelastic buffers,”Nonlinear Dynamics, vol. 94, no. 2, pp. 1243–1265, 2018.
[2] H. Xiong, X. Zhu, and R. Zhang, “Energy recovery strategy numerical simulation for dual axle drive pure electric vehicle based on motor loss model and big data calculation,” Com-plexity, vol. 2018, Article ID 4071743, 14 pages, 2018. [3] L. Rayle, D. Dai, N. Chan, R. Cervero, and S. Shaheen, “Just a
better taxi? A survey-based comparison of taxis, transit, and ride-sourcing services in San Francisco,” Transport Policy, vol. 45, pp. 168–178, 2016.
[4] X. Wang, M. Dessouky, and F. Ordonez, “A pickup and delivery problem for ridesharing considering congestion,” Transportation Letters, vol. 8, no. 5, pp. 259–269, 2016. [5] J. Y. Chen, “Thrown under the bus and outrunning it! the
logic of DiDi and taxi drivers’ labour and activism in the on-demand economy,” New Media & Society, vol. 9, pp. 1–21, 2017.
[6] I. Ajzen, “From intentions to actions: a theory of planned behavior,” in Action-control: From Cognition to Behavior, J. Kuhl and J. Beckmann, Eds., pp. 11–39, Springer, Heidel-berg, Germany, 1985.
[7] I. Ajzen, “The theory of planned behavior,” Organizational Behavior and Human Decision Processes, vol. 50, no. 2, pp. 179–211, 1991.
[8] S.-Y. Chen, “Eco-friendly value or others’ environmental norms? Arguing the environmental using psychology of bike-sharing for the general public,”Transportation Letters, vol. 11, no. 8, pp. 425–435, 2019.
[9] S.-Y. Chen and C.-C. Lu, “Investigating the psychology of green transportation via the green service profit chain,” Transportation Letters, vol. 7, no. 3, pp. 143–153, 2015. [10] M. Dawes, “Perspectives on the ride-sourcing revolution:
surveying individual attitudes toward uber and lyft to inform urban transportation policy making,” Thesis, Massachusetts Institute of Technology, Cambridge, MA, USA, 2016. [11] F. F. Dias, P. S. Lavieri, V. M. Garikapati, S. Astroza,
R. M. Pendyala, and C. R. Bhat, “A behavioral choice model of the use of car-sharing and ride-sourcing services,” Trans-portation, vol. 44, no. 6, pp. 1307–1323, 2017.
[12] R. R. Clewlow and G. S. Mishra, “Disruptive transportation: the adoption, utilization, and impacts of ride-hailing in the United States,” Research Report-UCD-ITS-RR-17-07, Insti-tute of Transportation Studies, University of California, Cambridge, MA, USA, 2017.
[13] T. Gärling, “Travel-related feelings: review, theoretical framework, and numerical experiments,” Transportation Letters, vol. 11, no. 1, pp. 54–62, 2019.
[14] P. T. Giang, P. T. Trang, and V. T. Yen, “An examination of factors influencing the intention to adopt ride-sharing ap-plications: a case study in Vietnam,”Imperial Journal of In-terdisciplinary Research, vol. 3, no. 10, pp. 618–623, 2017. [15] S. Malodia and H. Singla, “A study of carpooling behaviour
using a stated preference web survey in selected cities of India,”Transportation Planning and Technology, vol. 39, no. 5, pp. 538–550, 2016.
[16] Y. Chen, W. Salmanian, and A. Akram, “User acceptance in sharing economy-A study of transportation network com-panies in China,” inProceedings of the 11th Mediterranean Conference on Information Systems, pp. 1–17, Genoa, Italy, 2017.
[17] R. Septiani, P. W. Handayani, and F. Azzahro, “Factors that affecting behavioral intention in online transportation service: case study of GO-JEK,”Procedia Computer Science, vol. 124, pp. 504–512, 2017.
[18] T. Grubljesic, P. S. Coelho, and J. Jaklic, “The shift to socio-organizational drivers of business intelligence and analytics acceptance,”Journal of Organizational and End User Com-puting, vol. 31, no. 2, pp. 37–64, 2019.
[19] V. A. Zeithaml, “Consumer perceptions of price, quality, and value: a means-end model and synthesis of evidence,”Journal of Marketing, vol. 52, no. 3, pp. 2–22, 1988.
[20] J. R. Nielsen, H. Hovmøller, P.-L. Blyth, and B. K. Sovacool, “Of “white crows” and “cash savers”: a qualitative study of travel behavior and perceptions of ridesharing in Denmark,”
Transportation Research Part A: Policy and Practice, vol. 78, pp. 113–123, 2015.
[21] J. G. Neoh, M. Chipulu, and A. Marshall, “What encourages people to carpool? An evaluation of factors with meta-anal-ysis,”Transportation, vol. 44, no. 2, pp. 423–447, 2017. [22] W. Mohamad, A. Fuad, N. Shahib, A. Azmi, S. Kamal, and
D. Abdullah, “A framework of customer’s intention to use Uber service in tourism destination,”International Academic Research Journal of Business and Technology, vol. 2, no. 2, pp. 102–016, 2016.
[23] Y. Wang, S. Wang, J. Wang, J. Wei, and C. Wang, “An empirical study of consumers’ intention to use ride-sharing services: using an extended technology acceptance model,” Transportation, vol. 47, no. 1, pp. 397–415, 2020.
[24] A. M. Al-Momani, M. A. Mahmoud, and M. S. Ahmad, “Factors that influence the acceptance of Internet of things services by customers of telecommunication companies in Jordan,”Journal of Organizational and End User Computing, vol. 30, no. 4, pp. 51–63, 2018.
[25] C.-K. Lee, Y.-S. Yoon, and S.-K. Lee, “Investigating the re-lationships among perceived value, satisfaction, and recom-mendations: the case of the Korean DMZ,” Tourism Management, vol. 28, no. 1, pp. 204–214, 2007.
[26] Y. H. Kim, D. J. Kim, and K. Wachter, “A study of mobile user engagement (MoEN): engagement motivations, perceived value, satisfaction, and continued engagement intention,” Decision Support Systems, vol. 56, pp. 361–370, 2013. [27] M. I. El-Adly and R. Eid, “An empirical study of the
rela-tionship between shopping environment, customer perceived value, satisfaction, and loyalty in the UAE malls context,” Journal of Retailing and Consumer Services, vol. 31, pp. 217– 227, 2016.
[28] H.-W. Kim, H. C. Chan, and S. Gupta, “Value-based adoption of mobile Internet: an empirical investigation,” Decision Support Systems, vol. 43, no. 1, pp. 111–126, 2007.
[29] H. Yang, J. Yu, H. Zo, and M. Choi, “User acceptance of wearable devices: an extended perspective of perceived value,” Telematics and Informatics, vol. 33, no. 2, pp. 256–269, 2016. [30] J. F. Medeiros, J. L. D. Ribeiro, and M. N. Cortimiglia, “In-fluence of perceived value on purchasing decisions of green products in Brazil,”Journal of Cleaner Production, vol. 110, no. 1, pp. 158–169, 2016.
[31] F. D. Davis, R. P. Bagozzi, and P. R. Warshaw, “User ac-ceptance of computer technology: a comparison of two theoretical models,” Management Science, vol. 35, no. 8, pp. 982–1003, 1989.
[32] V. Venkatesh and H. Bala, “Technology acceptance model 3 and a research agenda on interventions,”Decision Sciences, vol. 39, no. 2, pp. 273–315, 2008.
[33] M.-K. Kim, C. Joo, and J.-H. Park, “Investigating the deter-minants of low adoption of tablet PCs in Korean firms: effects of value perception and alternative attractiveness,”Telematics and Informatics, vol. 34, no. 8, pp. 1557–1571, 2017. [34] V. Venkatesh and F. D. Davis, “A theoretical extension of the
technology acceptance model: four longitudinal field studies,” Management Science, vol. 46, no. 2, pp. 186–204, 2000. [35] F. Liu, X. Zhao, P. Y. K. Chau, and Q. Tang, “Roles of
per-ceived value and individual differences in the acceptance of mobile coupon applications,”Internet Research, vol. 25, no. 3, pp. 471–495, 2015.
[36] P. Delhomme and A. Gheorghiu, “Comparing French car-poolers and non-carcar-poolers: which factors contribute the most to carpooling?” Transportation Research Part D: Transport and Environment, vol. 42, pp. 1–15, 2016.
[37] G. C. Moore and I. Benbasat, “Development of an instrument to measure the perceptions of adopting an information technology innovation,”Information Systems Research, vol. 2, no. 3, pp. 192–222, 1991.
[38] H. C. Kelman, “Compliance, identification, and internaliza-tion three processes of attitude change,”Journal of Conflict Resolution, vol. 2, no. 1, pp. 51–60, 1958.
[39] N. Lacetera and M. Macis, “Social image concerns and pro-social behavior: field evidence from a nonlinear incentive scheme,” Journal of Economic Behavior & Organization, vol. 76, no. 2, pp. 225–237, 2010.
[40] N. Gausel and C. W. Leach, “Concern for self-image and social image in the management of moral failure: rethinking shame,”European Journal of Social Psychology, vol. 41, no. 4, pp. 468–478, 2011.
[41] L. Chassin, C. Tetzloff, and M. Hershey, “Self-image and social-image factors in adolescent alcohol use,” Journal of Studies on Alcohol, vol. 46, no. 1, pp. 39–47, 1985.
[42] J. Andreoni and B. D. Bernheim, “Social image and the 50-50 norm: a theoretical and experimental analysis of audience effects,”Econometrica, vol. 77, no. 5, pp. 1607–1636, 2009. [43] J. C. Sweeney and G. N. Soutar, “Consumer perceived value:
the development of a multiple item scale,”Journal of Retailing, vol. 77, no. 2, pp. 203–220, 2001.
[44] S. A. Shaheen, N. D. Chan, and T. Gaynor, “Casual carpooling in the San Francisco bay area: understanding user charac-teristics, behaviors, and motivations,” Transport Policy, vol. 51, pp. 165–173, 2016.
[45] J. L. M. Tam, “Customer satisfaction, service quality and perceived value: an integrative model,”Journal of Marketing Management, vol. 20, no. 7-8, pp. 897–917, 2004.
[46] G. R. Dowling and R. Staelin, “A model of perceived risk and intended risk-handling activity,” Journal of Consumer Re-search, vol. 21, no. 1, pp. 119–134, 1994.
[47] K. Jiang, S. T.-k. Luk, and S. Cardinali, “The role of pre-consumption experience in perceived value of retailer brands: consumers’ experience from emerging markets,”Journal of Business Research, vol. 86, pp. 374–385, 2018.
[48] B. Snoj, A. Pisnik Korda, and D. Mumel, “The relationships among perceived quality, perceived risk and perceived product value,” Journal of Product & Brand Management, vol. 13, no. 3, pp. 156–167, 2004.
[49] M. Fishbein and I. Ajzen, Belief, Attitude, Intention and Behavior: An Introduction to Theory and Research, Addison-Wesley, Reading, MA, USA, 1975.
[50] I. Arpaci, “Understanding and predicting students’ intention to use mobile cloud storage services,”Computers in Human Behavior, vol. 58, pp. 150–157, 2016.
[51] H. Han, “Travelers’ pro-environmental behavior in a green lodging context: converging value-belief-norm theory and the theory of planned behavior,”Tourism Management, vol. 47, pp. 164–177, 2015.
[52] G. Dudley, D. Banister, and T. Schwanen, “The Rise of Uber and regulating the disruptive innovator,” The Political Quarterly, vol. 88, no. 3, pp. 492–499, 2017.
[53] C. Lee, “To Uberize or not to Uberize? Opportunities and challenges in Southeast Asia’s sharing economy,” ISEAS Perspective, vol. 33, pp. 2335–6677, 2016.
[54] B. G. Edelman and D. Geradin, “Efficiencies and regulatory shortcuts: how should we regulate companies like Airbnb and Uber?”Stanford Technology Law Review, vol. 19, pp. 293–328, 2016.
[55] O. Petrik, J. d. A. e. Silva, and F. Moura, “Stated preference surveys in transport demand modeling: disengagement of
respondents,”Transportation Letters, vol. 8, no. 1, pp. 13–25, 2016.
[56] A. Dickinger and M. Kleijnen, “Coupons going wireless: determinants of consumer intentions to redeem mobile coupons,” Journal of Interactive Marketing, vol. 22, no. 3, pp. 302–310, 2008.
[57] P. Ju,A Study on Urban Residents’ Usage Intention of Car-sharing and Evolutionary Analysis of Choice Behavior, Nanjing University, Nanjing, China, 2016.
[58] J. C. Nunnally and I. H. Bernstein, Psychometric Theory, McGraw-Hill, London, UK, 3rd edition, 1994.
[59] S. V. Budaev, “Using principal components and factor analysis in animal behaviour research: caveats and guide-lines,”Ethology, vol. 116, no. 5, pp. 472–480, 2010.
[60] J. C. Anderson and D. W. Gerbing, “Structural equation modeling in practice: a review and recommended two-step approach,”Psychological Bulletin, vol. 103, no. 3, pp. 411–423, 1988.
[61] A. Zainudin, SEM Made Simple, MPWS Rich Publication, Selangor, Malaysia, 2015.
[62] L. Zha, Y. Yin, and Y. Du, “Surge pricing and labor supply in the ride-sourcing market,”Transportation Research Procedia, vol. 23, pp. 2–21, 2017.
[63] S.-Y. Chen, “Using the sustainable modified TAM and TPB to analyze the effects of perceived green value on loyalty to a public bike system,”Transportation Research Part A: Policy and Practice, vol. 88, pp. 58–72, 2016.
[64] K. M. S. Faqih and M.-I. R. M. Jaradat, “Assessing the moderating effect of gender differences and individualism-collectivism at individual-level on the adoption of mobile commerce technology: TAM3 perspective,” Journal of Re-tailing and Consumer Services, vol. 22, pp. 37–52, 2015. [65] J. K. Ayeh, N. Au, and R. Law, “Predicting the intention to use
consumer-generated media for travel planning,” Tourism Management, vol. 35, pp. 132–143, 2013.
[66] M. Lepp¨aniemi, H. Karjaluoto, and H. Saarij¨arvi, “Customer perceived value, satisfaction, and loyalty: the role of will-ingness to share information,” The International Review of Retail, Distribution and Consumer Research, vol. 27, no. 2, pp. 164–188, 2017.