Using Differentiated Services to Support Internet Telephony
Fugui Wang and Prasant Mohapatra
Department of Computer Science and Engineering Michigan State University
East Lansing, MI 48824
Email: {wangfugu, prasant}@cse.msu.edu Abstract:
Internet Telephony has been deemed as a promising candidate for the next generation telephone system. However, unstable voice quality is the main problem that prevents the Internet Telephone from competing with the traditional circuit switched telephone. Current Internet supports only a best-effort service class, which does not provide any bandwidth or delay guarantee for the voice packets. During congestion, consecutive packets get lost or miss the deadlines, which results in severe degradation in voice quality. In this paper, we introduce the concept of using differentiated service model to solve the problem. First, we propose a class-based model to separate the voice streams from the best-effort traffic. Then we use a selective dropping model to further prevent consecutive packet losses to satisfy the (m, k) firm guarantee [9] requirement, and thereby enhance the voice quality in the Internet telephony services. The model is implemented using the ns simulator [18]. The performance of the proposed technique is evaluated through the simulator and the results justify the validity of using the model for Internet telephony.
1. Introduction
Internet Telephony, which belongs to the class of real-time services in the Internet, is expected to become a leading service class in the Internet. Compared to the traditional circuit switched telephony, it uses much less bandwidth (1/10~1/12) [1], and hence is much cheaper. Also, it is flexible since it can use the computer to provide other services, such as videoconferencing at little additional hardware cost. Moreover, combining the telephone services with the packet network will simplify the physical network.
Unstable voice quality is one of the main problems that prevent the Internet telephony from competing with the traditional circuit-switched telephone. The current Internet is designed for traditional digital data transmission, which mainly cares about the overall transmission throughput and reliability by employing the best-effort traffic model. TCP/IP is the most popular protocol used for Internet transmission. However, the TCP/IP protocol and the best-effort service model are not suited for real-time streams since they cannot provide any bandwidth or delay guarantees.
Internet Telephony, also known as IP phone or packet phone, is usually delivered using the Real-Time Transfer (RTP) protocol [2,3], which lies on top of the UDP protocol. The telephony audio packets belong to the class of live real-time packets, which are very sensitive to latency. Voice is sampled and coded into audio frames. One or more audio frames form an audio packet. RTP headers, such as time stamp and sequence number, are then added to form a RTP audio packet. The packet is then sent as a UDP packet to the receiver through the Internet. At the receiver side, packets are divided into frames and each frame is decoded and the original samples are recovered. The samples are then played back based on the time stamp information. The whole process is done in real-time.
Packets may arrive with different end-to-end delay, which is called as jitter. Slight jitters could be hidden from the user’s perception by allowing the receiver to have a limited buffer size. Large buffer size is unacceptable since it introduces long latency. The play back latency for telephony should not exceed 200~300 ms [4]. So, each packet has a critical deadline. If a packet gets lost or misses the deadline, the receiver will generate a predicted packet based on the neighboring packets. Retransmission is generally not worthwhile because it may anyway miss the deadline in most cases.
Burstiness is an innate property of the TCP traffic because of the sliding window flow control algorithm. In order to improve the bandwidth utilization, most routers use large size buffers to absorb the bursty TCP traffic. This poses problem for real-time packets because during congestion, the real-time packets will miss their deadlines because of being buffered for extended periods of time. Techniques like interpolation could be used to tolerate occasional deadline misses [5]. However, if a few consecutive audio packets miss their deadlines, a vital portion of a talk spurt may miss and the quality of the reconstructed audio signal may not be satisfactory [6]. Unfortunately, during the network congestion, a certain number of consecutive audio packets will miss their deadlines. The number depends on the congestion time which could last from several hundreds milliseconds to several seconds. Congestion is unavoidable in the best-effort Internet. In this paper, we have proposed the usage of the Differentiated Service [12, 13] model for Internet telephony. Differentiated Services is recently proposed as a scalable QoS solution for the Internet. To provide a delay bound for the real-time packets, we propose
mechanisms should be implemented in the edge routers to limit the total amount of RTP traffic in the core network. Light congestion still could occur in the real-time services since there is no strict end-to-end resource reservation. We use a selective dropping mechanism to make the deadline misses distributed evenly during congestion. So the voice quality is degraded gracefully during congestion. The proposed model is evaluated using the ns simulator and results indicate that the selective dropping mechanism performs very well for Internet telephony.
The remainder of this paper is organized as follows. In Section 2, we simulate the telephony streams over the current Internet and identify the problem associated with the voice quality. In Section 3, we propose our solution for the problem. We implement the model using the ns simulator and do a comparative performance study in Section 4, followed by the conclusions in Section 5.
2. Voice Quality of Current Internet Telephony
The International Telecommunication Union (ITU) has several standards for the IP telephony codecs. In our experiment, audio streams are simulated by using audio codec defined in Recommendation G.723.1 of the ITU [18,19]. This compression standard can provide quality comparable to the existing public switched telephone network (PSTN) and is now extensively utilized by H.323 developers because of its efficiency, popularity, and suitability for transmission over low bandwidth connections. The G.723.1 has two bit rates associated with it: 5.3 kbps and 6.4 kbps, and we have used 6.4 kbps for the simulations. The G.723.1 encoder produces one audio frame every 30 ms with a frame size of 24 bytes.
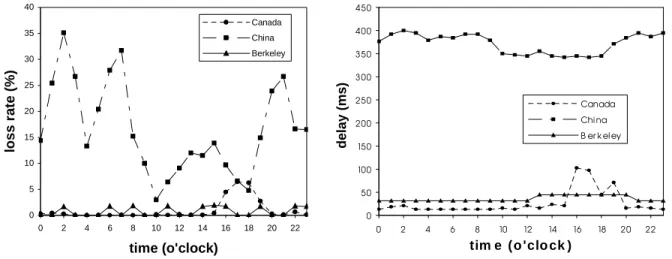
Considering the tradeoff between the network protocol overhead and the latency of the local packets, we use two frames to form a packet. The 8-byte RTP header is also added. So the data of the UDP packet is 56 bytes. A packet is created and sent every 60 ms. Each stream lasts for 10 minutes, which is a typical call length. The streams are sent from hosts at Iowa State University (ISU)1 to the destinations at three remote sites, Berkeley (California), Toronto (Canada) and Beijing (China). In order to characterize the voice quality during different times, the experiment was done once every hour for 24 hours. Figures 1 and 2 show the average loss rate and average delay of each call, respectively. Two important observations can be derived from the figures.
(1) The service quality varies significantly between different connections. The overall service quality of the domestic connection, from ISU to Berkeley, is pretty good. During most of the time, the delay and loss rate for the connection from ISU to Canada is acceptable. The international connection, from ISU to China, however, 0 5 10 15 20 25 30 35 40
0 2 4 6 8 10 12 14 16 18 20 22
time (o’clock) lo s s r a te ( % ) Canada China Berkeley
Figure 1: Average loss rate of each connection.
tim e (o ’clo ck )
d e la y ( m s )
has the worst service quality. It cannot be used for IP telephony without any technological advancement.
(2) For the same connection, the service quality may vary noticeably during different times of a day. Generally, during the daytime, the network traffic is heavy, so the delay is larger and the loss rate is higher. (The loss rate of the connection from ISU to China is lower during the daytime because during that time it is night in China.)
These results only tell us about the average loss rate and delay of a connection, which are not sufficient to characterize the voice quality. The voice quality also depends on the distribution of the lost packets, or loss pattern. Packets delayed longer than 200ms are deemed as lost packets in this experiment. The perceived Quality of Service (QoS) due to packet losses in a burst is often worse than when the occurrences of these losses are adequately spaced.
To address this problem, a finite horizon QoS criteria called (m, k)-firm guarantee was proposed by Hamdaoui and Ramanathan [9]. A real-time stream is said to have an (m, k)-firm guarantee requirement if m out of any k consecutive packets in the stream must meet their respective deadlines. The probability of fewer than m out of any k consecutive packets meeting their respective deadlines is then used as a measure of the QoS perceived by a real-time stream with (m, k)-firm guarantee requirement [6].
Unfortunately, the packet losses of the Internet telephony tend to occur in spurts. For example, in the 10-miunte talk from ISU to Berkeley at 19 o’clock, CDT, the average loss rate is 1.71%, which is low. During the 10 minutes, 10,000 packets were sent and 171 packets got lost. However, the 171 packet losses were not isolated but occurred in
bursts. Figure 3 shows the packet losses during congestion. In Figure 3, “1” denotes that a packet arrived on time, and “0” denotes a packet loss or deadline miss (delay > 200ms). Among the 171 lost packets, 168 of them were lost in a spurt. The loss spurt lasted for about 10 seconds. This, of course, is unacceptable since the receiver may think that the connection has been closed and would terminate the talk too. Figure 4 shows another packet loss pattern during congestion. The experiment was conducted at 19 o’clock, CDT, from ISU to Toronto, Canada. The average loss rate is 2.73%. The loss pattern is different from that in Figure 3. However, the loss spurts still make the voice quality unacceptable during the congestion. We have checked the loss pattern of all of the connections and find that the loss pattern may vary greatly for different connections and at different times. However, consecutive packet loss is a common problem. To avoid repetitions, we have not shown the results of all the cases here. Packet loss is mainly caused by network congestion, which may last from several hundred milliseconds to several seconds. Consecutive packets of a telephony stream may get lost since it sends multiple packets during a congestion period.
111111111111111111111111111111111111111111111111111111111111111111111111111101111111111111111111111111111000 000000000000000000000000000000000000000000000000000000000000000000000000000000000000000000000000000000000000 000000000000000000000000000000000000000000000000000000001111111111111111111111111111111111111111111111111111 111110111111111111111111111111111111
Figure 3: Packet loss during congestion, from ISU to Berkeley, 19 o’clock, CDT.
111111110000000000000000111111100000000001111111111000000100000000000000001111111111000000011111111111000001 111111111111111111111111000000000111111111100000011000000000000000111111100000000001111111111111111111111100 00000000111111100000000001111111111111111111111111111111111111111111111110011111111111111111111111111111
3. Using Differentiated Services for Improving Voice Quality
Several solutions have been proposed for supporting real-time services over Internet. Notably among them are the Integrated Services/RSVP model [10,11] and the Differentiated Services (DiffServ) model [12,13]. RSVP is a signaling protocol for setting up paths and reserving resources. It is able to provide quality of service (QoS) guarantee for each micro-flow. However, it is very difficult to implement it on the Internet routers, especially on the backbone routers since they may process hundreds of thousands of flows at the same time. Keeping per-flow states in the Internet core routers causes scalability problem. In the DiffServ model, packets are marked differently to create several packet classes. The core routers only classify packets based on the packet class instead of the individual micro-flow. Core routers do not need to process per-flow signaling or resource reservation. So it is relatively easier to be implemented in the Internet and has better scalability. In this paper, we have used the DiffServ model as our approach for providing high-quality Internet telephony.
3.1 Class Based Queuing
Internet Telephony is a live real-time process. The service requirement is quite different from the traditional TCP applications. For example, it needs a bounded delay for each packet and a guaranteed bandwidth during the active or “talk” period. However, the TCP sources are very “greedy” in nature; it uses the sliding window flow control method, which increases the sending rate whenever no congestion is detected. So network congestion is almost unavoidable for the TCP traffic. A TCP flow created by a workstation may fill up a 45Mbps backbone [14]. If the Internet telephony stream coexists with the TCP streams, during the congestion, some packets may get dropped or
delayed. This is not a problem for the non-real-time TCP streams since they can retransmit the lost packets. For real-time streams, this behavior is unacceptable because the retransmitted packets will miss the deadline in most cases. Retransmission is not a feasible way even for short Round Trip (RT) time connections. The network congestion may last from several hundred milliseconds to several seconds. During the congestion period, the retransmitted packets are likely to be dropped or delayed again without meeting the deadline. We need to isolate these two classes of services. The Internet core routers should support a real-time service [15] for the real-time streams and a best-effort service for the TCP streams.
A queuing model of the core router is shown in Figure 5. Real-time streams enter the real-time queue and TCP streams enter the best-effort queue. Both of the two queues are drop-tail queues (packets are dropped from the tail during congestion). However, the buffer size of the real-time queue is limited so that a bounded delay could be guaranteed for the real-time services. Before a packet enters the Internet from the edge router, one bit of the Type of Service (ToS) byte, say C-bit, is marked as ‘1’ if the packet is a real-time packet and as ‘0’ if the packet is a best-effort packet. The marker is implemented in the edge router, which works as an interface between the local network domain and the Internet. The packets buffered in the two queues are served using a Weighted Round Robin (WRR) scheduling scheme. We use the WRR scheme instead of priority-based servicing in order to avoid starvation of the best-effort packets. A packet dropped by the real-time queue is enqueued to the best-effort queue.
Using this queuing model, we can isolate the real-time streams from the bursty best-effort streams. Through appropriate configuration of the real-time queue size, we can have bounded delay for each of the successfully transmitted packet. This delay is not affected by the bursts in the best-effort traffic. In the differentiated service model, the resources of the real-time service in a network domain are provisioned. Each neighboring network domain could negotiate with that domain for a Service Level Agreement (SLA) that defines how much traffic of each service level could enter that domain. Shaping and policing of the real-time traffic are done in the network edge based on the SLA between the two domains.
If the resources of the network domain are perfectly provisioned, it could be expected that the aggregate bandwidth of each real-time stream would not exceed the bandwidth allocated for the real-time services in the core routers. However, in DiffServ model, the Internet Services Provider (ISP) could only allocate the real-time service bandwidth to each local network domain by statistical estimation. It is not guaranteed that each real-time packet entering the Internet will never get dropped. Somereal-times, the aggregate bandwidth of the real-time streams may exceed the real-time bandwidth in the core routers, leading to congestion. Since all of the real-time streams share a drop-tail queue,
Real-time queue C-bit=1
dequeue
C-bit=0
Packet classifier Best-effort queue Figure 5: CBQ model for core routers.
streams may get good result while others may have consecutive packet loss, which will be observed in the simulation results in Section 4. Even in the RSVP scheme, resource reservation may also be based on statistical estimation in order to improve the resource utilization, where congestion still cannot be completely avoided.
3.2 Selective dropping
Using the DiffServ model, we could isolate the real-time service from the best-effort service, which greatly improves the voice quality of Internet telephony. However, it still cannot avoid congestion completely. Since we cannot avoid packet loss, we would like the voice quality to degrade gracefully rather than in an uncontrolled manner during the congestion. In other words, we should try to avoid consecutive packet loss as much as possible for each stream.
In [9], Hamdaoui and Ramanathan proposed a Distance-Based Priority (DBP) assignment scheme to meet the (m, k)-firm guarantee QoS requirement of real-time streams. The basic idea is that the routers keep the loss history of the last k packets for each stream. Based on this history, the distance from (m, k)-firm guarantee failure is calculated and then a priority is assigned to the current packet based on the distance. The policy is to assign higher priority to packets whose streams are closer to experiencing a failure as defined by the (m, k)-firm model. The scheme works well for real-time streams that have (m, k)-firm guarantee requirements. However, it is difficult to implement this model in the Internet. First, it needs to keep the loss history of each flow in each router. As we argued before, keeping per-flow information in the Internet core routers will
loss history of each stream; they don’t know the end-to-end loss history therefore cannot make a globally optimum priority assignment.
Our proposed solution is to prioritize the packets by using Inverse Binary Order (IBO) [16]. Suppose the core routers could support 2n priority levels in the real-time service queue. Each real-time packet is assigned a priority in the network edge before it enters the network core. The priority assignment is done in the edge router. When a real-time stream passes the edge router to the Internet core, every 2n packets form a group. Each packet is assigned a priority, which is the IBO of the position of the packet in the group. For example, if the core router supports 8 priority levels for real-time services, then the list of priority assigned to each packet in order is {0, 4, 2, 6, 1, 5, 3, 7}. 0 is the highest and 7 is the lowest priority. By using this prioritization scheme, it is expected that the lost packets would be scattered evenly. The implementation details are described as follows. Let us define n bits in the type of service (ToS) byte as priority bits. Typical values for n could be 1, 2, or 3. When a real-time stream passes the marker in the edge router, the priority bits are marked as the priority of the packet. In the real-time queue of the core router, packets with different priorities are dropped with different probability during the congestion.
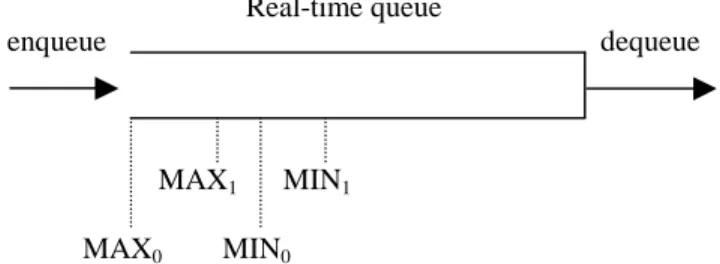
Real-time queue
enqueue dequeue
MAX1 MIN1
MAX0 MIN0
The real-time queuing model is shown in Figure 6. For simplicity reason, let us assume that the core routers only support 2 priority levels in the real-time queue. The queue is a variation of the Random early Detection (RED) queue [17]. In a RED queue, the average queue size is calculated and compared to two thresholds, MIN and MAX. When the average queue size is less than MIN, no packets are dropped. When the average queue size is more than MAX, every arriving packet is dropped. When the average queue size is between MIN and MAX, each arriving packet is dropped with a probability p, where p is a function of the average queue size. A typical choice for p could be:
P_max denotes the maximum dropping rate, which is between 0 and 1. sizeavg denotes
the average queue size.
The real-time queuing model we used in Figure 6 is configured with two sets of parameters, one for priority 0, and one for priority 1. The queue discriminates against the priority 1 packets in the following methods: first, it could drop priority 1 packets earlier than it drops priority 0 packets. Second, it drops priority 1 packets with a higher probability, by setting p_max1 higher than p_max0. Third, when average queue size is
greater than MAX1 but less than MAX0, all of the arriving priority 1 packets will be
dropped, but priority 0 packets may only be dropped with a certain probability.
By dropping the low priority packets earlier, we can ensure that the high priority packets will be transmitted with a lower loss rate. We call this process as selective
) 1 )...( /(
) max(
_ size MIN MAX MIN
p
levels. The actual number of priority levels could be selected by considering the tradeoff between the queue complexity and the performance improvement.
Compared to the DBP prioritization scheme, the IBO prioritization scheme we used here has two advantages. First, the process is static. A priority is selected for a packet before it enters the Internet. The core router does not have to keep the loss history of each stream and make the priority assignment decision. Therefore, it will have better scalability. Second, it can support an adaptive QoS guarantee based on the network congestion depth. For example, assuming that the real-time queue in the core router could support 8 priority levels, if the loss rate is less than 12.5%, it is (7, 8)-guarantee. If the loss rate is between 12.5% and 25%, it is (3, 4)-guarantee. If the loss rate is between 25% and 50%, it is (1, 2)-guarantee. This is nice for the voice stream because it is hard and not necessary to predefine the m and k in the (m, k)-firm guarantee model. If the network cannot satisfy (7, 8)-firm guarantee, satisfying (3, 4)-firm guarantee may also be acceptable.
4. Simulation
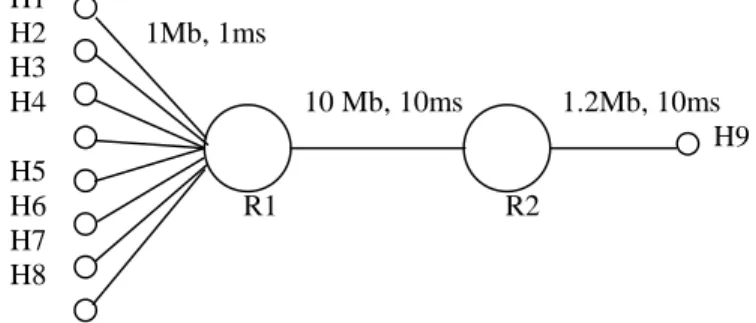
We use the ns network simulator [18] for this study. The network topology used in the simulation is shown in Figure 7. H1~H8 are 8 hosts residing in the same local domain. R1 is the edge router. R2 is the core router. Four TCP streams tcp_1, tcp_2, tcp_3, tcp_4 start from H2, H4, H6, H8 respectively and sink at H9. Four RTP streams (on top of UDP) rt_1, rt_2, rt_3, rt_4 start from H1, H3, H5, H7, respectively and sink at H9. Each of the host among H1~H8 is connected to R1 through a 1Mbps, 1ms delay link. R1 and R2 are connected by a 10Mbps, 10ms link. R2 and H9 are connected by a 1.2Mbps, 10ms link. From simple observance, we could find that the connection between R2 and H9 is
the bottleneck. We will study the packet loss here. The simulation will be a comparison study. First we compare the voice quality between the best-effort model and the CBQ model. Then we compare the voice quality between the CBQ model and the CBQ + selective dropping model. For simplicity reasons, we assume that the bandwidth of each telephony stream is several hundred kbps instead of 5.6kbps or 6.4kbps (defined by the G.723.1), so that we could see the congestion more easily. Otherwise we have to add tens of telephony streams in order to see the network congestion. Each real-time stream here could be deemed as an aggregate traffic of tens of telephony streams.
4.1 Best-effort Model vs. CBQ Model
In this simulation, rt_1~rt_4 are sending in the rate of 100kbps. The size of each packet is 8kb. So, the source send one packet every 80ms. A packet is considered as lost if the transfer delay is greater than 200ms. First, we use the best-effort model to do the simulation. The simulation results are shown in Figure 8. Again, each stream is denoted by a stream of 0’s and 1’s. “0” means the packet is dropped or it missed the deadline and “1” means the packet meets the deadline. From Figure 8 we find that mixing the telephony stream with the TCP streams causes a very high loss rate for the telephony
H1
H2 1Mb, 1ms H3
H4 10 Mb, 10ms 1.2Mb, 10ms
H9 H5
H6 R1 R2 H7
H8
Now, let’s use the CBQ model to do the simulation again. The marker model is implemented in the edge router, R1, and the queue model shown in Figure 5 is implemented in the core router, R2. The maximum length of the real-time queue is 96kb so that each packet enqueued in the premium queue could meet its deadline. The maximum length of the best-effort queue is 320kb. In the core router, we use a WRR scheduling scheme, 600kbps is allocated to the real-time services and 600kbps is allocated to the best-effort services. The simulation result is shown in Figure 9. Since the aggregate bandwidth of the four real-time streams is 400kbps, which is less than 600kbps, every packet meets its deadline. In the next section, we will consider about the situation when the aggregate bandwidth exceeds the real-time service bandwidth.
rt_1
111000000000011100000000000000000000000001000000000000000000000 rt_2
111000000000011100000000000000000000000011100000000000000000000 rt_3
111000000000011100000000000000000000000001100000000000000000000 rt_4
111000000000011100000000000000000000000001100000000000000000000 total packets = 252 loss = 220 loss rate = 87%
Figure 8: Best-effort model: packet loss pattern of each telephony stream.
rt_1
111111111111111111111111111111111111111111111111111111111111111 rt_2
111111111111111111111111111111111111111111111111111111111111111 rt_3
111111111111111111111111111111111111111111111111111111111111111 rt_4
111111111111111111111111111111111111111111111111111111111111111 total packets = 252 loss = 0 loss rate = 0%
Figure 9: CBQ model: packet loss pattern of each telephony stream.
4.2 CBQ Model vs. CBQ + Selective dropping
Using CBQ to isolate the telephony streams from TCP traffic could improve the voice quality greatly during the congestion. However, if the aggregate bandwidth of the telephony streams exceeds the real-time service bandwidth, congestion will occur. During
congestion, newly arriving packets are dropped when the real-time queue is full. Without selective dropping, consecutive packet loss could happen even if the congestion is not very high. We do the comparison for both of the two models under different levels of congestion.
rt_1
111111111111111111111111111111101001101101001001101101001001101101001001101101001001101101001001101101001001 101101001001101101001001101101001001101101001001101101001001101101001001101101001001101101001001101101001001 101101001
rt_2
111111111111111111111111111111111111111111111111111111111111111111111111111111111111111111111111111111111111 111111111111111111111111111111111111111111111111111111111111111111111111111111111111111111111111111111111111 111111111
rt_3
111111111111111111111111111111111111111111111111111111111111111111111111111111111111111111111111111111111111 111111111111111111111111111111111111111111111111111111111111111111111111111111111111111111111111111111111111 111111111
rt_4
111111111111111111111111111111011111011011111111011011111111011011111111011011111111011011111111011011111111 011011111111011011111111011011111111011011111111011011111111011011111111011011111111011011111111011011111111 011011111
total packets = 900 loss = 130 loss rate = 14%
Figure 10: Drop pattern of CBQ model, using FIFO for real-time queue.
rt_1
111111111111111011101110111011101110111011101110111011101110111011101110111011101110111011101110111011101110 111011101110111011101110111011101110111011101110111011101110111011101110111011101110111011101110111011101110 111011101
rt_2
111111111111111111111011111111111111111111111111111111111111111111111111111111111111111111111111111111111111 111111111111111111111111111111111111111111111111111111111111111111111111111111111111111111111111111111111111 111111111
rt_3
111111111111111111011111111111111101110111011101111111011101111111011101111111011101111111011101111111011101 111111011101111111011101111111011101111111011101111111011101111111011101111111011101111111011101111111011101 111111011
rt_4
111111111111111101110111011101110111011101110111011101110111011101110111011101110111011101110111011101110111 011101110111011101110111011101110111011101110111011101110111011101110111011101110111011101110111011101110111 011101110
total packets = 900 loss = 141 loss rate = 15%
greater than 600kbps. So the real-time queue should drop about 17% of the packets after it reaches the stable state. Figure 10 shows the drop pattern of each stream. The overall loss rate is 14%, which is lower than 17% for two reasons: First, initially the queue is empty, so it does not drop packets even though the enqueuing rate exceeds the dequeuing rate. Second, some of the packets dropped by the real-time queue can still meet their deadlines through the best-effort service. From Figure 10 we could find that although the congestion is relatively light, rt_1 still has many consecutive losses, which will make the voice quality unacceptable. The lost packets are not fairly distributed among the four flows. This is the innate property of the drop-tail queue [19]. A fair queuing model could be used to make it fairer, which is, however, out of the scope of this paper.
Now, let’s implement the selective dropping model (Figure 6) in the core router, R2. We implement four priorities in the real-time queue. 0 is the highest priority and 3 is the lowest priority. Also, we implement the marking model in the edge router, R1. The parameters are selected as follows. MAX0 = MIN0 = 96kb, MAX1 = MIN1 = 80kb, MAX2 = MIN2 = 64kb, MAX3 = MIN3 = 48kb. The simulation is done again and the results are shown in Figure 11. Although the overall loss rate is 15%, the lost packets now are distributed evenly. Any pair of packet losses is separated by at least 3 successfully transmitted packets. The voice quality of each stream could be deemed as acceptable under the (3, 4)-firm guarantee criteria.
The simulation was done under different congestion levels and the results are shown in Figures 12 and 13. We use the average loss rate as a measure of the congestion depth. Average loss rate is the drop rate of the real-time queue after it reaches the stable state. For example, the total bandwidth for real-time service is 600kbps, if the aggregate
bandwidth of the four real-time flows is 1.2Mbps, then the average loss rate is 50%. Figure 12 shows the simulation result using selective dropping in the real-time queue. Figure 13 is the simulation result using FIFO for real-time queue. Several observations could be derived from the simulation results:
(1) When the average loss rate is lower than 25%, the failure rates of (3, 4)-firm guarantee for all of the four streams are 0 under the selective dropping model (Figure 12-b). However, in the FIFO real-time queue model (Figure 13-b), rt_1 has a very high (3, 4)-firm guarantee failure rate when the average loss rate is higher than 5%. Rt_4 also gets a high (3, 4)-firm guarantee failure rate when average loss rate is higher than 25%.
(2) When average loss rate is lower than 50%, the failure rates of (1, 2)-firm guarantee for all of the four streams are 0 under the selective dropping model (Figure 12-c). However, in the FIFO real-time queue model (Figure 13-c), rt_1 has a high (1, 2)-firm guarantee failure rate when the average loss rate is greater than 10%. Rt_4 also gets a high (1, 2)-firm guarantee failure rate when average loss rate is higher 20%. (3) In both models, different flows have different loss rates. However, in the selective
dropping model (Figure 12-a), the loss rates of the four flows are same when average loss rate is 25%, 50% and 75%. The explanation is that when the average loss rate is 25%, all of the packets with priority 3 (lowest priority) are dropped. No other packets get dropped. So all of the four streams have the same loss rate, 25%. Similar situation happens when average loss rate is 50% and 75%. But when the average loss rate is
selective dropping scheme, all of the packets with priority 3 and 20% of the packets with priority 2 are dropped. However, some of the streams may drop more of their priority 2 packets and others may drop less. So it can only guarantee that the loss rate of each stream is higher than 25% and lower than 50%. Having more priority levels in the real-time queue could reduce the difference of loss rates among the flows. In the FIFO real-time queue model (Figure 13-a), there is no fairness at all among different streams. Rt_1 and rt_4 get a lot of loss while rt_2 and rt_3 have no loss when the average loss rate is less than 50%.
Supporting four priority levels in the real-time queue could ensure (3, 4)-firm guarantee for each real-time stream when the average loss rate does not exceed 25%. It cannot ensure (3, 4)-firm guarantee for each stream when average loss rate is higher than 25%, but could still ensure (1, 2)-firm guarantee when the average loss rate does not exceed 50%.
(a) Loss rate of each flow. (a) Loss rate of each flow.
(b) (3,4)-firm guarantee failure rate. (b) (3,4)-firm guarantee failure rate.
(c) (1,2)-firm guarantee failure rate (c) (1,2)-firm guarantee failure rate
Figure 12: Loss rate, (3,4)-firm guarantee and Figure 13: Loss rate, (3,4)-firm guarantee and (1,2)-firm guarantee failure rates. (1,2)-firm guarantee failure rates. Using selective dropping in real-time queue. Using FIFO in real-time queue.
! " #! $ %
! " #! $
average loss rate (%)
lo ss r a te o f e a c h f lo w ( % )
&'(
&'(
&'(
&'(
) *) +) ,) -) .!) /) 0!) 1) 2) *))
) *) +) ,) -) .!) /) 0!) 1)
average loss rate (%)
lo ss r a te o f e a c h f lo w ( % )
345
*
345
+
345
,
345
-6 76 86 96 :6 ;!6 <6 =!6 >6 ?6 766
6 76 86 96 :6 ;!6 <6 =!6 >6
average loss rate (%)
(3 ,4 ) g u ra n te e f a il u re r a te ( %
) @AB
7
@AB
8
@AB
9
@AB
: ! " #! $ %
! " #! $
average loss rate (%)
(3 ,4 ) g u a ra n te e f a il u re r a te ( % )
&'(
&'(
&'(
&'(
! " #! $ %
! " #! $
average loss rate (%)
(1 ,2 ) g u a ra n te e f a il u re r a te ( %
) &'(
&'(
&'(
&'(
! " #! $ %
! " #! $
average loss rate (%)
(1 ,2 ) g u a ra n te e f a il u re r a te ( %
) &'(
&'(
&'(
&'(
5. Conclusion
In this paper, we studied the voice quality problem of the current Internet telephony and its performance improvement by using DiffServ model for the telephony stream. Since there is no per-flow resource reservation in the DiffServ model, we argue that the packet loss is unavoidable. By introducing the selective dropping model, we expect that consecutive packet loss could be avoided during the congestion. It is also possible to let each packet to keep some redundant information of the neighboring packet. When a packet is lost, under our scheme, the loss probability of the neighboring packet is very low. So, we could use the redundant information in the neighboring packet to better predict the lost packet. The selective dropping method is also useful for video streams. For example, in a MPEG video stream, the P and B frame depend on the I frame, if an I frame gets lost, the neighboring P and B frame may be useless even if they could meet their deadline. So, we can assign high priority to the packets containing I frames and low priority to the packets containing P and B frames. Then we can expect that I frames would rarely get dropped if the network congestion is not very deep. So the quality will be degraded gracefully during network congestion.
Supporting more priority levels in the real-time queue could provide finer (m, k)-firm guarantee. However, it is not easy because the real-time queue only has a limited buffer size. Implementing too many RED thresholds in the queue is very difficult.
References:
[1] S. R. Ahuja and K. G. Murti, “Packet Telephony,” Bell Labs Technical Journal, Spring, 1997.
[2] H. Schulzrinne, A. Rao and R. Lanphier, “Real Time Streaming Protocol (RTSP),” Internet Engineering Task Force INTERNET-DRAFT draft-ietf-mmusic-rtsp-09.ps, Feb. 1998.
[3] H. Schulzrinne and J. Rosenberg, “Internet Telephony: Architecture and Protocols an IETF Perspective,” July 2, 1998,
http://www.cs.columbia.edu/~hgs/research/imm/.
[4] G. Ellis, “Internet Protocol: the future route for telephony?,” EDM Access Cover Story, 11/19/1998,
http://www.ednmag.com/reg/1998/11998/2405.cfm.
[5] D. Yates, D. T. J. Kurose, and M. G. Hluchyj, “On per-session end-to-end delay distributions and call admission problem for real-time applications with qos requirements,” in SIGCOMM, pp. 2-12, September 1993.
[6] W. Lindsay, P. Ramanathan, “DBP-M: A technique for meeting end-to-end (m, k)-firm guarantee requirements in point-to-point networks,” Technical Report, Department of Electrical and Computer Engineering, University of Wisconsin-Madison.
[7] ITU-T Recommendation G.723.1 (1996) –Dual Rate Speech Coders for Multimedia Communication Transmitting at 5.3 & 6.4 kbps/s.
[8] H. ElGebaly, “Characterization of Multimedia Streams of an H.323 Terminal,” Intel Technology Journal, 2nd quarter’98.
[10] R. Braden, D. Clark, and S. Shenker, “Integrated Services in the Internet Architecture: An Overview,” Internet RFC 1633, Jun, 1994.
[11] R. Braden, L. Zhang, S. Berson, S.Herzog and S. Jamin, “Resource ReSerVation Protocol (RSVP) – Version 1 Functional Specification,” RFC 2205, Sep, 1997. [12] S. Blake, D. Black, M. Carlson, E. Davies, Z. Wang, and W. Weiss, “An
Architecture for Differentiated Services,” RFC 2475, Dec, 1998.
[13] Y. Bernet et al., “A Framework for Differentiated Services,” Internet draft <draft-ietf-diffserv-framework-00.txt>, May 1998.
[14] D. Clark, “Adding Service Discrimination to the Internet,” Tech. Report, MIT Laboratory of Computer Science, Sep. 1995.
[15] V. Jacobson, “Differentiated Services Architecture,” Talk in the Int-Serve WG at the Munich IETF, Aug. 1997.
[16] B. C. Smith, “Cyclic-UDP: A Priority-Driven Best-Effort Protocol,” Tech. Report, Computer Science Department, Cornell University.
[17] S. Floyd, V. Jacobson, “Random Early Detection Gateways for Congestion Avoidance,” IEEE/ACM Transactions on Networking, pp397-413, Aug. 1993.
[18] http://www-mash.cs.berkeley.edu/ns/
[19] A. Demers, S. Keshav, and S. Shenker, “Design and Analysis of a Fair Queuing Algorithm,” Proceedings of ACM SIGCOMM ’89, Austin, Sep. 1989.