National Tax Journal Vol. LVI, No. 3 September 2003
Abstract - Reducing the double tax on corporate income has an
ambiguous effect on marginal effective tax rates. It depends on the specifics of the policy, the extent of debt finance, whether one adopts the new or the old view of dividend taxes, the identity of the mar-ginal investor, the importance of international capital flows, and the replacement tax regime. We illustrate or discuss each of these sources of ambiguity. We also model the excludable dividend amount (EDA), a feature of the President’s dividend tax proposal, and we calculate the marginal effective tax rate for the 5/15 divi-dend and capital gains tax relief proposal that has become law.
INTRODUCTION
T
he recent proposal by the Bush Administration to elimi-nate shareholder–level taxes on dividends and retained earnings revived interest in reducing the double taxation of income earned on corporate equity. The Bush Admin-istration’s proposal ultimately led to enactment of a reduc-tion in the tax rate on dividends and on capital gains, the so– called 5–15 proposal.Reducing the double tax—“integration” in the parlance of public finance economics—has long been advocated as a de-sirable tax reform, but there is significant uncertainty con-cerning the size of the economic benefits associated with lower dividend taxes. Modeling dividend tax changes is com-plex and there is disagreement in the academic literature about the size of integration’s likely effect on the incentive to invest. We illustrate several sources of ambiguity using the Hall–Jorgenson user cost of capital—marginal effective tax rate framework. First, we show that integration’s benefits de-pend on the extent to which investment is financed with eq-uity rather than with debt. Second, integration’s benefits de-pend on the extent to which corporate investment is burdened by dividend taxes, as under the “old view” of dividend taxes, rather than by capital gain taxes, as under the “new or trapped equity view” of dividend taxes. Third, integration’s benefits depend on the marginal investor, for example, on whether the marginal investor is a taxable individual or instead is appropriately thought of as an average of all investors, in-cluding tax exempt entities such as pension funds. Fourth, integration’s benefits may depend on the extent to which the
The Effect of Dividend Tax Relief
on Investment Incentives
Robert Carroll
Council of Economic Advisers, Washington, DC 20502
Kevin A. Hassett
American Enterprise Institute, Washington, DC 20036
James B. Mackie III
Office of Tax Analysis, U.S. Treasury,
economy is open to international capital flows. Finally, the benefits of integration may depend on specific firm–level char-acteristics such as the asset life of a firm’s machines.
The Bush Administration’s original pro-posal for eliminating the double tax on dividends intended to implement the principle that all corporate income should be taxed once. The mechanism for ensur-ing that corporate income was taxed once was an Excludable Dividend Amount (EDA) that restricted the shareholders’ excludable amount to income that had been previously taxed under the corpo-ration income tax at a 35 percent tax rate. Without such a mechanism, a shareholder exclusion of corporate income could re-sult in a zero tax imposed on income that benefits from corporate tax preferences such as exclusions, deductions, and cred-its.
Previous analyses of the effect of inte-gration on the marginal effective tax rates have not included the effects of an EDA, even though EDAs were a feature of past integration proposals, such as those dis-cussed in U.S. Treasury (1992). In this pa-per, we modify the traditional user cost framework in order to model the EDA. It turns out that the EDA can have surpris-ing effects on investment incentives, com-pared to shareholder exclusions that do not incorporate an EDA. As expected, in many cases the EDA raises the tax cost of corporate investment since the benefits of dividend tax reduction can be offset by a reduction in the value of corporate–level tax shields. In other cases, however, the EDA increases marginal investment incen-tives, even though its intention is to limit tax benefits. In addition, the EDA may not promote tax neutrality to as great an ex-tent as full exclusion without EDAs, which provides more aggregate tax relief to the corporate sector. However, an EDA costs less than a straight exclusion, thus biasing the comparison somewhat in fa-vor of an exclusion without an EDA. Our
analysis of EDAs is supported by the rig-orous dynamic optimization analysis of EDAs given in Auerbach and Hassett (2003b) and builds on and complements the analyses of Gale and Orszag (2003) and Esenwein and Gravelle (2003).
THE DOUBLE TAX ON CORPORATE PROFITS: AN OVERVIEW OF ITS EFFECTS
Current law “double taxes” corporate profits (U.S. Treasury, 1992). This is seen most easily if we assume that the tax code measures and taxes economic income so that statutory tax rates equal marginal ef-fective tax rates. In this case, corporate income is taxed once under the corpora-tion income tax at rate u. It is taxed again under the individual income tax when distributed as a dividend or realized as a capital gain upon sale of shares, say at rate Te. The marginal effective total tax rate on income from an equity financed invest-ment then is u + (1 – u)Te, reflecting the sum of the corporate tax rate and the shareholder tax rate. Double taxation po-tentially distorts a number of economic choices.
The double tax adds to the overall tax burden on a typical investment in the U.S. economy, and so may discourage saving and investing in the aggregate. This po-tentially reduces capital formation and saving and slows economic growth.
Because of double taxation, corporate equity financed investments typically are taxed more heavily than similar invest-ments undertaken by pass–through enti-ties such as S corporations, partnerships or sole proprietorships. In addition, the double tax adds to the tax burden on busi-ness investment relative to essentially untaxed owner–occupied housing. Con-sequently, double taxation inefficiently discourages the use of the corporate form of organization or investment in corpora-tions, as well as investment in businesses as opposed to owner–occupied housing.
It thus contributes to an unproductive use or allocation of our nation’s stock of real capital.
The double tax on corporate equity also may create financial distortions. It might discourage corporations from financing with equity in favor of using debt, on which the company may deduct interest payments, to finance their activities. This may make corporate capital structures too rigid and too vulnerable to bank-ruptcy and financial distress. In addition, by distinguishing between dividends, taxed as ordinary income, and retained earnings and share repurchases, taxed as capital gains, the personal level tax on corporate earnings may discourage com-panies from paying dividends. Under some theories of the firms, this may im-pose additional costs on investors, who receive a smaller fraction of their earn-ings as dividends than, but for taxes, they would prefer.
The effect of double taxation on debt– equity ratios has been recognized to be an important theoretical concern for decades. Remarking on the theory in their famous textbook, Atkinson and Stiglitz compare a classical system like our own to one that integrates corporate and personal taxes (an “imputation” system). They remark that “the switch from a classical system to imputation may make a substantial dif-ference” and equity finance may be much more likely (Atkinson and Stiglitz, 1980, p. 141). Early empirical work failed to find a significant effect of marginal tax rates on finance, but recent studies have been more successful in finding a link. In a re-cent review article, more rere-cent studies have found that higher marginal tax rates tend to increase debt levels—the effect predicted by theory (Graham, 2003).
Studies of taxes and dividend payout have found that there is a significant link. Poterba (1987) found that payout tends to respond sharply to swings in marginal tax rates. To the extent that firms have an in-centive to allow cash to pile up within the
firm, or to undertake investment projects with negative net present values, these incentives may exacerbate problems of asymmetric information and separation of ownership from control.
As these issues are quite difficult to quantify, we focus henceforth on the link-age between dividend taxation and real investment. Recent empirical studies have generally found a significant link between the user cost of capital and real invest-ment, thus dividend tax policy can have a significant impact on the economy if it affects the user cost of capital in a mate-rial manner. This paper discusses the ef-fect of integration on the incentives that guide investors in making real investment decisions using a cost of capital/effective tax rate framework.
THE TRADITIONAL COST OF CAPITAL/MARGINAL EFFECTIVE TAX RATE MODEL
The Conceptual Framework
We analyze the investment incentive effects of integration using a model of in-vestment incentives closely related to the cost of capital approach associated with Mervyn King, Don Fullerton, and their colleagues (e.g., King and Fullerton, 1984; Fullerton, 1987; Mackie, 2002). The con-ceptual framework is that of the neoclas-sical theory of investment pioneered by Dale Jorgenson (1963) and Robert Hall and Dale Jorgenson (1967).
According to the neoclassical theory of investment, the firm will continue to in-vest until, at the margin, the after–tax cash flow from the last dollar invested equals $1. So, in equilibrium
[1] 1 – k = ∫(1 – u)ce–(rc–π+δ)tdt + u(1 – k)z, where k is the investment tax credit rate, u is the statutory corporate income tax rate, c is the asset’s pre–tax rental rate, δ is the economic depreciation rate, rc is the
firm’s nominal after–tax discount rate, π is the inflation rate and z is the present value of tax depreciation allowances on a one dollar investment.
Integrating to determine c, and then subtracting δ gives the cost of capital, the pre–tax after–depreciation rate of return required to cover the investment’s tax cost and the real after–tax opportunity cost of funds. If we denote by ρc the cost of capi-tal for a corporate investment, then
[2] ρc = c – δ = (1 – k){rc – π + δ}(1 – uz) /(1 – u) – δ.
The cost of capital is the real rate of re-turn, net of depreciation, that is just suffi-cient to cover the investment’s tax cost and its real opportunity cost of funds, rc– π.
Shareholder Taxes: The Debate between the Old and the New Views of Dividend Taxes
Investor level taxes enter through the discount rate, rc. If we assume that share-holders require an after–all–tax real rate of return of s, then the discount rate for an equity financed investment is
[3] rc= re = (s + π)/(1 – Te).
Determining the appropriate value for Te reflects the view one takes on the de-bate between the new view and the old view of dividend taxes (Auerbach, 2001; Auerbach and Hassett, 2003a; Bradford, 1981; King, 1977; Poterba and Summers, 1985; and Zodrow, 1991). Each alternative is based on a theory designed to explain why a firm would pay dividends even
though they are taxed more heavily than are capital gains on reinvested earnings or share repurchases.
The old view holds that dividends of-fer a non–tax benefit that offsets their tax disadvantage. Corporations set dividend payments so that, for the last dollar of dividends paid, the extra non–tax benefits of dividends equal their extra tax cost. Under this theory, marginal investment is financed by new share issues, implying that the value of a marginal dollar in the company is one dollar, q = 1. The reason q is always one is that this simple model has no adjustment costs and investment re-sponds quickly to dividend tax payments. For example, if dividend taxes are low-ered, the marginal after–tax product of capital increases instantaneously, thereby pushing q above 1. Investment then oc-curs driving q back to one. The dividend tax raises the effective tax rate to the ex-tent that firms payout current earnings as dividends, while capital gains taxes raise the effective tax rate to the extent that firms retain and reinvest current earnings or distribute earnings to stockholders via share repurchases. Under the old view, Te = Pm + (1 – P)ω, where P is the dividend payout ratio, m is the dividend tax rate and ω is the effective accrual tax rate on capital gains, which reduces the statutory tax rate on gain to account for deferral and sometimes for the tax free–step–up in ba-sis at death (King and Fullerton, 1984).1
Under the new view of dividend taxes, dividends offer no non–tax benefits, but are assumed to be the only means of dis-tributing funds to shareholders. Because dividend taxes must be paid on corporate distributions, they reduce the marginal value of corporate shares, and for this
rea-1 Our approach to including shareholder level taxes differs slightly from that in the King–Fullerton model. The King–Fullerton model allows for differences between the capital gains tax rate and the dividends tax rate by calculating a nominal discount rate appropriate for each, and then taking a weighted average of the two as the discount rate for corporate equity. In contrast, we weight the tax rates on gains and dividends in calculating a weighted average tax rate on equity, as in Auerbach (1983a and 2001), Gravelle (1994); and U.S. Treasury (1992). We adopt this approach because it seems slightly more consistent with the theoretical development of the old view of dividend taxes.
son the new view is sometimes called the tax capitalization view. Specifically, if the firm is paying dividends, the investor is indifferent between receiving a dividend with an after–tax value of (1 – m) and hav-ing the firm reinvest the earnhav-ings within the company, thereby raising share value by q, which generates an after–tax capital gain of q(1 – ω). So, the increase in the value of the company when it retains a dollar is q = (1 – m)/(1 – ω) < 1.
Under the new view, because of tax sav-ings for shareholders, firms would gen-erally prefer to finance investment out of retained earnings rather than by issuing new shares. For investment financed by retained earnings, the dividend tax has no effect on the incentive to invest, since it reduces proportionately the investment’s after–tax cost and its after–tax return, leav-ing the rate of return unaffected. In con-trast, the capital gains tax on share appre-ciation acts as a deterrent to investment financed through retained earnings. Un-der the new view, Te = ω.
The empirical support for either view is mixed. Numerous studies show a sta-tistical relationship between the dividend payout ratio and the tax penalty on divi-dends relative to capital gains, seeming to offer support for the old view. How-ever, the theory of the new view only pre-dicts that dividend taxes are irrelevant when they are constant through time. Since variation of tax rates over time is required if one is to estimate an equation, one cannot form a sharp conclusion about the relevant merit of either view from this evidence. Firms rarely issue new shares, offering some support for the new view. However, marginal investment might still be financed by new shares even if share issues occur infrequently. Some papers have found evidence that some firms may be on the new share issue margin, while others may be on the retained earnings margin, suggesting that each theory may be appropriate for some firms at some times.
One piece of evidence against the new view, that share repurchases occur fre-quently, while the new view assumes that firms must distribute via dividends, is widely interpreted as conclusive proof that the new view is flawed. It is not clear, however, that the ability of firms to dis-tribute via share repurchases invalidates the new view’s implication that the divi-dend tax does not affect the cost of capital (Auerbach, 1989a and 2001; Auerbach and Hassett, 2003a). If earnings are distributed via share repurchase, then the dividend tax would seem to have no potential to affect investment incentives because divi-dends are not paid. Furthermore, under new view logic, the tax on distributions, which in this case would be a capital gains tax on repurchases, would be irrelevant, since it affects proportionately both an investment’s cost and its return, leaving the rate of return unaffected. The capital gains tax on share appreciation would continue to burden the investment.
Following the U.S. Treasury (1992), we adopt the old view in most calculations, but also test the sensitivity of our results to this assumption by performing an al-ternative set of calculations under the new view. Auerbach and Hassett (2003a) sug-gest that about half of firms in the U.S. likely fall under each view, so analyzing the change in investment incentives un-der each view is important for unun-der- under-standing the impact of any policy.
Debt Financed Investment and Taxes on Lenders
If a bondholder is taxed at rate θ, then the firm’s discount rate for a debt financed investment is
[4] rc = rd = i(1 – u) = (s + π)(1 – u)/(1 – θ) which accounts for the firm’s ability to deduct the return paid to bondholders, i.e., interest, and for tax the lender pays on interest income.
A Weighted Average Discount Rate
For mixed debt and equity financing, the firm’s discount rate, r, is a weighted average of re and rd .
[5] rc = we re + wd rd .
The appropriate weights, weand wd are based on the assumed share of the invest-ment that is financed by debt. Under the new view, however, the weights are ad-justed to reflect the undervaluation of cor-porate equity (Auerbach, 1983a).2
The Marginal Effective Tax Rate
The marginal effective tax rate is the proportion of the investment’s pre–tax re-turn that is needed to cover the tax cost. The marginal effective total tax rate in-cludes taxes at the company level and at the investor level and is computed as [6] METTR = (ρc – s)/ρc.
The METTR can be interpreted as the hypothetical tax rate that, if applied to economic income, would have the same incentive effects as those implied by the actual tax system.3
The Parameter Assumptions
In the calculations presented below, the after–tax required rate of return, s, is set to 4 percent,4 and the inflation rate to 3
per-cent.5 Statutory tax rates reflect federal
in-come taxes only.6 In most calculations, the
tax rates are a weighted average across all investors,7 including both taxable investors
and tax exempt investors, but sensitivity analysis is performed using a higher set of tax rates. In most calculations, financing is assumed to be 35 percent and 65 percent equity,8 but sensitivity results are presented
based on a higher leverage ratio. In calcu-lations based on the old view of dividend taxes, we assume that companies payout 50 percent of their earnings as dividends.9
2 The market value of equity is dividend by its price, q, in order to arrive at the amount of new capital that is equity financed: wd = B/(B + E/q), where B is the bonds issued to financed the marginal investment and E is
the market value of retained earnings used to finance the marginal investment.
3 We adopt a similar approach in measuring the cost of capital and marginal effective tax rate for an investment in unincorporated business and in owner occupied housing. See, e.g., Fullerton (1987) and Mackie (2002). 4 It is common to assume a value of s in this range. See, e.g., Auerbach (1983b and 1996), and King and Fullerton
(1984).
5 This rate of inflation is somewhat higher than that suggested by very recent historical experience, but appears reasonable when compared against historical experience over a longer time frame. It also is consistent with inflation rates that have been assumed in other fairly recent calculations of effective tax rates, e.g., Auerbach (1996).
6 The capital gains tax rate is an effective accrual equivalent tax rate, computed by reducing the statutory rate by 1/
2 to reflect the benefits of deferral.
7 The tax rates are constructed based on the methodology in King and Fullerton (1984), beginning with statu-tory tax rates on individuals calculated from the Treasury’s Individual Tax Model and reflect fully phased in EGTRRA. The corporate tax rate is 35 percent, the tax rate on dividends is 17.1 percent, the effective accrual tax rate on capital gains is 6.6 percent, the tax rate on interest income is 18.8 percent, the tax rate on homeowners is 23.3 percent, the tax rate on noncorporate business income is 27.2 percent, and itemizing homeowners deduct interest at a 23.3 percent tax rate, but only 60 percent of homeowners itemize. Tax rates on dividends, interest, and capital gains are weighted averages across taxable and tax exempt investors, using ownership weights from the Flow of Funds Accounts.
8 This assumption is consistent with recent historical data in the Flow of Funds Accounts, and also with a leverage ratio in the range of 30 percent – 40 percent that is typical in effective tax rate calculations (Auerbach, 1996; Fullerton, 1987; Gravelle, 1994).
9 Recent data from the National Income and Products Accounts (Table 1.16) suggest that once S corporations are removed, dividends account for about 50 percent of corporate after–tax profits (with the IVA and CCA), while dividends account for about 60 percent of after–tax profits neglecting the IVA and CCA. Recent data on common stock yields of S&P 500 companies (Economic Report of the President, 2002, Table B–95), suggest that dividends have accounted for between 32 and 71 percent of earnings after taxes between 1990 and 2000,
In our calculations, we do not alter fin-ancial policy in response to changes in taxes.
We note in passing that there is little on which to base these assumptions in the existing literature. We really don’t know how marginal investments are financed, nor do we know the tax status of marginal investors, if there is such a thing. None-theless, the particular assumption chosen can have a large effect on the results. Some of these issues we deal with through sen-sitivity calculations, but others we do not address. For example, even seemingly in-consequential assumptions, such as using an average tax rate to compute the user cost, rather than computing an average user cost across different potential tax rates, can affect the results.
THE INVESTMENT INCENTIVE BENEFITS OF SHAREHOLDER EXCLUSIONS
The integration plan proposed by the Bush administration is a modified version of a shareholder exclusion applied to both dividends and future capital gains. To analyze the Bush plan, it appears sensible to move by steps from current law to the full plan. In this section, we begin this by presenting calculations that proceed from current law to a 50 percent dividend ex-clusion, and then to a 100 percent exclu-sion of both dividends and capital gains on corporate stock, which would extend the benefits of integration to corporate earnings that are paid out as dividends as
well as to those that are retained and rein-vested within the company. Two variations of the capital gains exclusion are consid-ered: an explicit exemption and exclusion for dividend reinvestment plans (DRIPs). After considering these shareholder exclu-sions, the President’s proposal, which as described earlier limits tax relief to the EDA, is examined in the following section. The paper also includes calculations for the 5/15 plan that was enacted during the completion of this paper.
Modeling Shareholder Exclusions
Shareholder exclusions are modeled by adjusting the shareholder’s tax rate on equity financed corporate investment. With a 50 percent dividend exclusion, Te = P(1/2)m + (1 – P)ω, while with an exclu-sion of both dividends and capital gains on corporate stock, Te = 0.
Determinants of the Incentive Benefits of Shareholder Exclusions
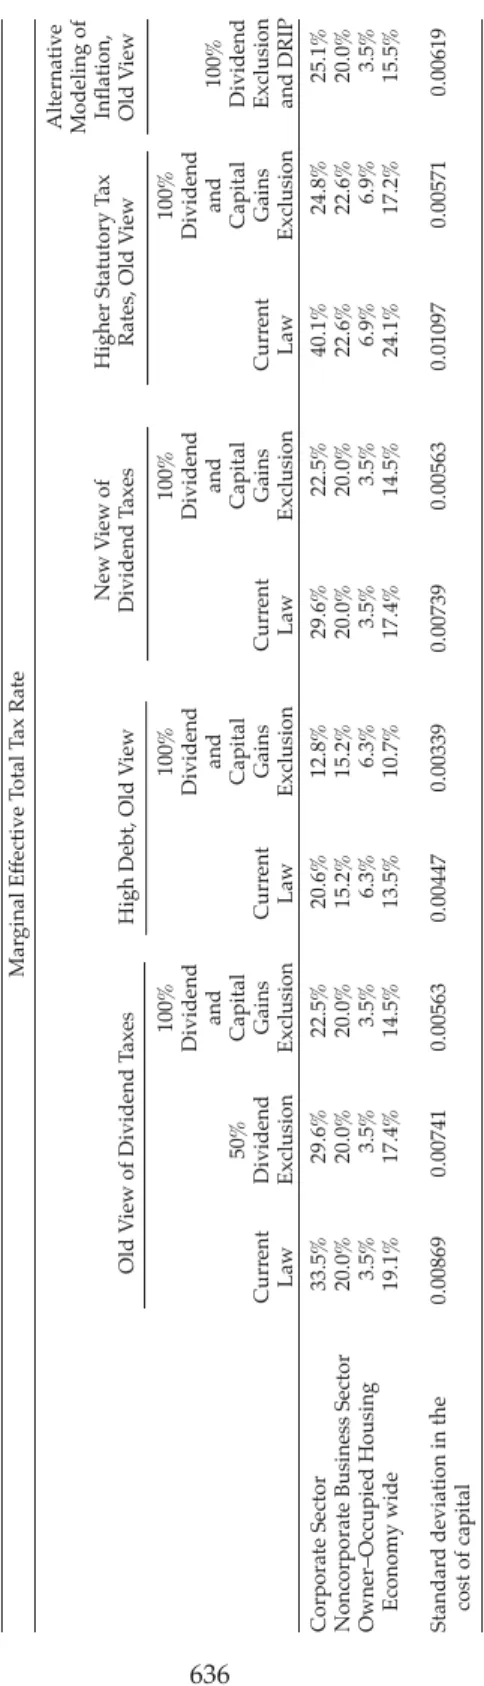
The old–view calculations in Table 1 show that under current law, corporate investment faces a substantially higher effective tax rate, 33.5 percent, than does investment in the noncorporate sector, 20.0 percent, and in owner–occupied housing, 3.5 percent.10 The overall economy wide
effective tax rate is 19.1 percent.
Integration in the form of either a 50 percent dividend exclusion or a 100 per-cent exclusion of both dividends and
capi-and averaged about 50 percent over the period. (If we add inflation on the equity value of the company to earnings, then dividends would account for between 19 percent and 45 percent of nominal earnings over this period, and would average 33 percent.) Our assumption is consistent with Fullerton, Gillette, and Mackie (1987) who assumed a 50 percent payout ratio in calculating investment incentives under the old view. It is larger than, but in the same ballpark as, the 43 percent nominal payout ratio assumed in Treasury’s 1992 Integration Report and the 42 percent nominal payout ratio that would be consistent with Gravelle’s (1994) assumption of a 67 percent payout of real earnings (re – π). It is substantially larger than the 30 percent
nomi-nal payout ratio assumed in Auerbach (1996).
10 Owner–occupied housing has a positive, rather than zero, effective tax rate because the calculations assume that only 60 percent of investment in housing is by taxpayers who itemize, and so can deduct interest. Because of this, the weighted average tax rate at which homeowners deduct interest is less than the tax rate on interest income.
Alternative Modeling of Inflation, Old V
iew
Old V
iew of Dividend T
axes
High Debt, Old V
iew
New V
iew of
Dividend T
axes
Higher Statutory T
ax
Rates, Old V
iew
Curr
ent
Law
50%
Dividend Exclusion
100%
Dividend
and
Capital Gains Exclusion
Corporate Sector Noncorporate Business Sector Owner–Occupied Housing Economy wide Standar
d deviation in the
cost of capital
33.5% 20.0% 3.5% 19.1%
0.00869
29.6% 20.0% 3.5% 17.4%
0.00741
22.5% 20.0% 3.5% 14.5%
0.00563
20.6% 15.2% 6.3% 13.5%
0.00447
12.8% 15.2% 6.3% 10.7%
0.00339
29.6% 20.0% 3.5% 17.4%
0.00739
22.5% 20.0% 3.5% 14.5% 0.00563 40.1% 22.6% 6.9% 24.1%
0.01097
24.8% 22.6% 6.9% 17.2% 0.00571 25.1% 20.0% 3.5% 15.5% 0.00619
Curr
ent
Law
100%
Dividend
and
Capital Gains Exclusion
Curr
ent
Law
100%
Dividend
and
Capital Gains Exclusion
Curr
ent
Law
100%
Dividend
and
Capital Gains Exclusion
100%
Dividend Exclusion and DRIP
Mar
ginal Ef
fective T
otal T
ax Rate
TABLE 1
SHAREHOLDER TAX RELIEF
AND INVESTMENT INCENTIVES: SENSITIVITY
T
O
KEY
PARAMETER
tal gains would potentially offer substan-tially improved investment incentives.11
Under the old view, the proposals would reduce the tax burden on corporate invest-ment which would translate into a reduc-tion in the economy wide marginal effec-tive total tax rate of 9 percent and 24 per-cent, respectively. The lower corporate tax cost also levels the playing field by reduc-ing differences in the taxation of invest-ment across sectors (i.e., the corporate business sector, the noncorporate business sector, and owner–occupied housing). This improved tax neutrality is reflected in the calculations by a reduction in the standard deviation in the cost of capital,12
compared to current law.13 Not
surpris-ingly, 100 percent exclusion of both divi-dends and capital gains does substantially more to reduce effective tax rates and im-prove tax neutrality than does a 50 per-cent exclusion of dividends.
Debt vs. Equity Financing
The investment incentive benefits of integration are sensitive to underlying parameter assumptions. One important assumption is the extent to which corpo-rate investment is financed with debt rather than with equity. With a high debt/ asset ratio, the ability of the company to deduct interest means that a large fraction of corporate investment escapes current law’s double tax on corporate equity, im-plying that current law does little to dis-courage corporate investment (Stiglitz, 1973), although the double tax itself may
encourage a high degree of leverage if borrowing decisions are affected by taxes. Consequently, because the existing distor-tion of the double tax is smaller, integra-tion has less potential for improving tax neutrality when corporate investment is largely debt financed than it does when corporate investment is largely equity fi-nanced.
These effects are illustrated in Table 1 in the calculations labeled high debt, which modify the old view calculations by raising the leverage ratio from 35 per-cent to 65 perper-cent. With high debt, a 100 percent exclusion would lead to a smaller reduction in the effective tax rate for in-vestment in the corporate sector and to a smaller reduction in the standard devia-tion in the cost of capital, compared to the old view calculations.
Perhaps surprisingly, in the high debt calculations, 100 percent exclusion re-verses the existing tax bias against corpo-rate investment; the effective tax corpo-rate on corporate investment falls below the ef-fective tax rate on noncorporate business investment. This reversal occurs in part because corporations receive a subsidy on debt financed investment that is much larger than that granted to investment by noncorporate businesses. The subsidy on debt financed investment arises because corporations deduct interest at a tax rate substantially higher than the tax rate gen-erally imposed on interest income (see, e.g., Mackie, 2002). One aspect of this sub-sidy arises because interest is not indexed
11 The calculations in the table are capital stock weighted averages across multiple types of equipment and structures, as described in Mackie (2002). One limitation of the stocks used in Mackie (2002) is that they are based on NIPA data and so include in the corporate sector S corporations that are not subject to double taxa-tion. The capital stocks used here, however, have to be adjusted to move assets owned by S corporations into the noncorporate sector, based on tax return data on asset holdings of S corporations by industry.
12 The standard deviation is the square root of the (capital stock weighted) sum across all investments of the squared deviation of each investment’s cost of capital from the mean cost of capital. If all investments were taxed equally, the standard deviation would be zero because all investments would have a cost of capital equal to the mean. Differential taxation creates differences in the cost of capital across investments (i.e., nonneutralities) and raises the standard deviation above zero. The greater are the tax differences across in-vestments, the larger is the standard deviation in the cost of capital.
13 The standard deviation is not a substitute for an explicit welfare cost calculation that includes both changes in tax costs and elasticities that reflect how responsive investors are to changes in tax costs. The standard devia-tion is meant to be suggestive of the relative tax neutrality of current law and each proposal.
for inflation. The corporation can deduct the inflation component of the nominal interest rate, an amount that corresponds to a repayment of principal rather than income, at a higher tax rate than that im-posed on interest recipients. 14 In addition,
the tax rate differential leads to a tax sub-sidy for investments entitled to such pref-erences as accelerated depreciation. The corporation takes tax deductions for such preferences at a tax rate higher than that imposed on the income that the invest-ment earns.
Old View vs. New View
Another important assumption is that the old view of dividend taxes informs the calculations. Because the capital gains tax rate is smaller than the dividend tax rate, the tax cost of corporate equity financed investment under current law is smaller under the new view than it is under the old view of dividend taxes. In addition, under the new view integration’s reduc-tion in the tax rate on dividends does not reduce the tax cost of corporate invest-ment. Consequently, to the extent that one favors the new view, the benefits of share-holder tax relief would be smaller than under the old view. Nonetheless, the cal-culations in Table 1 suggest that the in-vestment incentive effects may continue to be substantial as long as tax relief is provided to retained earnings as well as dividends. Even under the new view, shareholder tax relief would reduce the corporate marginal effective total tax rate by over 7 percentage points. In evaluat-ing integration, however, it is important to recall that under the new view a sub-stantial part of the revenue cost of
inte-gration goes to providing a windfall benefit to shareholders, in the form of an increase in share values caused by elimi-nating previously capitalized dividend taxes, rather than to reducing the marginal tax cost of investment in the corporate sector. Without shareholder level taxes, q would rise to one. Even under the old view, windfall benefits to shareholders can occur in the short run if the stock of corporate capital cannot expand immedi-ately to its new equilibrium level. The tax reductions that generate these windfalls raise the revenue cost of providing relief from double–taxation.15
High Tax Rate Marginal Investor
The benefits of integration also depend on the statutory tax rates on capital income that underlie the calculation of the effec-tive tax rates. Statutory tax rates in turn reflect assumptions about the marginal in-vestor, a subject on which there is little agreement in the economics profession (Auerbach, 2001). The tax rates used in the previous calculations are economy wide averages, reflecting the marginal rate on taxable investors as well as a zero rate for tax exempts. In such calculations, all cur-rent investors are marginal investors, and are included with weights reflecting their ownership of the existing capital stock.
A competing view is that high tax cost investors are the marginal investors. In addition to theoretical arguments that the high cost investor might be the last in, there is a body of empirical work suggest-ing that the marginal corporate investor might face a high tax rate (e.g., Harris and Kemsley, 1999; Gentry, Kemsley, and Mayer, 2003). This view is reflected in
14 To illustrate this subsidy, consider a debt financed investment that receives economic depreciation, so the z = δ/(r – π + δ). In this case, the cost of capital is (r – π)/(1 – u), where r = i(1 – u). If interest income is taxed at rate θ, lender must charge an interest rate of i = (s + π)/(1 – θ) in order to earn his required after–tax rate of return. Hence, the cost of capital is s/(1 – θ) – π(u – θ)/((1 – θ)(1 – u), which implies a subsidy for debt when u > θ. The cost of capital is less than s/(1 – θ), so the marginal effective tax rate is less than θ.
15 Concentrating tax relief on new equity financed investment would eliminate these windfalls and lower the revenue cost of integration, but in practice this can be difficult to do and offers uncertain net benefits (Auerbach, 1989b).
Table 1 by calculations that exclude tax exempts and so include only taxable in-dividual investors in the construction of the statutory tax rates.16
At the higher statutory tax rates, cur-rent law’s tax penalty on corporate invest-ment is considerably greater than it is in the earlier calculations. Moreover, the higher tax penalty is caused by higher shareholder taxes. Consequently, by elimi-nating shareholder level taxes, integration does much more to reduce the corporate effective tax rate and to improve tax neu-trality than it does when lower tax rates underlie the calculations.
Exclusion via a DRIP and the Taxation of Inflation
Rather than eliminating or reducing the capital gains tax on the sale of corporate shares, the benefits of integration could be extended to retained earnings by allowing (or requiring) companies to have dividend reinvestment plans (DRIPs), or in some other way to adjust the basis of shares in order to eliminate the capital gains tax on share price rises caused by retained earn-ings.17 DRIPs were discussed in U.S.
Trea-sury (1992) and a DRIP variant is a feature of the Bush Administration’s dividend tax relief proposal.
It is unclear how to account for a DRIP in the model outlined above. Following the basic King–Fulleton approach, adopted by Auerbach (1996), the firm would split the nominal equity return (the real return plus inflation) between
divi-dends and retentions. In such a model, a DRIP might eliminate the tax on the part of the nominal rate of return that is re-tained and reinvested in the company (or, formally, distributed as a dividend and then reinvested), in the same way that a dividend exclusion eliminates the tax on the part of the nominal return that is dis-tributed as a cash dividend. Yet this treat-ment would seem to combine a DRIP with inflation indexing of capital gains on stock and would not distinguish between a DRIP and a capital gains exclusion.
An alternative modeling strategy as-sumes the inflation component of the nominal return accrues as an increase in share values. In this approach, the firm di-vides real earnings, earnings (re – π), be-tween dividends and retentions and in-flation is taxed to the shareholder as a capital gain on the appreciation of his shares. This alternative approach is devel-oped and used in Auerbach (1983a and b), Gravelle (1994), and U.S. Treasury (1992). It allows one to distinguish between a DRIP, capital gains indexing, and a capi-tal gains exclusion while avoiding the seeming inconsistency between the taxa-tion of dividends that are distributed as cash and those that are retained and rein-vested. It also seems consistent with the assumption of the cost of capital model outlined above that the firm holds the as-set forever.
The final column of Table 1 presents the calculations based on this alternative modeling of the taxation of the inflation return to equity18 for a combination of a
16 In these calculations, the corporate tax rate is 35 percent, the tax rate on dividends is 26.4 percent, the effective accrual tax rate on capital gains is 9.6 percent, the tax rate on interest income is 23.2 percent, the tax rate on homeowners is 23.3 percent, and the tax rate on noncorporate business income is 27.2 percent.
17 A dividend tax relief proposal would have to explicitly disallow DRIPs if such relief were not intended, since shareholders may voluntarily participate in DRIPs under current law. There may be little tax incentive to participate in voluntary DRIPs under a partial (e.g., 50 percent) dividend exclusion, and our calculations for a 50 percent exclusion do not include an effect from DRIPs.
18 Given our assumed tax rates, after–tax real return, and inflation rate, our 50 percent nominal dividend payout ratio implies that about 80 percent of the real return on corporate equity (re – π) is paid out as a dividend,
which we use as the real payout ratio in these calculations. This payout ratio is higher than the historical average real dividend payout ratio of about 2/3s reported by Gravelle (1994), but is closer to the 72 percent real payout ratio assumed in the Treasury’s 1992 Integration Report.
dividend exclusion plus a mandatory DRIP. Calculations for current law19 and
for a 100 percent shareholder exclusion would be unaffected by the change in the modeling of inflation. Under this alterna-tive modeling of inflation, the combina-tion of a dividend exclusion and a DRIP does less to lower the tax cost imposed on income from corporate investment than does a dividend exclusion plus a capital gains exclusion, because the DRIP leaves in place a tax on inflationary in-creases in asset value.
Other Issues
The model used to calculate effective tax rates assumes that the U.S. economy is closed to international capital flows. The extent to which capital is internationally mobile is an unsettled issue (Feldstein and Horioka, 1980; and Harberger, 1980), but it is clear that the effects of capital income taxes can be substantially different in an economy open to international capital flows than in an economy closed to such flows.
International capital flows break the link between investment in the U.S. and saving by U.S. residents (Slemrod, 1988), and hence break the equivalence between taxes on investment and taxes on saving. One implication is that U.S. personal come taxes may do less to discourage in-vestment in the U.S. economy. A corollary is that U.S. shareholder level taxes may do less to discourage investment in the corporate sector of the U.S. economy, relative to investment in the U.S. non-corporate business sector or in owner–oc-cupied housing, because the double tax does not translate into a higher cost of capital for the U.S. corporate sector. Thus, reducing or eliminating taxes on U.S. shareholders may do little to promote a
more efficient allocation of capital within the U.S. Nonetheless, reducing personal taxes may still encourage more saving by U.S. citizens, even when investment in-centives for U.S. companies are not af-fected by taxes on their U.S. sharehold-ers. Analyzing integration in an open economy raises a number of additional issues (U.S. Treasury, 1992; and Grubert and Mutti, 1994) and is beyond the scope of this paper.
The calculations reported in Table 1 take no account of replacement taxes; they implicitly assume that nondistorting lump–sum taxes are used to finance any revenue shortfall. By ignoring the distor-tions that would be caused by real world taxes that are needed to make–up the lost revenue, the calculations overstate any implied benefits to the economy for inte-gration. This overstatement is larger, the larger is the tax cut afforded corporate investment. Consequently, taking account of differing revenue costs would likely make less generous plans, such as a 50 percent dividend exclusion, compare more favorably with more generous plans, such as a full shareholder level ex-clusion.
Although our cost of capital calcula-tions assume that either all firms operate according to the old view of dividends or all operate according to the new view of dividends, this assumption may not be appropriate. As emphasized by Auerbach and Hassett (2003a), some firms may be on each margin, in addition, firms may change margins according to their circum-stances. Under current law, the tax cost faced by old view firms is higher than that faced by new view firms, thereby creat-ing a potential distortion in the allocation of investment. Integration can reduce or eliminate this distortion, thereby provid-ing additional economic benefits.20
19 For current law, this is a consequence of using a real dividend payout ratio that is equivalent to the nominal payout ratio used in the earlier calculations.
THE PRESIDENT’S PROPOSAL
We turn now to consideration of the President’s proposal, including its EDA accounts. The President’s proposal re-sembles a 100 percent shareholder dividend exclusion combined with a DRIP that ex-tends the benefits of integration to earnings retained by the company. The President’s proposal, however, limits shareholder tax relief to income that has been fully taxed at the company level. It does this through the use of an EDA. Only earnings out of the company’s EDA are excludable by share-holders. Earnings in excess of the company’s EDA are taxable to sharehold-ers. EDA is calculated as Tax/u – Tax.
Tax Preferences, Investment Incentives, and Integration
Corporate tax preferences are special de-ductions, credits, and exclusions that act to reduce the corporate level tax on invest-ment income below the statutory tax rate.21
Accelerated depreciation deductions are a common example of a tax preference. Cur-rent U.S. tax law does not allow corporate tax preferences to be passed through to shareholders. Thus, corporate tax prefer-ences can reduce the tax paid by the com-pany but do not directly reduce the tax paid by the shareholder.
Although perhaps not immediately ob-vious, the K–F model conforms to this le-gal structure. To see this quickly, recall the general result that expensing reduces the marginal effective tax rate to zero. The K– F model obtains this result for the mar-ginal effective corporate tax rate (MECTR), that is, the difference between the cost of capital and the firm’s real discount rate (rc – π), expressed as a percentage of the cost of capital, as is apparent by setting z = 1 equation [2].
Expensing, however, does not reduce the marginal effective total tax rate to zero. For example, for an equity financed in-vestment and with no inflation, with ex-pensing the METTR = Te. The shareholder tax still applies. This occurs because the company’s tax deduction is too small to offset the shareholder’s future tax liabil-ity on the cash flow. To offset both com-pany level and shareholder level taxes, both the shareholder and the company must deduct the cost of the investment; the preference would have to be passed through. The same result occurs if the preference comes as a tax exemption for the cash flow. With u = 0, the MECTR = 0, but the METTR = Te; the preference is not passed through to the shareholder.
Tax Preferences and Integration
Because of corporate tax preferences, simply exempting from shareholder level taxation all income from corporate equi-ties can be inconsistent with the policy goal of taxing corporate income once. Pure pref-erence income, for example, is taxed only at the shareholder level. A simple share-holder exemption would eliminate the single level of tax, making the income from such an investment tax exempt in total, i.e., METTR = 0. It is this problem that the EDA is intended to address by insuring that preference income continues to be taxed at the shareholder level so that a single level of tax is collected on all corporate profits.
Modeling the President’s Proposal with its EDA
We model the EDA as an additional cash flow earned by the firm and paid out to the shareholder in the form of tax ex-emption certificates.22 With the EDA,
capi-tal market equilibrium is given by
21 We are defining preferences relative to an idealized income tax. Not all such items would be considered preferences relative to a consumption tax baseline.
22 Following the general approach taken in the cost of capital literature based on the neoclassical theory of investment, the effect of debt finance on the investment’s cost of capital, including its effect through the EDA,
[1.1] 1 = ∫(1 – u)ce–(r–π+δ)tdt + uz + x∫EDAte–rtdt
where,
EDA = (Tax)/u – Tax = (u(taxable income)/ u) – u(taxable income) = (1 – u){ce(π–δ)t – (tax depreciation)t },
x = a factor reflecting taxes reduced by the EDA,
and the other terms are as usually defined (the investment tax credit has been ig-nored).
This equilibrium condition differs from that in equation [1] by the addition of the present value of the tax savings from the EDA account.
Integrating, solving for c, and subtract-ing economic depreciation gives
[2.1] ρc= (r – π + δ){1 – χz}/(1 – χ) – δ, as an expression for the cost of capital, where χ = u – x(1 – u) is the “EDA ad-justed” corporate tax rate.
In this formulation, one important ef-fect of the EDA is to act as a reduction in the corporate tax rate from u to χ. To com-plete the modeling of the EDA, we must specify the firm’s nominal discount rate by relating it to the investor’s after–tax opportunity cost of funds, s + π, and specify x, the EDA tax adjustment factor. To facilitate our analysis, we consider two cases, one in which a firm’s dividends
permanently exceed its EDA and the other in which its dividends permanently are less than its EDA. Following our assump-tion that financial policy is not affected by taxes, we assume that the relationship between dividends and the EDA is exog-enous. A complete modeling would allow firms to choose the relationship between dividends and EDA, taking account of restrictions imposed by the degree of pref-erence income earned by the firm, as well as allowing for such other factors as varia-tion overtime between a company’s per-manent income and its taxable income, and the severity of agency costs. Such complications are beyond the scope of this paper, but serve to limit the generality of our results.23 We will first examine an
eq-uity financed investment and then con-sider debt finance.
D > EDA
In this case, the firm always pays divi-dends in excess of its EDA. According to the rules specified in the President’s pro-posal, all of the EDA would apply to divi-dends. Hence an additional dollar of EDA would entitle the shareholder to a tax re-duction of $m. Consequently, the marginal investment’s after–tax rate of return is D(1 – m)/q + RE(1 – ω) + mEDA/q where D is dividends, RE is retained earn-ings, q is the marginal value of a dollar’s worth of capital in the corporation (i.e.,
is captured through the discount rate, as explained below. Hence, the EDA measure included in the cash flow in equation [1.1] is not reduced directly for interest deductions, in the same way that the tax payments on the investment are not reduced to account for interest in equation [1].
23 We do not consider the case in which the firm sets dividends equal to EDA and finances new equity invest-ment by issuing new shares. While such a policy might help to maximize the tax saving from the President’s proposal, it nonetheless might not be universally observed. It would be easier to implement to the extent that the firm did not earn preference income. Even then, however, it might be difficult to implement to the extent that the firm experiences differences between its permanent income and its transitory income. For example, a firm in a highly cyclical industry or that otherwise has a large difference between permanent and transitory income might not wish to let its dividend policy vary step for step with its taxable income. In addition, the separation of ownership from control may causes dividends to be less than EDA for some firms. The strategy of setting dividends equal to EDA would be more difficult for a firm with significant tax preferences, since doing so would not let it distribute all of its earnings as a dividend. If the firm must distribute earnings via dividends, then it must be the case that dividends exceed EDA to the extent that there is preference income.
the price of the investment). Note that the investor’s return includes the tax savings from the EDA account. The investor re-quires that this after–tax rate of return equal his opportunity cost, so that in equi-librium
s + π = D(1 – m)/q + RE(1 – ω) + mEDA/q. For an old–view firm on the new share issue margin q = 1. Rearranging the right– hand side and defining P as the dividend payout ratio (P = D/(D + RE)), gives
[3.1] (s + π)/(1 – Pm – (1 – P)ω) = D + RE + mEDA/(1 – Pm – (1 – P)ω) so the firm’s discount rate is given by
[3.2] re = (s + π)/(1 – Pm – (1 – P)ω). The value of x is apparent from equa-tion [3.1]. A one dollar addiequa-tion to EDA generates a tax reduction of m. But this is an after–tax amount. Recall that the cash flows from the EDA in [1.1] are dis-counted at the pre–tax discount rate (they are on a pre–tax basis); hence we must express the benefit from the EDA in pre– tax terms by grossing up by shareholder taxes. So
x = m/(1 – Pm – (1 – P)ω).
We also can now interpret the “EDA adjusted” tax rate, χ. The EDA adjusted tax rate shows the net corporate level tax that is paid, after accounting for the share-holder level tax savings from the EDA. That is, corporate tax is paid at rate u, but each dollar of after–tax corporate income generates shareholder level tax savings of x, giving χ as the net tax rate on corporate income.
Consider now a new view firm that fi-nances marginal investment by retaining earnings. Because the EDA is exhausted, at the margin both the dividend tax and the capital gains tax continue to apply. Since we assume that the firm is paying dividends, shareholders must be indiffer-ent between dividends and retindiffer-entions so 1 – m = q(1 – ω), or q = (1 – m)/(1 – ω). In equilibrium, the firm’s after–tax rate of return is s + π = D(1 – ω) + RE(1 – ω) + m(1 – ω)EDA/(1 – m), so the required pre–tax rate of return, the firm’s discount rate, is
[3.3] re = (s + π)/(1 – ω),
and the EDA tax adjustment factor is24
x = m/(1 – m).
D < EDA
If the firm pays dividends that are less than its EDA, then according to the rules of the President’s proposal the EDA is used first to reduce taxes on dividends and then the remaining EDA is used to increase shareholder basis to relieve tax on earnings that are retained within the company. Consequently, the share-holder’s after–tax rate of return is D(1 – m)/q + RE(1 – ω) + mD/q + ω(EDA – D)/ q = D(1 – ω)/q + RE(1 – ω) + ωEDA/q. In equilibrium the investor requires that
s + π = D(1 – ω)/q + RE(1 – ω) + ωEDA/q. Under the old view q = 1, so the firm’s discount rate is
[3.4] re= (s + π)/(1 – ω).
This differs from the discount rate under current law as well as from the dis-count rate that would apply under a
24 The adjustment factor is not m/ (1 – ω) because of tax capitalization. The tax savings of m costs q, and q = (1 – m)/(1 – ω), so x = (m/q)/(1 – ω) = m/ (1 – m). The “gross up” intuition still works: tax savings with an after– tax value of m/q have to be grossed up by capital gains taxes on the investment because the flows in [1.1] are on a pre–shareholder tax basis.
straight shareholder level exclusion. The EDA eliminates the dividend tax rate, but at the margin an additional dollar of EDA translates into an additional dollar of ba-sis adjustment. So the capital gains tax burdens the investment’s nominal return.
The EDA tax adjustment factor is
x = ω/(1 – ω).
Under the new view (retained earnings margin), q = 1 because dividends and capi-tal gains are both taxed at the rate ω. So re = (s + π)/(1 – ω)
and
x = ω/(1 – ω).
For a firm paying dividends that are less than its EDA, there is no difference be-tween the old view and the new view of dividend taxes.
Debt Finance
Debt finance can be included by com-puting the discount rate as
rd = i(1 – χ).
The discount rate, the after–tax interest rate, depends on which equity regime the firm is in, since that determines the tax rate χ. The appropriate tax rate is χ rather than u because the interest deduction re-duces taxable income and hence the EDA. That is
rd = i(1 – u) + xi(1 – u) = i(1 – (u – x(1 – u)) = i(1 – χ).
With a mix of debt and equity, the corpo-rate discount corpo-rate (rc) is a weighted aver-age of that on debt and that on equity, with the weights determined by the proportion of financing that is debt, taking account
of the undervaluation of equity that can occur under the new view.
EDA Intuition
Before proceeding to calculations that compare the effects of the EDA on invest-ment incentives with those under other forms of shareholder tax relief, it is worth-while working a bit with the EDA analy-sis in order to get a feel for how it affects incentives. A shareholder exclusion with an EDA is substantially different from a straight shareholder exclusion or from a dividend exclusion plus a DRIP.
1. Compared to a straight exclusion, or the combination of a dividend exclu-sion and a DRIP, an EDA generally provides less tax relief on invest-ments that receive tax preferences. This is a primary purpose of the policy. This can be illustrated easily if we ignore inflation and consider an equity financed investment that is expensed (z = 1) and whose in-come is entirely paid out as a divi-dend by a firm for whom D > EDA. In such a case, the cost of capital would be rc, the firm’s after–tax dis-count rate. Without an EDA, rc = s, so that the METTR = 0. With an EDA, however, rc = s/(1 – m) and the METTR = m, the shareholder’s tax rate on dividend income. This point has been emphasized elsewhere, e.g., Esenwein and Gravelle (2003). 2. Because of the effects of the EDA,
un-der the President’s Proposal it is pos-sible (though not necessarily likely) that some investments would face a higher effective tax rate than they do under current law. This occurs when an investment is subsidized in the sense of facing a negative marginal effective corporate tax rate. The intu-ition of this result can be appreciated easily in equation [1.1] by positing tax breaks (e.g., accelerated deductions
and credits) sufficient to give the EDA a negative present value, so that the EDA reduces the present value of the investment’s cash flow.
3. The EDA can provide a larger incen-tive to invest than would either a simple shareholder exclusion of dividends and capital gains, or a dividend exclusion plus a DRIP. Al-though the EDA is generally Al-thought of as limiting the tax benefits of in-tegration compared with a straight exclusion, this does not always oc-cur at the margin. Suppose that the inflation rate is zero and consider the case of an investment that receives no preferences25 undertaken by a
firm for which dividends exceed the EDA. For this firm the cost of capi-tal is (rc)/(1 – χ). Substituting rc = s/ (1 – Te), χ = u – m(1 – u)/(1 – Te), and Te = Pm + (1 – p)c, shows that the cost of capital is s/{(1 – u)(1 + m – Te)}. This is less than the cost of capital with a straight exclusion of income, s/(1 – u), because m > Te. That is, the EDA provides shareholder tax relief valued at m on an investment which is subject to shareholder tax at rate Te. For an old–view firm, only if P = 1 would the EDA give the same mar-ginal tax cost as obtained under a straight shareholder exclusion. For a new view firm with D > EDA, the EDA never would provide the same incentives as a straight exclusion be-cause for such a firm the cost of capi-tal always will be lower with an EDA than without an EDA.
4. Although a straight shareholder ex-clusion, or a dividend exclusion plus a DRIP, would have no direct effect on the tax cost of a debt financed in-vestment, by reducing the tax rate at which firms evaluate interest
de-ductions, an EDA potentially affects incentives on both debt financed and equity financed investments. As dis-cussed above, corporate debt can be subsidized when the tax code mismeasures income and the corpo-rate tax corpo-rate exceeds the tax corpo-rate paid by lenders on their interest income. By lowering the tax rate at which the firm evaluates interest deductions, the EDA reduces this benefit,26
thereby potentially improving neu-trality between debt and equity fi-nanced corporate investment. 5. With a straight shareholder
exclu-sion, or a dividend exclusion plus a DRIP, a firm’s dividend policy, or the relation of its dividends to its taxable income, has no effect on investment incentives. In contrast, under the President’s proposal, for a similar marginal investment, the cost of capital can be much different for a firm who expects D < EDA than for a firm who expects D > EDA. Gen-eral conclusions are not possible. For example, for an equity financed in-vestment, the cost of capital can dif-fer depending on whether the firm is at the new share issue margin (old view) or the retained earnings mar-gin (new view), on the firm’s pay-out ratio, and on the degree of pref-erence income earned on the mar-ginal investment. As noted above, when there is no preference income, both old view and new view firms face a lower tax cost of equity fi-nanced investment if D > EDA than they do if D < EDA.27 Sufficient
amounts of preference income, how-ever, can reverse this result for both new view and old view firms. For old view firms, all else equal, the lower the dividend payout ratio,
25 No preference means that the marginal effective corporate tax rate equals the statutory corporate tax rate. 26 In some cases the EDA can turn the current tax subsidy for debt into tax penalty, since it is possible that χ < θ.
Such could be the case for an old view firm for whom D > EDA that was owned by a high bracket investor. 27 For an old view firm, the tax cost is the same if the payout ratio is one.
the more likely it is that the cost of capital will be higher when D < EDA than when D > EDA.
6. With a straight shareholder exclu-sion, or a dividend exclusion plus a DRIP, the cost of capital is the same for new view and as it is for old view firms. In contrast, under the President’s proposal, for firms ex-pecting that D > EDA the cost of capital for a firm at the new share issue margin (old view) can differ substantially from that for a firm on the retained earnings margin (new view). On a similar investment, it is often (but not always) the case that the old view firm will face at least the same tax cost as that faced by a new view firm because of differences in the discount rate and in the EDA tax adjustment factor, x.
7. A straight exclusion would impose no shareholder tax on the inflation component of the return on corpo-rate equity financed investment. In contrast, integration with an EDA would continue to tax inflation. This is immediately apparent from the difference in the discount rates. With an exclusion, the discount rate for a corporate equity financed invest-ment is s + π, while with an EDA it is (s + π) grossed up by the appro-priate tax, e.g., by Pm + (1 – P)ω for an old view firm with D > EDA. The combination of a dividend exclusion plus a DRIP, however, could tax the inflationary component of the nomi-nal return, even if the proposal did not contain an EDA.
8. Relative to a straight dividend ex-clusion, or to a dividend exclusion plus a DRIP, an EDA has an uncer-tain effect on tax neutrality. By raising the tax cost of corporate in-vestments that receive some tax pref-erences, it reduces neutrality as be-tween corporate and noncorporate
investments. By creating tax differ-ences between old view and new view firms, it reduces neutrality at that margin. Relative to a straight exclusion, but not necessarily to a DRIP, by taxing the inflation return on corporate equity financed invest-ment, the President’s Proposal re-duces neutrality between the corpo-rate and noncorpocorpo-rate sectors. In contrast, by reducing the tax advan-tage on corporate debt financed in-vestment, the President’s proposal improves neutrality as between debt and equity financed corporate in-vestments. By raising the tax cost of corporate preference investments relative to corporate non–preference investments, it acts to improve tax neutrality within the corporate sec-tor. Finally, by lowering the tax cost of some corporate fully taxed invest-ments, it helps to promote neutral-ity between the corporate and the noncorporate sectors.
Further complicating the comparison is the difference between the revenue cost of an EDA and, say, a dividend ex-clusion plus a DRIP. On neutrality grounds, an EDA is likely to compare more favorably with a revenue neutral partial dividend exclusion plus (partial) DRIP than it does with the more costly policy of full dividend exclusion plus (full) DRIP.
Rationales for the EDA
The discussion above suggests that an EDA can have incentive effects that differ substantially from those obtained under simpler forms of shareholder tax relief. These differences moreover do not neces-sarily lead to more neutral taxation of in-vestment income, nor do they necessarily lower taxes on capital income.
An EDA, however, offers several im-portant potential benefits. First, as men-tioned above, an EDA helps to ensure that corporate income is taxed once, a policy goal that is attractive to some in the tax policy community. Second, the EDA helps hold down the tax revenue cost of inte-gration. It does this by targeting share-holder level tax relief in two ways: (a) it focuses the benefits of integration on cor-porate income that has been fully taxed, and (b) it reduces windfalls by limiting the benefits of integration to income that has been earned since the date of enact-ment (i.e., generally provides prospective tax relief).28 Third, by limiting shareholder
level tax relief to income that has been taxed at the corporate level, an EDA helps to reduce the incentive to engage in ag-gressive tax planning. It thus reduces the incentive for corporate tax shelters, a problem that many worry has been grow-ing significantly in recent years (U.S. Trea-sury, 1999). Fourth, by giving sharehold-ers clearer information about corporate tax payments than is available form cor-porate annual reports, an EDA may help to improve informational transparency and promote informed investment choices and responsible corporate gover-nance.
The Effect of the President’s Proposal on Investment Incentives
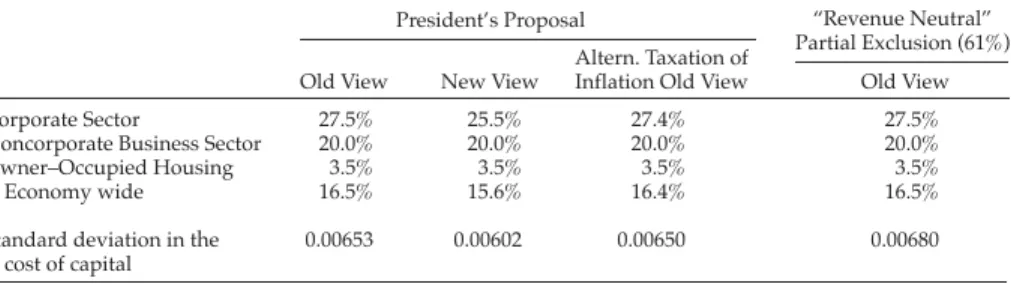
Table 2 shows the effects of the President’s proposal on the level and dis-persion of marginal effective tax rates. For purposes of these calculations, we need to make some assumption about the pro-portion of investment/capital that is made or held by firms for whom D > EDA and for whom D < EDA. Based on historical tax and financial data, we assume that 40 percent of corporate investment is from firms for whom D > EDA and 60 percent from firms for which D < EDA.
Not surprisingly, comparing the calcu-lations in Table 2 with those in Table 1 sug-gest that the President’s proposal may do less to reduce the tax burden on corpo-rate investment than would a full share-holder exclusion. It also would do slightly less to reduce the marginal corporate tax burden than would a dividend exclusion plus a DRIP, but more than would a 50 percent dividend exclusion. The neutral-ity results follow in step.
Three factors account for the higher cor-porate effective tax rate under the President’s proposal compared to a straight shareholder exclusion. One is that the EDA stops preferences from being
TABLE 2
THE EFFECTS OF THE PRESIDENT'S DIVIDEND TAX RELIEF PROPOSAL ON THE MARGINAL EFFECTIVE TOTAL TAX RATE
President’s Proposal “Revenue Neutral” Partial Exclusion (61%) Old View New View
Altern. Taxation of
Inflation Old View Old View Corporate Sector
Noncorporate Business Sector Owner–Occupied Housing
Economy wide Standard deviation in the
cost of capital
27.5% 20.0% 3.5% 16.5% 0.00653
25.5% 20.0% 3.5% 15.6% 0.00602
27.4% 20.0% 3.5% 16.4% 0.00650
27.5% 20.0% 3.5% 16.5% 0.00680
28 This is a looser restriction than limiting the tax reductions to income on investments that have been made since the date of enactment. The EDA account stops the company from distributing tax free previously accu-mulated but retained corporate profits. It does not stop the company from distributing tax free new income earned from investments made prior to the date of enactment.
passed through. Another is that the President’s Proposal continues to tax the inflation return on corporate equity, whereas a full shareholder exclusion would not tax inflation. Finally, by lower-ing the tax rate at which corporations evaluate their interest deductions, the EDA raises the tax cost of a debt financed corporate investment.
Because a dividend exclusion with an EDA does not lower the tax cost of a cor-porate investment relative to the tax cost on income from investment in other sec-tors as much as does a full exclusion (with or without a DRIP, but without an EDA), in these calculations adding an EDA acts to reduce tax neutrality. Our calculations suggest, however, that within the corpo-rate sector the EDA acts to promote neu-trality by reducing the benefit of tax pref-erences and hence equalizing effective tax rates across investments.29 Unfortunately,
this effect is not enough to offset the neu-trality reducing effects of the EDA on cor-porate vs. other investment.
In terms of “bang for the buck” the President’s proposal might compare more favorably to a full shareholder exclusion because EDAs reduce the revenue cost of providing shareholder level tax relief. Stated equivalently, an EDA is likely to compare more favorably to a straight per-centage exclusion that had the same rev-enue cost. While we don’t know the
pre-cise equal revenue partial exclusion, we implement the idea of a revenue con-straint by calculating the percentage ex-clusion of dividends and capital gains on corporate shares that would give the same marginal corporate effective tax rate as the President’s proposal. In the calculations reported in Table 2, this turns out to be a 61 percent exclusion under old view as-sumptions. By construction, a 61 percent exclusion has the same effect on the cor-porate and economy wide weighted av-erage marginal effect tax rate as does the President’s proposal.30 The exclusion also
does about the same as the President’s proposal to promote neutrality, as shown by a standard deviation in the cost of capi-tal that is about the same under the two tax plans.
THE 5/15 PLAN
As this paper is being completed, a pro-posal to reduce the tax rate on dividends and capital gains to 15 percent, or 5 per-cent for low income taxpayers (falling to zero in 2008), has been enacted and signed into law as part of the Jobs and Growth bill. Table 3 shows the effect of this pro-posal on the level and dispersion of mar-ginal effective total tax rates.31
Compared to current law, 5/15 looks best in calculations based on the old view of dividend taxes, where it lowers the
29 These calculations are not reported in Table 2.
30 The exclusion applies to both the real and the inflation component of the return on an equity financed invest-ment in the corporate sector. To the extent that the exclusion was limited to the real part of the return, e.g., as with a DRIP, the equivalent exclusion percentage would be higher.
31 These calculations assume a 14.5 percent statutory tax rate on dividends and on capital gains. The 5/15 proposal also would reduce taxes on capital gains earned on investment in the noncorporate business sector, but our model does not capture these effects.
TABLE 3
THE EFFECTS OF THE 5/15 PROPOSAL ON THE MARGINAL EFFECTIVE TOTAL TAX RATE Old View New View High Debt, Old View Corporate Sector
Noncorporate Business Sector Owner–Occupied Housing
Economy wide
Standard deviation in the cost of capital
29.4% 20.0% 3.5% 17.3% 0.00734
27.7% 20.0% 3.5% 16.6% 0.00685
17.6% 15.2% 6.3% 12.4% 0.00393