1
Checking-account Activity, Account Costs, and Account Closure among
Households in Low- and Moderate-Income Neighborhoods
Katherine Samolyk
*Tim Critchfield
Javier Galindo
Colin Watson
Very Preliminary. Do not cite without the permission of the authors.
Oct 11, 2013
All of the authors are staff in the Office of Research at the Consumer Financial Protection Bureau. This paper presents self-directed independent research, and the views expressed are those of the author[s] and do not necessarily represent those of the Director of the Consumer Financial Protection Bureau or other Bureau staff.
2
1. Introduction
Many U.S. households do not have a transaction account at a depository institution (hereafter referred to as a bank account and a bank, respectively). A sizable share of households that have bank accounts nonetheless go to nonbank alternative financial services (AFS) providers to obtain transaction or credit services. Reasons given for why AFS providers are used include cost, convenience, and lack of access to services at banks. Available evidence yields a fairly consistent set of consumer demographic characteristics that tend to be associated with the lack of a bank account or with the use of AFS providers. Much less is known about how households use their bank accounts and how these usage patterns are associated with the costs of account ownership. Little is known about the determinants of account closure, which can make it difficult to open a new account.
This paper is intended to help fill this void. We use data for a large random sample of consumer checking accounts at several large depository institutions to examine the costs associated with checking account ownership and use and the customer and account characteristics associated with involuntary account closure. The data came from confidential supervisory information obtained through the examination process. This information permits us to construct a wide array of measures of average monthly account activity—including average monthly fees incurred by each account. The data also allow us to observe if and when an account was closed and the reason for closure. We use this information to analyze accounts that we classified as involuntary closures during a 90-day period and to compare them to accounts that remained open during that period. We also analyze the fees incurred by account holders during the 12 months prior to the closure window. To complement existing research about households that do not own bank accounts or that use transaction or credit services from AFS providers, we examine how account outcomes are related to demographic characteristics, albeit measured for the census tract where the primary account holder resides, since we do not directly observe account holder
characteristics.1 We examine the extent to which account-related factors explain relationships
between tract demographics, monthly account fees, and involuntary account closures. Evidence regarding these relationships is important for the design of products and policies to foster sustainable banking relationships.
We find that while on average, monthly checking-account costs are not all that high, the distribution of these costs across account holders is very uneven. Average total monthly fees measured on a per-account basis for our sample of accounts are around nine dollars. However, roughly 37 percent of accounts had no fees during the 12 months prior to the closure window, while around four percent incurred average monthly fees of more than $50. The share of accounts in our sample that incurred no fees was smaller in tracts having lower median
3
household income. Just under 30 percent of accounts in low-income tracts incurred no fees, compared to almost 42 percent of accounts owned by customers residing in high-income tracts. And approximately 4.6 percent of accounts in low-income tracts had average monthly fees of $50 or more, compared to just three percent of accounts in high-income tracts. Fees associated with having insufficient account balances to cover transactions (which we refer to as non-sufficient funds (NSF)-related fees) account for the largest share of the average monthly fees incurred by our sample of accounts, roughly 70 percent of average monthly fees. These NSF-related fees—which largely consist of per-item fees on paid overdraft items—varied widely across account holders. Almost 28 percent of accounts in our sample had NSF-related fees during the 12 months prior to the closure window, and roughly 8 percent of accounts had more than $20 per month on average in NSF-related fees. Accounts in lower-income tracts were more likely to have incurred relatively high NSF-related fees. Approximately 32 percent of sample accounts in low-income tracts had NSF-related fees during the 12 months prior to the closure window, and close to 10 percent paid more than $20 per month on average in NSF-related fees.
Our multivariate tests indicate that account-related factors explain much of the variation in the average monthly fees incurred by our sample of accounts. However, explanatory relationships reflect correlations among the account-related factors. For example, the relationship between average monthly deposits and fees changes from an inverse relationship to a positive correlation when we include average daily balances in the account as an explanatory factor. This suggests that account deposits reflect both account holder resources and account holder spending. Once we control for account balances, the positive correlation between deposits and fees appears to reflect payments activity.
Not surprisingly, average daily checking account balances are a major determinant of average monthly account fees. However, controlling for these balances and balances in other accounts with the bank, we find that accounts that were opted-in to standard overdraft coverage for debit-card or ATM transactions or that had a higher number of debit transactions per month also tended to have higher account fees. All else being equal, account holders who had deposit accounts linked for the coverage of overdraft items but who maintained average balances of $500 or less in these account tended to incur higher monthly fees than checking account owners who did not have a linked deposit account. Account holders having average linked deposit balances of more than $500 tended to pay lower checking account fees. Having positive available balances in linked or unlinked credit accounts with the bank tended to lower account fees. There are some differences in how account-related factors are related to NSF-related fees and to non-NSF-related fees. For example, the relationship between opt-in status and monthly account fees appears to reflect the accrual of greater NSF-related fees. In fact, accounts that were opted in for a majority of the sample period tended to have lower non-NSF-related account fees than accounts that were not opted in. The relationship between checking account balances and monthly fees also appears to reflect the association between account balances and
NSF-4
related fees. Although lower-balance accounts tended to also incur higher non-NSF-related fees, the magnitude of the association is much smaller. Some relationships evident for total checking account fees mask differences in NSF-related fees and non-NSF-related fees. For example, account holders having linked deposit or credit accounts tended to incur higher NSF-related fees, but lower non-NSF-related fees than account holders who did not have these types of accounts. We do not find this pattern for account holders having unlinked deposits or unlinked credit accounts.
Finally, controlling for account-related factors, we find variations in monthly checking account fees that are correlated with census tract characteristics. The magnitudes of the relationships are modest, which may reflect the fact that we are using census-tract proxies rather than account-holder characteristics. Account holders residing in tracts having higher residential vacancy rates or a high black population share tended to have higher monthly NSF-related and non-NSF-related fees than otherwise similar accounts. Residing in a tract with a high Hispanic population share is associated with having incurred higher monthly non-NSF-related fees but lower NSF-related fees. Differences in average monthly fees across tract income groups appear to reflect other tract demographic characteristics.
Our analysis of involuntary account closure examines how closures are related to checking account activity (including fees accrued) during the 12 months prior to the 90-day event window (which we use to classify accounts as involuntary closures). A relatively small share of accounts in our sample experienced involuntary account closure during the 90-day window (less than 2 percent of the sample which includes involuntary closures and accounts remaining open during the 90 day window).2 Univariate statistics indicate that accounts located in lower income census
tracts were more likely to close. More than 3 percent of analysis sample accounts in low-income tracts were closed involuntarily, compared to only one percent of the accounts in high-income tracts.
Multivariate tests examining the probability of involuntary account closure indicate that account-related factors account for much of the explained variation in this outcome. An
important factor associated with closure is account tenure; accounts that were less than one year old are much more likely to have experienced involuntary closure than older accounts. In terms of account activity, average daily account balances and monthly account fees incurred during the previous 12 months are the most important factors associated with involuntary account closures. Controlling for fees, we find that lower monthly deposits and a moderate number of non-debit-card debit transactions per month are also associated with a higher likelihood of involuntary
2 Here we are reporting the share of the analysis sample of accounts that were involuntarily closed during the 90 day
closure window. Of all accounts that were open at the beginning of the closure window, we classified 1.8 percent as involuntary closures.
5
account closure. However, aside from their correlation with account fees, we do not find that being opted in to overdraft coverage of card or ATM transactions or the number of debit-card transactions is related to the likelihood of involuntary account closure. Having other deposit or credit accounts with the bank is associated with a low closure rate among our sample of accounts.
Census tract characteristics are also related to the likelihood of involuntary account closure, even when we control for account-related factors. Account holders residing in tracts with a higher owner-occupancy rate or a high share of college graduates were less likely to have
experienced involuntary account closure. Account holders residing in tracts having a high black population share or a larger share of single-headed households with children were more likely to experience involuntary account closures. As with the fee analysis, differences in involuntary closure rates across tract income groups appear to reflect other demographic factors besides income.
It should be noted that this paper uses account data for a small number of large institutions and thus our findings are not representative of the banking industry as a whole. Pricing and closure policies and practices can vary widely across depository institutions. Additionally, account activity is inherently simultaneous in nature. For example, account holders often make deposits to their accounts because they plan to make expenditures. Thus our analysis of the fees paid during the period prior to the closure window is inherently descriptive, quantifying reduced-form relationships rather than causal effects. More research would be needed to identify causal relationships.
Nonetheless, our analysis yields findings that are important for understanding why some
consumers incur higher checking account costs that can affect the sustainability of bank account ownership. For example, debit-card use and being opted in to standard overdraft coverage of debit-card or ATM transactions are associated with higher account fees among our sample of accounts. This finding suggests that for some consumers, using debit cards as a means of payment may not be the most cost-effective decision. We also find that the higher fees incurred by young account holders reflect their account activity—such as debit-card use.
Findings regarding how linked account balances are related to account outcomes are relevant for consumers of more modest means.3 Linked savings accounts represented the main form of
formal overdraft coverage for accounts in our analysis sample; particularly for account holders in tracts having lower median income. The associations between high account fees, low account
3
Banks often charge a fee to automatically transfer funds to cover NSF items. A customer with a linked saving account but low balances in the account may also incur standard overdraft or NSF fees on transactions that exceed combined account balances.
6
balances, low monthly deposits, and involuntary account closure are also relevant for
households with limited resources. High closure rates among new accounts suggest difficulty in establishing banking relationships, which merits further investigation. In terms of the role of demographic factors, our findings suggest that relationships between account outcomes and tract median income reflect other demographic characteristics that are correlated with income. The associations between demographics and negative account outcomes evident in this study may help to explain why some households turn to nonbank sources of transactions and liquidity credit services.
The next section of this paper discusses our research in the context of other evidence about the use of transaction services and credit products from banks and from AFS providers. Section 3 describes our data and presents descriptive statistics. Section 4 reports the results of
multivariate tests that examine factors associated with the average monthly fees paid by account holders in our analysis sample. Section 5 presents the multivariate tests that examine
involuntary account closure. Section 6 concludes.
2. Background
Access to a deposit account is widely viewed as important for households for a number of reasons. Deposit accounts in insured institutions represent a safe place to accrue savings and can help households build wealth.4 Deposit relationships can also help customers establish
credit relationships with their institutions and develop financial skills. And over time, banks have provided consumers with an increasing array of payment products as transaction technologies have evolved.
However, findings from the FDIC Survey of Unbanked and Underbanked Households suggest that checking account ownership may not be a sustainable outcome for some U.S. households. Data from the 2011 FDIC Survey, a supplement to the June 2011 Current Population Survey, indicate that almost half of the 8.2 percent of households that were unbanked5 had previously
had an account with a depository institution. The FDIC survey data indicate that many
previously-banked households cited account costs as a reason why they were no longer banked. Another subset of households have a bank account but also use services provided by AFS
providers; including transaction services such as check cashing or high-cost short-term credit products such as payday loans or pawn shop loans. These households are often classified as
4 Depository institutions are also regulated, ensuring account holders reasonable standards for the availability of
funds, accurate accounting and reporting, and for dispute resolution.
7
“underbanked” in the sense that some of their transaction or liquidity credit needs are not being met by banks.
A growing amount of information yields a fairly consistent picture of the demographic characteristics that tend to be associated with the use of AFS providers or not having a bank account.6 There are some differences evident between households who do not own an account
and households that have accounts but also use nonbank AFS products. There are also differences in the demographics characteristics of households that use different types of AFS products. However in general, unbanked and underbanked households are more likely to be low- or moderate-income, non-homeowners; single-headed households with children; and households of racial/ethnic minorities or where the head of household does not have a college degree.
Concerns about the use of nonbank AFS providers reflect the cost of these products and the lack of access to cheaper or safer alternatives—particularly among households having more limited resources. Financial management choices can also reflect a household’s lack of understanding of the relative costs of using alternative options or behavioral factors that affect how consumers make budgeting and inter-temporal decisions.
The FINRA Financial Capability Survey includes questions about a wide range of financial outcomes, including questions regarding how and whether households save and about their use of credit. Lusardi and Tufano (2009) use information from this survey, relating responses to questions about basic financial concepts to outcomes in terms of traditional borrowing, the use of AFS providers, and investing activities. They find that only about one third of households represented by the survey appeared to understand interest compounding or the cost mechanics of how credit cards work. They also find that less financially literate individuals tend to transact in a high-cost manner, incurring higher fees and using high-cost sources of borrowing.
At the same time, there is evidence that some households use AFS providers in a relatively cost-effective manner. Using data for a representative sample of households in low- and moderate-income (LMI) census tracts in New York City and Los Angeles, Dunham (2001) finds that for many households, being unbanked appeared to be a cost-efficient decision, given the small number and the types of transactions they made. Using survey data for households in LMI tracts in Detroit, Barr et al (2009) also finds that LMI households incurred relatively modest annual costs for transaction services and credit usage; around one percent of annual income.
6 Papers using different datasets to look at the demographic characteristics associated with bank account ownership
and AFS credit use include McKernan et al (2009) Avery and Samolyk (2011), Berry (2004), Barr et al (2009), Rhine et al (2001), and Vermilyea and Wilcox (2002).
8
Survey data indicate that many households that do not own bank accounts cite not needing an account as the reason.7 In the FDIC survey data, a non-trivial share of unbanked households did
not use any of the AFS products included in the survey. For some households, not having a bank account can reflect a lower demand for formal transaction services, given the volume of
expenditures and the means of payment typically used when making transactions. Both
Dunham and Barr et al also emphasize that many LMI households, including households that do not own bank accounts, obtain financial products and services from both banks and non-bank AFS providers.8 Rather than being unbanked, underbanked, or “banked,” households actually
operate along a complex continuum in terms of their use of banks and nonbank transaction and credit services; making choices that reflect the extent to which these services are substitutes, their relative costs, and of course, access to the respective services.
However, changes in payments technologies are affecting the need for a bank account. Electronic payments have grown in importance for most households and have become a dominant form of payment, even for small transactions. A growing share of income payments are received via electronic funds transfer, including income in the form of government benefits and social security payments. These trends have arguably made it more difficult to live in a cash economy. Alternatives to traditional bank accounts, such as stored-value cards, have emerged to facilitate electronic transactions; however there can be substantial fees associated with the use of stored-value cards.
Access to liquidity credit also raises significant concerns for households that are financially vulnerable. Non-bank AFS credit products, such as payday loans, generally have much higher APRs than mainstream liquidity credit products, such as credit cards. Survey data indicate that households using AFS credit products often do not have cheaper options and are having
difficulty making ends meet (Avery and Samolyk (2011), Bourke et al (2012)). Liquidity credit products offered by banks can also be very expensive. Credit products related to insufficient account balances can have very high costs measured on an APR basis, particularly standard overdraft coverage that pays items up to a limit for a per-item fee. Barr et al (2009) finds that a larger share of LMI households in the Detroit study used overdraft credit than used pawnshop or payday loans. According to most definitions, the use of high-cost overdraft credit does not constitute being underbanked.
While the use of high-cost transaction or credit services on an occasional basis can be cost effective, evidence suggests that a subset of households tends to pay a lot for these types of financial services. Barr et al (2009) finds that a small fraction of the LMI households studied incurred high outlays for financial services relative to annual household income. Evidence
7 See Bucks et al (2009) and FDIC (2012).
9
about liquidity credit obtained from AFS providers indicate that a subset of customers incur high fees on an annual basis.9 Similarly, the use of higher cost account-related bank liquidity
credit (such as the standard coverage of overdraft items or deposit advance loans) appears to be concentrated among a relatively small subset of account holders.10 High fees for transaction and
credit services can have important economic consequences. They reduce the resources a household has to cover other expenses. They may also incent households to incur non-pecuniary costs such as the time spent to avoid paying fees or to pay lower fees.11
From a policy perspective, it is important to understand how account fees are related to
checking account revenues. Banks design, price, and provide access to deposit account products with customer relationship and profitability objectives in mind. Changing the options that banks have for charging fees on checking accounts may affect who banks will offer accounts to and the types of account they will offer. Factors affecting account profitability can also affect policies regarding closing accounts, which can have negative consequences for individuals (particularly closures that are reported to centralized information providers such as
ChexSystems and Early Warning Services). The current pricing of account services tends to generate deposit-related revenues in the form of penalty fees—mainly NSF-related fees.12 Banks
also raise revenues through what can be thought of as “usage fees” –such as fees for using another bank’s ATM, fees for money orders and certified checks, or fees to get a paper statement.
Account fees may not reflect the marginal cost of providing a given service. For example, NSF fees are not based on the actual costs of returning an NSF item. Certain fees may be intended to deter behavior, such as bouncing checks or depositing checks that do not clear. Changes in fees over time reflect a longer term trend in how banks cover account costs and generate revenues that contribute to bank profitability. Banks often set account fees based on what their
competitors are charging. And although banks vary widely in terms of account features and fee policies, available information suggests that deposit-related account fees have tended to increase over time.13
The implications of the current checking account pricing for households with limited resources are fairly straightforward. Households having higher income or greater wealth are more likely
9
For example, see CFPB (2013a) .
10
CFPB (2013b) analyzes information about overdraft fees for a small number of large institutions, while FDIC (2008) examines overdraft coverage programs operated by a random sample of FDIC supervised institutions and includes an analysis of account-level NSF and overdraft transactions activity for a small convenience sample of institutions that provided these data.
11 For example, an account holder may go to a check casher to cash a check and pay bills because of the delay in
getting the proceeds from the check credited to her deposit account.
12 See CFPB (2013b).
10
to be able to maintain the “precautionary balances,” needed to avoid account-related fees. High-balance accounts generate profits for banks in the form of the net-interest income that a bank earns on its assets. Households having higher income or wealth are more likely to also have access to cheaper liquidity credit that they can also use for account management purposes. In contrast, households having lower income or wealth are likely to find it more difficult to
maintain the “precautionary balances” needed to avoid account-related fees and are less likely to have access to lower-cost liquidity credit, in spite of what is likely to be a greater need. Of course, just as some households with limited resources are able to use AFS products in a cost-effective manner, households with limited resources may be able to avoid checking account fees. Indeed, some households having greater income or wealth may incur high account-related fees —but may be willing to pay them if for example, they value the convenience, while sustaining their account relationships.
Changes in payment technologies raise consumer concerns, particularly for households with limited resources. Generally, people do not have to pay fees to use currency to pay for something.14 Hence, the shift from cash to electronic payments, particularly for small
transactions, has increased the opportunities to incur usage-related fees. The 2008 FDIC Overdraft study found that more than 40 percent of overdraft transactions reported by the banks that provided data were debit-card transactions having a median size of $20.15 These
findings suggest that cash purchases can be very cost effective if they prevent small accidental overdrafts that trigger high fees. Barr et al (2009) argues that because the choice of a nonbank product can be the cheaper alternative; “policies designed to expand bank account access alone are unlikely to improve financial outcomes among LMI households unless accompanied by changes in the functionality of mainstream banking products.”
There is however, relatively little academic research about how people use their checking accounts and the costs associated with this use. The triennial Federal Reserve Board Survey of Consumer Finances gathers information on the financial assets held by a representative sample of U.S. households—including accounts with depository institutions. The SCF also includes household demographic information. However, it does not include detailed information about how checking accounts are used and the costs associated with this use. There also is little evidence about the factors associated with account closure. Without this type of information it is difficult to address questions about whether certain products or certain usage patterns appear to increase the risk of negative account outcomes. Evidence regarding these questions is
14
They may incur fees to obtain the cash; such as check cashing fees, ATM fees, or overdraft fees if they do not have funds in their checking account.
11
important for the design of financial products for LMI households and for policies to address consumer protection concerns that may arise in the financial marketplace. There are also financial education questions about bank account use. For example, would account holders be able to avoid negative outcomes it they better understood the relative costs of their options?16
In this paper, we use data on checking account usage, fees, and involuntary account closures for a large random sample of checking accounts at a number of large institutions to provide
evidence about:
The costs of having a checking account and the distribution of these costs across account holders;
How the costs of account ownership and use are related to specific types of account activity and broader account relationships in the form of other deposit and credit accounts that account holders have with their institutions;
The factors that appear to be related to the unsustainability of account relationships and involuntary account closures;
The extent to which differences in the costs of account ownership and the likelihood of involuntary account closure are associated with demographic characteristics measured for the census tract where an account holder resides.
As noted earlier, because of the small number of institutions represented by the data, our findings should not be used to more broadly represent outcomes for account holders at all depository institutions. Our data came from confidential supervisory information obtained from the examination process and any identifying information has been removed.
3. Data and descriptive statistics
Our data include rich information about monthly account activity and fees, as well as checking account balances and balances that account holders have in other accounts with their bank. We also observe the date of account opening, and if closed, the date and reason that the account was closed. We generally do not observe whether an account that closed involuntarily was reported to ChexSystems or Early Warning Services. To study involuntary account closures, we use a
16 For example, a 2012 study by Pew Charitable Trusts found that some households did not understand the
implications of opting in to the standard overdraft coverage of debit-card or ATM transactions in terms of the fees incurred.
12
day closure window and compare accounts that remained open during this period with accounts that we classified as involuntarily closures. The sample of accounts used here does not include accounts that were open at the beginning of the 90 day window and voluntarily closed during the window.17 We also exclude accounts where the primary account holder was less than 18
years old.
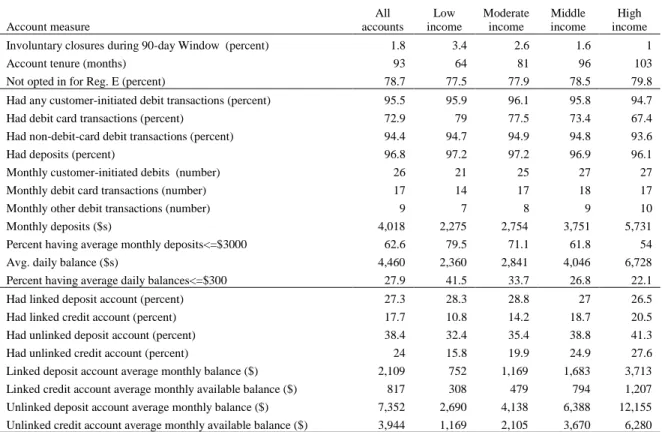
For all accounts in the analysis sample, we constructed variables that measure average monthly account activity during the 12 months prior to the closure window. For accounts that were less than one year old, monthly account activity is measured for the months during which the account was open. Because we have data for a small number of large institutions, we weighted the observations for each institution so that the relationships that we are measuring reflect the average outcomes at the bank level, rather than the average account outcomes, given the uneven distribution of accounts across the banks. Table 1 describes the account-related variables used in our analysis. These variables were merged with the variables used to measure the
characteristics of the tract where each account holder resided.
Our choice of census tract characteristics to focus on here reflects evidence about the
characteristics of households that tend to be unbanked or underbanked. We use tract median income groups defined using standard definitions that compare tract median income to the median income in the broader market area where the tract is located.18 Low-income tracts have
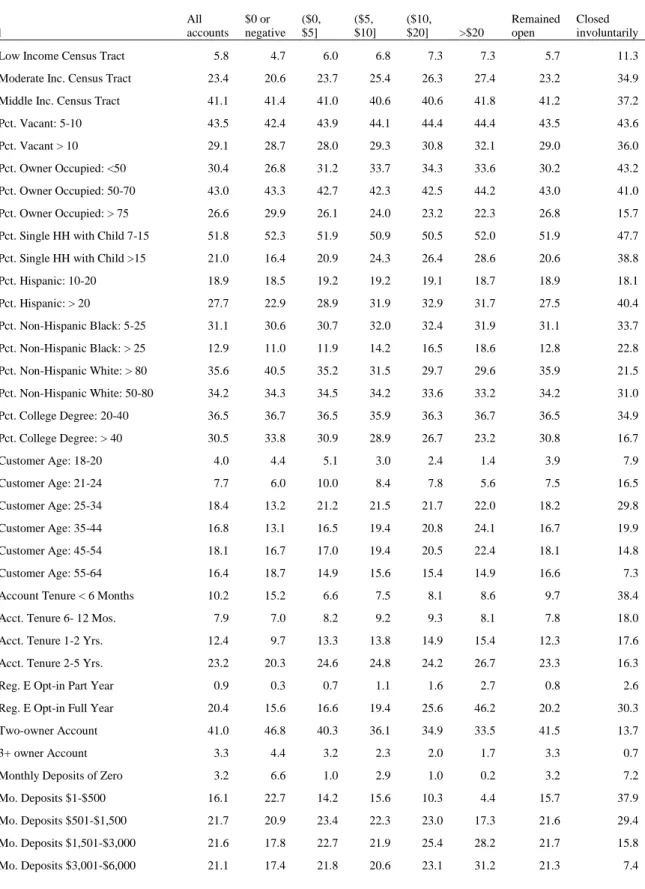
median income that is less than 50 percent of the market median income. Moderate-income tracts have median income of between 50 and 80 percent of market median income and middle-income tracts have median middle-income between 80 percent and 120 percent of market median income. High-income tracts have median income that exceeds 120 percent of market median income. Table 2 summarizes our sample of accounts in terms of selected census tract
characteristics. Importantly for our analysis, Table 2 indicates that tract income is correlated with other tract characteristics that tend to be associated with being unbanked or underbanked. Tracts having lower median income tend to have higher shares of minority residents, lower proportions of adults that have a college degree, higher shares of single-headed households with children, lower owner occupancy rates, and higher vacant property rates.
Table 3 describes the fees incurred by accounts classified by census tract income. Checking accounts in our sample incurred average monthly fees of approximately nine dollars measured
17 As noted, our sample consists of accounts that were open at the beginning of the 90-day closure window and that
were involuntarily closed or remained open during the window. The sample does not include account that were opened during the window, but it does include accounts that were opened during the 12 months prior to the closure window that remained open during the closure window or were classified as involuntary account closures.
18 For urban tracts, tract income is compared to median income in the metropolitan statistical area (MSA) where the
tract is located. For rural tracts, tract median income is compared to the median income of all rural tracts in the state where the tract is located.
13
on a per-account basis during the 12 months prior to the closure window. NSF-related fees accounted for the largest share of average monthly fees—around 70 percent. However, checking account fees are not distributed evenly across account holders. Among all accounts in the analysis sample, 37 percent incurred no fees during the 12 months prior to the closure window, and another 31 percent incurred average monthly fees of five dollars or less.19 Just over ten
percent of accounts had average monthly fees of twenty dollars or more, and four percent of sample accounts had average monthly fees of $50 or more during the 12 months prior to the closure window.
Average monthly fees tended to be higher for accounts in tracts having lower median income. This reflects higher average NSF-related fees as well as higher average monthly ATM and maintenance fees. Accounts in high-income tracts tended to incur somewhat higher monthly fees classified in the residual “other” category which includes fees such as returned deposit item fees or stop payment fees. In tracts having lower median income, smaller shares of accounts incurred no fees during the 12 months prior to the closure window and larger shares of account incurred average monthly fees of $20 or more. Only 29 percent of sample accounts in low-income tracts incurred no fees compared to almost 42 percent of accounts in high-low-income tracts. Consistent with other research, we find that a large majority of accounts in our sample incurred no NSF-related fees during the 12 months prior to the account closure window. However, accounts in lower income tracts were less likely to have incurred no NSF-related fees. Just over 72 percent of accounts in our sample incurred no NSF-related fees prior to the closure window. Only 68 percent of accounts in lower income tracts incurred no NSF-related fees, compared to 76 percent of accounts in high-income tracts. In tracts having lower median incomes, a large share of accounts had monthly NSF-related fees of more than $20. Except for accounts in high-income tracts, the shares of accounts that had monthly NSF-related fees of more than $50 are more similar. A larger share of accounts in our sample incurred non-NSF-related fees (43 percent). Again, smaller shares of accounts in tracts having lower median incomes incurred no non-NSF related fees during the 12 months prior to the closure window. Only 36 percent of accounts in low-income tracts incurred no non-NSF-related fees, compared to more than 47 percent of accounts in high-income tracts.
Among accounts that had a given type of fee, non-related fees tend to be lower than NSF-related fees measured on a monthly basis. More than two-thirds of accounts that had non-NSF related fees prior to the closure window had monthly fees of $5 or less. Among accounts that
19
Using administrative data for roughly 900 consumers on check and credit card transactions made by individuals during a two-year period; Stango and Zinman (2009) find that 31 percent of these individuals paid no checking account fees during the period for which data were available; on average for 14 months. They note that compared to national averages, individual in their panel tends to be younger, wealthier, more educated, use electronic payments more intensively, and are likely to be more creditworthy and financially sophisticated.
14
had NSF-related fees, only 38 percent had NSF-related fees of $5 or less. A very small share of accounts (0.1 percent) in our sample had monthly non-NSF-related fees of more than $50. Table 4 summarizes account status during the 90-day closure window and other account-related variables during the 12 months prior to the closure window. Among our sample of accounts, a relatively small share experienced involuntary account closure during the 90-day closure window; by construction, the remaining share remained open. Less than two percent of
accounts in our sample are involuntarily closures. Account holders residing in tracts with lower median income were more likely to be in the closure group. More than three percent of analysis sample accounts in low-income tracts were closed, while only one percent of the accounts in high-income tracts are in the closure group.
Sample accounts in lower income tracts also tended have a shorter account tenure (measured as months open at the beginning of the closure window), and they were slightly less likely to have remained opted out of overdraft coverage of debit-card or ATM transactions for the full 12 months. Accounts in tracts having lower median income were also more likely to have used debit cards during the 12 months prior to the closure window. The share of accounts in high-income tracts having debit-card transactions is notably lower (67 percent). The mean number of monthly debit-card transactions among this group suggests that debit-card users in high-income tracts tended to use their cards more than account holders in lower-income tracts. The shares of accounts having non-debit-card debits are more similar across tract income groups. The
average number of non-debit-card transactions per month tended to be somewhat lower in tracts having lower median income.
Accounts in lower income tracts tended to have lower average monthly deposits and lower average daily balances during the 12 months prior to the closure window. For all accounts in the sample, mean monthly deposits were just over $4,000. For accounts in low-income tracts, the mean of monthly deposits was less than $2,300; while for accounts in high-income tracts, mean monthly deposits were more than $5,700. The share of accounts that had average monthly deposits of $3,000 or less is inversely related to tract income. Almost 63 percent of accounts in our sample had average monthly deposits of $3,000 or less during the 12 months prior to the closure window. However, among accounts in low-income tracts, the share was almost 80 percent, while 54 percent of accounts in high-income tracts had monthly deposits of $3000 or less. Average daily account balances are also inversely related to tract income. Among all accounts in our sample, almost 28 percent had average daily balances of $300 or less. More than 41 percent of accounts in low-income tracts had average daily balances of $300 or less during the 12 months prior to the closure window, compared to only 22 percent of accounts in high-income tracts.
15
Some accounts were relatively inactive. This may reflect accounts held by households that have more than one checking account with their institution; a consideration that we cannot identify using our data. It also may reflect the situation where account holders have checking accounts with other institutions that are used more actively. The somewhat lower shares of accounts in high-income tracts having the various types of account activity may reflect these types of factors. In the 2010 Federal Reserve Survey of Consumer Finances, less than a quarter of families with checking accounts in the lowest income quartile had a second checking account, compared to over 60 percent of families in the highest income quartile.20
The patterns evident here suggest that differences in deposits and account balances may not fully reflect differences in income and wealth. Account holders, particularly those in more affluent households, may choose the levels of their deposits and account balances based on their use of the account, their preferences for precautionary balances, and the forgone return from holding balances in a checking account rather than in a higher yielding asset. Additionally, account balances may not be a good indicator of account activity. An account holder may have a high volume of deposits while maintaining low average monthly balances because all of these deposits are being spent. Alternatively, an account holder may be maintaining very high or very low balances in an account with little deposit or debit transaction activity.
In terms of other account relationships, having a linked savings account was the most common form of formal overdraft protection, particularly among account holders in low- and moderate-income tracts.21 The proportion of accounts that had a credit account linked for the purposes of
overdraft protection was higher among account holders residing in tracts having higher median income. Only 11 percent of accounts in low-income tracts had a linked credit account, compared to more than 20 percent of accounts in high-income tracts. These relationships may reflect bank policies for underwriting credit extensions to account holders versus the relative ease of opening a linked deposit account. Account holders residing in lower income tracts are also less likely to have had deposit accounts or credit accounts that were not linked for the purposes of the coverage of NSF items. Although not linked for automatic overdraft coverage, these
20
Income quartile
Families surveyed
Median income
% with checking account
% with a second account*
1 1493 $15,248 74.5% 23.6%
2 1262 $33,545 90.1% 35.0%
3 1426 $60,990 97.5% 49.4%
4 2301 $126,047 99.7% 64.6%
All 6482 $45,743 90.4% 44.7%
Authors' calculations:
* of those with a checking account.
21 Institutions typically offer account holders formal overdraft protection by linking deposit accounts or credit
account for the purpose of covering NSF-transactions. These programs are exempt from the requirement that customers must opt in to the coverage of debit-card or ATM transactions.
16
accounts represent resources that account holders can use to manage their finances. Not surprisingly, account holders in lower income tracts also tended to have lower balances in other accounts with their bank. For all products except linked deposit accounts, this in part reflects the lower shares of customers that have these accounts.
The complex and inherently interrelated nature of checking account activity underscores the importance of taking all types of account activity into consideration when examining account outcomes, such as fees incurred or involuntary account closures. In the following sections, we present the results of multivariate tests that examine how account-related factors and census tract characteristics are associated with the average monthly fees an account holder paid during the 12 months prior to the account closure window and with the likelihood that an account was involuntarily closed during that window.
For the multivariate tests, we create categorical variables that bucket continuous variables into groups. We do this for two reasons. First, mean levels of average monthly account activity and account balances reflect the fact that the distributions of these variables are skewed by accounts having very high activity or balances. Median account activity and median account balances tend to be much lower than the mean. Secondly, the use of categorical variables also allows us to capture nonlinearities in relationships between account-related factors, tract characteristics, and the account outcomes we are examining.
We also conduct the fee analysis by categorizing each account into one of five fee groups and analyzing factors associated with being in a higher (or lower) fee group. We do this because of the uneven distribution of fees across accounts. Many accounts incurred no fees or low fees, while a much smaller share of account incurred very high monthly fees. Of course, the outcomes of being involuntarily closed versus remaining open are also categorical.
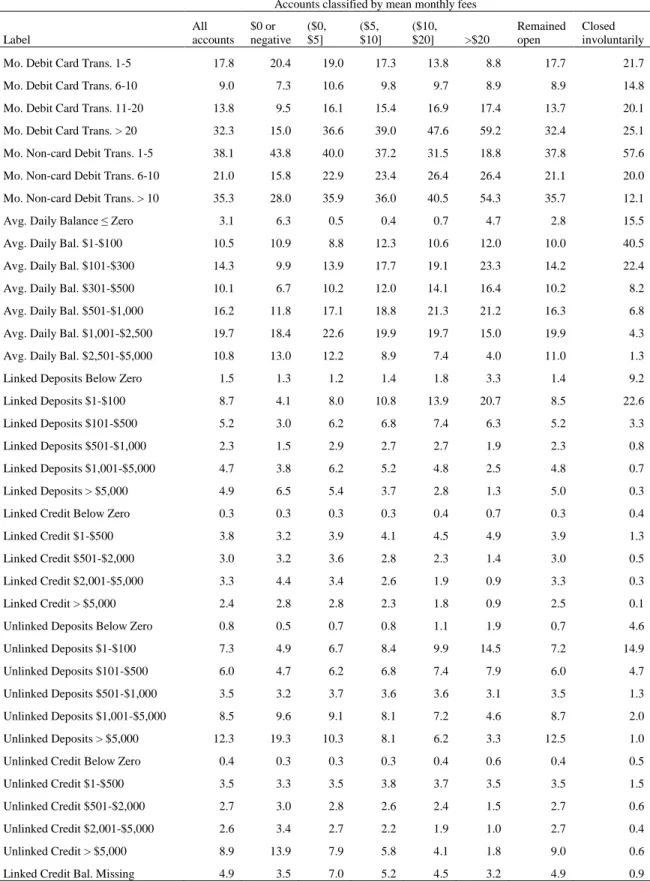
Table 5 reports the means of the categorical variables used in the multivariate tests: for all accounts in the analysis sample; for accounts classified by the five average monthly fees groups; and for accounts classified by whether they remained open or were involuntary closed during the 90 day closure window. These unconditional means suggest that linkages between account-related factors, fees, and account closure can be complex.
Some account-related factors appear to be associated with both fees and closure risk. For example, accounts in the sample that were opted in to overdraft coverage of debit-card or ATM transactions are disproportionately represented in the two highest fee groups and among accounts that were involuntarily closed. Single owner accounts are also overrepresented among accounts paying higher average monthly fees and among involuntary account closures.
Customers having low balances in other deposit accounts (balances of $100 or less) account for larger shares of accounts in both the higher fees groups and the account closure group.
17
Other factors appear to be more highly associated with fees than with closure risks or vice versa. Accounts with greater debit-card use comprise larger shares of accounts in the higher fee
groups; however accounts with no debit-card use and accounts in the highest debit-card transaction group (more than 20 transactions per month) are both underrepresented among involuntary account closures. Accounts that had average monthly deposits in the range of $1,500-$6,000 are disproportionately represented in the higher fees groups but
underrepresented among account closures. These patterns suggest that certain factors
associated with fees may not represent higher account closure risk. For example, higher average monthly deposits may reflect an ability, in some sense, to “afford” the account fees.
Low-deposit accounts (monthly deposits of $500 or less) comprise a large share of involuntary closures, relative to their representation among accounts paying higher fees, as do accounts that had 5 or fewer non-debit-card debits per month. Accounts having balances in the $100-300 range account for disproportionate shares of accounts that paid higher monthly fees and that were involuntarily closed, while lower-balance accounts closed at a disproportionately high rate, but did not incur disproportionate fees. As a group, 28 percent of accounts in our sample had average daily balances of $300 or less during the 12 months prior to the 90-day closure window. These accounts comprised a similar share of accounts that incurred no fees prior to the closure window. However, 78 percent of accounts that were involuntarily closed during the 90-day window were accounts that had average daily balances of $300 or less during the 12 months prior to the closure window. Some of the low-balance accounts in the closure group may not have been open for the full year prior to the closure window. Accounts that were no more than a year old make up just over 18 percent of accounts in the sample, and they comprise 22 percent of accounts that incurred no fees prior to the closure window. However more than 56 percent of accounts that were involuntarily closed had been open a year or less.
Not surprisingly, accounts in our sample that incurred high fees tend to be disproportionately represented among involuntary account closures. Sample accounts that incurred average
monthly fees of more than $10 during the 12 months prior to the closure window comprised less than one fifth of the accounts in our sample; however, they represented more than half of the accounts that were involuntarily closed. As discussed above, 37 percent of accounts in the sample incurred no fees during the 12 months prior to the closure window, however less than 11 percent of accounts in the closure group had no fees during this period.
Table 5 also reports the unconditional means for the census tract variables included in our analysis. For variables other than tract median income, the categories used to classify census tract characteristics reflect the distributions of these characteristics across accounts in our sample (as reported in column 1) and were constructed to include meaningful shares of accounts in each group. These summary statistics indicate differences in how tract characteristics are related to average monthly fees and to involuntary account closure. Account holders who
18
resided in low- and moderate-income tracts are disproportionately represented among
involuntary account closures to a greater extent than they are represented among the higher fee groups. Account holders residing in the tracts having high owner-occupancy rates are
underrepresented among account closures relative to their representation in the higher fee groups; as are account holders residing in tracts with high shares of college graduates or tracts having high shares of non-Hispanic white residents. Account holders residing in tracts having high shares of single-headed households with children are disproportionately represented both in the higher fee groups and among involuntary account closures; as are account holders residing in tracts with high shares of black or Hispanic residents.
The multivariate tests described below examine the relative contribution of specific types of account-related factors in explaining differences in monthly account fees incurred and in the probability of involuntary account closure. In particular, they examine the extent to which these factors help to explain differences in outcomes associated with tract characteristics.
4. Multivariate analysis of monthly account fees
This section presents the results of multivariate tests. To examine the contribution of different types of account-related factors in explaining the account outcomes, we report results for specifications that incrementally add more account-related variables. All specifications also included fixed effects (not reported) for the state where the account holder resided and the bank where the account was held. For each set of variables measuring a census tract characteristic other than median income, the omitted group is the group having the lowest tract concentration of the indicated characteristic. For census tract median income, we compare outcomes for account holders residing in tracts with lower median income to outcomes evident for account holders residing in high-income tracts. For the variables measuring account holder age and account tenure, the omitted group is the oldest group of account holders and accounts, respectively.
For variables measuring monthly deposits and customer-initiated debits that are not debit-card transactions, having no activity may reflect an inactive account. Since our focus is on active accounts, we chose the highest activity group to serve as the basis for comparisons for these factors. On the other hand, many active account users do not use debit cards. For this factor, no debit-card use is the omitted group; hence we measuring the effects of debit-card use compared to no debit-card use. Not being opted in to overdraft coverage of debit-card or ATM
transactions is the omitted opt-in group. For the variables measuring balances in other accounts held with the bank, the omitted group includes accounts held by customers who did not have the indicated type of account. Hence, we are measuring how outcomes associated with
19
balances in another account differ from outcomes evident for account holders who did not having this type of account.
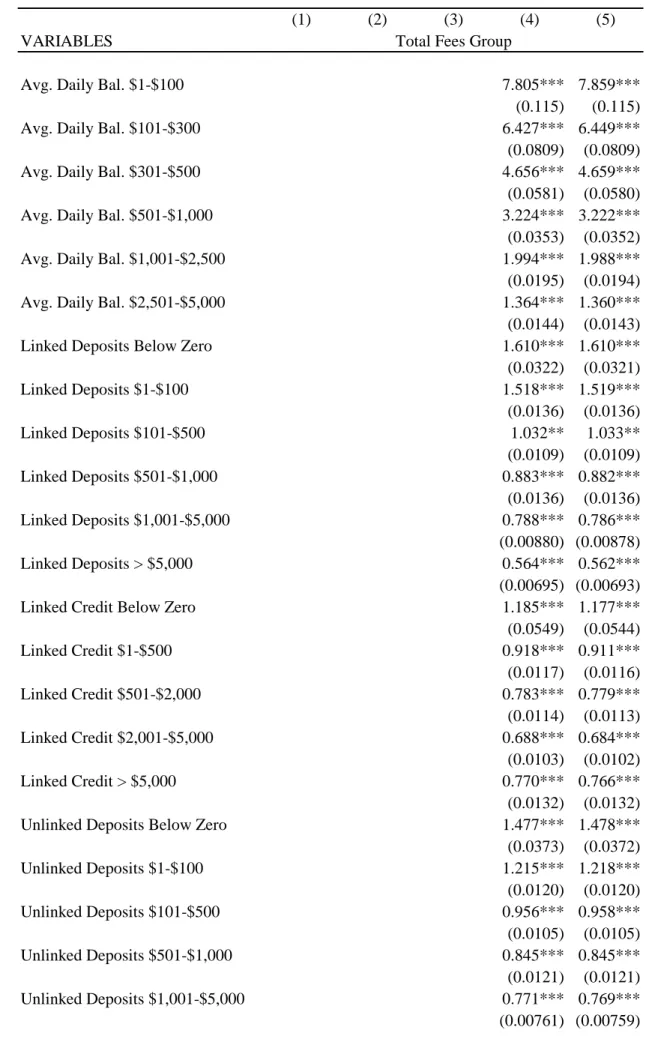
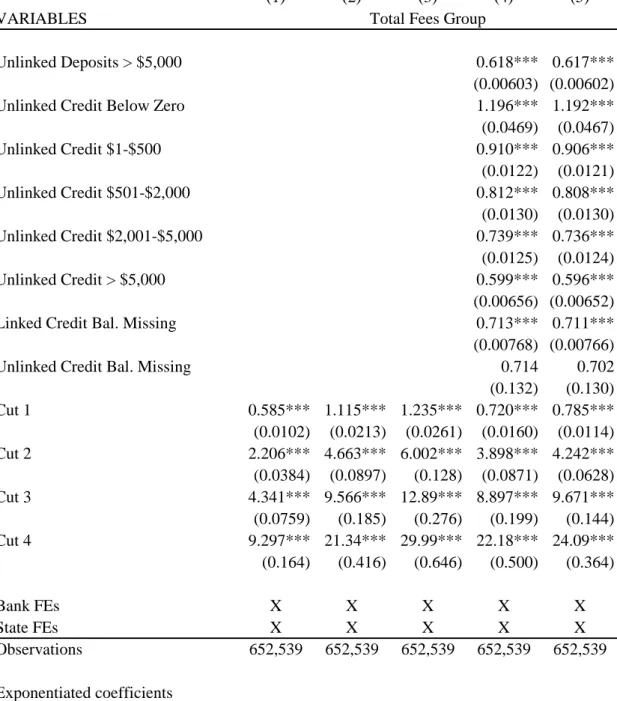
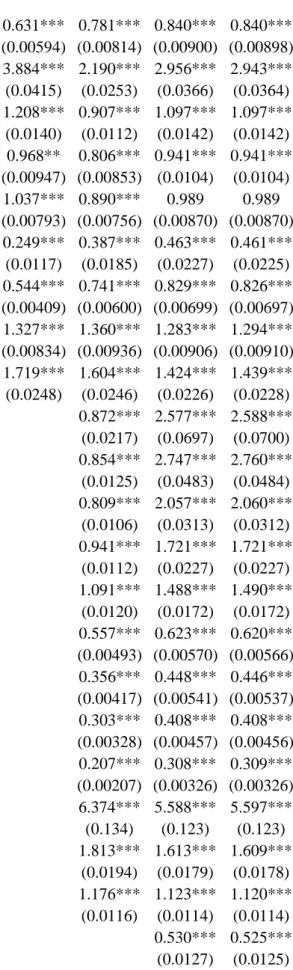
4.1 Ordered logit fee regressions
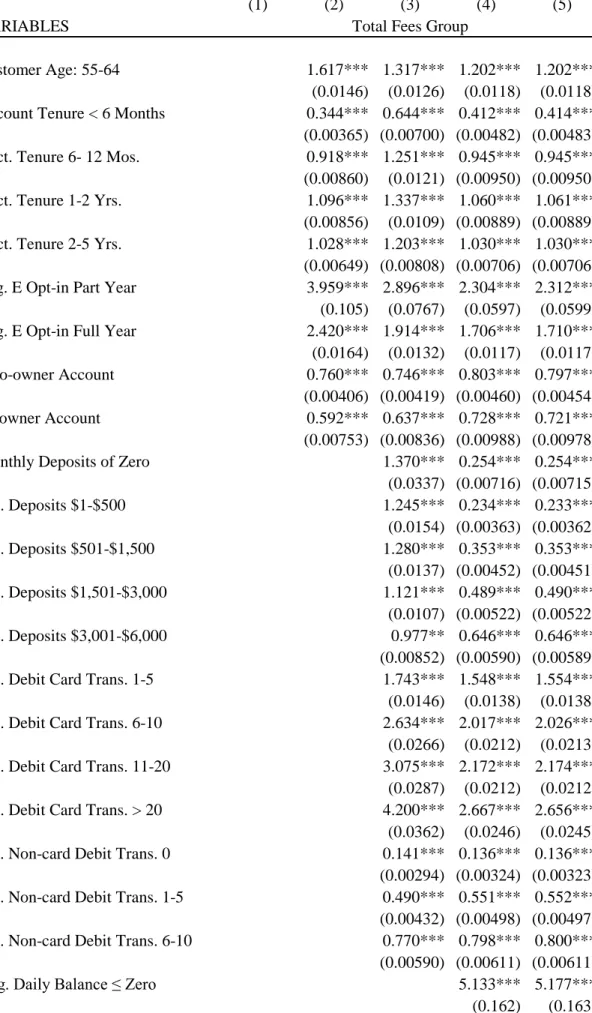
To examine the conditional relationships between tract characteristics, account-related factors, and average monthly fees incurred during the 12 months prior to the closure window, we estimated several ordered logit models. The coefficient estimates in these models measure the marginal association between a given factor and the likelihood that an account would be in the adjacent higher (or) lower fee group. The fee groups are those indicated by the columns in table 5, where incurring no fees is the lowest group. Table 6 reports the odds ratios implied by the coefficient estimates for each model specification. The coefficient estimates are reported in table A.1 in the appendix to this paper. We also estimated regressions that measure factors related to the likelihood that an account incurred no fees during the 12 months prior to the closure window; in other words, that the account holder had “free checking” during this period. Additionally, to examine whether there are differences in the factors associated with NSF-related fees and with non-NSF-NSF-related fees, we estimated ordered-logit models using fee groups measured for each of these types of fees. The results of these tests are discussed below.
Column 1 of Table 6 reports results for the ordered logit specification that does not include any of the account-related variables in explaining monthly account fees; only the variables
measuring account-holder census tract characteristics. This model specification, in some sense, is similar to research analysis that examines the demographic characteristics associated with banking status or AFS product use when there is little information about a consumer’s finances. As noted however, we do not directly observe account holder characteristics (other than age). Column 2 reports the odds ratios implied by the ordered logit regression that includes tract characteristics and a subset of the account-related variables including: account tenure, the number of account owners, the age of the primary account holder, and whether the account was opted in to the overdraft coverage of debit-card or ATM transactions during the 12 months prior to the closure window. The specification reported in column 2 does not include any of the factors measuring account activity or balances in other accounts with the bank. Column 3 reports the odds ratios implied by the specification that adds variables measuring account transaction activity to specification 2, including the average monthly dollar volume of deposits, the number of debit-card transactions per month and the average number of customer-initiated non-debit-card debits per month. Column 4 reports results for what we refer to as our most complete specification that includes all of the account-related variables, including variables measuring average daily checking account balances and average monthly balances in other accounts during the 12 months prior to the closure window.
20
Comparing results for these specifications will indicate the marginal explanatory power of adding different types of bank account-related information. The comparisons also allow us to observe correlations between explanatory factors that are important for policy considerations. For example, as discussed below, we observe a decrease in the extent to which account holder age is associated with differences in the average monthly account fees when we include variables measuring account activity in specification 3 and account balances in specification 4. These changes reflect the correlations between account holder age and banking activity--such as debit-card use, which we find to have an economically significant positive effect on the likelihood of being in a higher fee group.
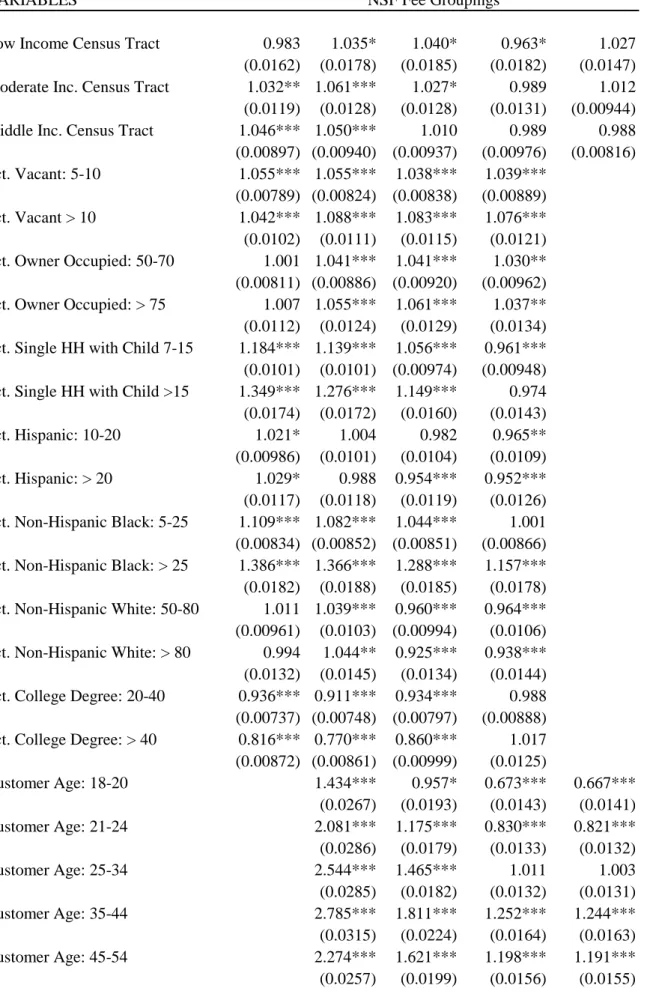
The results reported in Table 6 indicate that account-related factors explain some of the
differences in fees associated with census tract characteristics. In the specification that includes other tract characteristics and all account-related factors (column 4), we find no statistically significant relationships between tract median income and the likelihood of being in a higher fee group (column 4). However, fee differentials associated with other tract characteristics are evident. Higher residential vacancy rates, lower owner-occupancy rates, and higher black or Hispanic population shares are associated with a greater likelihood of being in a higher fee group. In specification 5, which includes all account-related factors but excludes variables measuring tract characteristics other than income, there is a statistically significant relationship between tract median income and monthly account fees. The exclusion of the non-income tract characteristics has little effect on how account-related factors are related to monthly fees
incurred prior to the account closure window. Together these finding indicate that the
correlation between tract median income and fees reflects the non-income characteristics of the tract where an account holder resided rather than tract income per se. Moreover, the tract characteristics associated with incurring higher fees are consistent with evidence about who tends to be unbanked or uses AFS providers. From a policy perspective, further research is needed to understand the nature of relationships between demographic characteristics and checking account fees. Of course it would also be useful to directly observe account holder characteristics to more fully understand the importance of these factors to account outcomes. Turning to the account-related variables, we find that account holder age, account tenure, the number of account holders, and account opt-in status are all important factors that help to explain the average monthly checking account fees. The relationship between account holder age, opt-in status, and fees are interesting because these relationships are correlated with other account-related factors in a manner that is important to understand from a policy perspective. The relationship between account holder age and the likelihood of being in a higher fees group is altered when transaction activity and account balances are included as explanatory factors. The marginal effect associated with age become much smaller. In fact controlling for transaction activity and account balances, very young account holders (ages 18-20) are more likely to be in a lower fee group than older account holders.
21
The relationship between opt-in status and monthly fees also appears to reflect other account-related considerations. The magnitude of the opt-in effects is smaller once we control for account transaction activity and account balances. This is consistent with the notion that the choice of whether to opt in reflects the account holder’s transaction patterns and financial resources. Accounts that are opted in also may have greater transaction activity all else being equal, because debit-card or ATM transactions that are paid into overdraft would generally have been denied if the account was not opted in. However, the other account-related factors
included in our analysis do not fully explain differences in fees that are associated with opt-in status; opted-in accounts are more likely to be in a higher fees group, compared to accounts that were not opted in. Account tenure and the number of account owners are also related to average monthly fees incurred by accounts in our sample. Accounts that were less than a year old--particularly accounts that were less than 6 months old—are more likely to be in a lower average monthly fee group. Accounts having more than one account holder are more likely to be in a lower fee group than single-owner accounts.
The number of debit-card transactions per month is positively associated with average monthly fees incurred during the 12 months prior to the closure window. Controlling for all other account-related factors, accounts having more than five debit-card transactions per months are at least twice as likely to be in a higher fee group as accounts that had no debit-card transactions during the 12-month period (column 4). The reduction in the magnitude of this relationship when we include account balances suggests that heavier debit-card users tend to have lower account balances. The number of non-debit-card debits per month is also positively related to average monthly account fees incurred, but the relationship between the number of non-debit- card transactions and monthly account fees is relatively unaffected by the inclusion of variables measuring account balances. Controlling for all other account-related factors, accounts with no non-debit-card transaction activity (which to some extent may reflect accounts that are
dormant) were much less likely to have incurred account fees.
The estimated relationship between average monthly deposits and average monthly account fees is also altered by the inclusion of the account balances variables. Not controlling for account balances, we find an inverse relationship between average monthly deposits and monthly account fees (column 3). The inclusion of the variables measuring checking account balances and balances in other deposit or credit accounts with the bank reverses this relationship. Controlling for account balances, accounts that had lower average monthly deposits are more likely to be in a lower fee group, all else being equal (columns 4 and 5). This suggests that monthly deposits reflect both an account holder’s financial resources and well as expenditures made from the account. For a given level of account balances, lower deposits may correspond to lower expenditures which can reduce the likelihood of incurring account fees.
22
As expected, account holders who maintained higher average daily balances in their checking accounts tended to incur lower monthly account fees. Accounts that had average checking account balances of $1-$300 are about six times as likely to be in a higher fee group that accounts that had average balances of more than $5,000. Accounts that had average daily balances between $1,000 and $2,500 are twice as likely to be in a higher average monthly fee group as accounts in the highest account-balance group.
Balances in other accounts with the bank are also related to monthly fees incurred during the 12 months prior to the closure window. As noted, balances in these accounts can reflect an account holders financial resources and in the case of credit-related accounts, the account holder’s credit worthiness from the banks’ perspective. In our sample, account holders that had positive
average monthly available balances in a linked credit account are more likely to be in a lower fee group than checking account holders who did not have a linked credit account. However, the likelihood of being in a lower fee group does not monotonically increase with average monthly available balances. This may reflect the fact that we cannot identify the amount of credit that has been used relative to the account holder’s maximum credit limit. Having zero or negative available balances in a linked credit account is associated with incurring higher fees than accounts that are not linked to a credit account. We find somewhat similar relationships
between unlinked available credit balances and average monthly checking account fees. But for unlinked credit accounts, having greater available balances does appear to be associated with greater likelihood of being in a lower fee group. Accounts where the account holders had unlinked available credit balances of more than $5,000 are 40 percent more likely to be in a lower fee group than otherwise-equivalent accounts where the account holder did not have an unlinked credit account with the bank.
In terms of other deposit accounts, the relationships between having balances in these accounts and average monthly checking account fees are fairly similar for accounts that are linked for the coverage of NSF items and for unlinked deposit accounts. For account holders with average monthly balances of more than $500 in a linked deposit account, having the linked deposit account is associated with a greater likelihood of being in a lower fees group compared to checking account holders who did not have a linked deposit accounts, all else being equal. However, account holders having balances of less than $500 tended to pay higher account fees than checking account owners who did not have a linked deposit account. Similarly, compared to account holders with no unlinked deposit account, accounts holders who had balances of more than $500 in their unlinked account are more likely to be in a lower fee group. Having low balances in an unlinked deposit account ($100 or less) is associated with paying higher fees than not having an unlinked deposit account.
23
Table 7 reports the odd ratios yielded by logistic regressions examining whether an account holder incurred no fees during the 12 months prior to the involuntary closure window. The dichotomous variable takes the value 1 if the account incurred no fees during this period and zero otherwise. The results for these tests represent a robustness check of the results yielded by the ordered logit regressions. Generally, the results mirror the patterns evident in the ordered logit regressions which examine the level of fees incurred by an account.
Comparing the different regression specifications presented Table 7, we find that account-related factors explain some but not all of the differences in the likelihood of having no account fees associated with tract characteristics . Again, the correlation between tract income and the likelihood of having incurred no fees appears to reflect non-income tract characteristics. Controlling for account-related factors, account holders residing in tracts with high population shares of Hispanic or black residents were less likely to have incurred no account fees, while those in tracts with a high share of non-Hispanic white residents were more likely to have had free checking during the 12 months prior to the closure window (column 4). A high share of vacant properties and a lower share of owner-occupied properties are also associated with a lower likelihood of having incurred no fees. Controlling for account-related factors, we find nonmonotonic relationships between the probability of having free checking and the tract share of adults having a college degree and the share of the tract’s households having a single head of household with children (column 4). Account holders residing in a tract with a moderate share of single-headed households with children were more likely to have incurred no fees than account holders residing in tracts with a low proportion of this type of household. Account holders residing in tracts with a moderate share of college graduates were somewhat more likely to have paid no account fees than account holders in tracts with lower or higher proportions of college graduates.
Turning to relationships between account-related factors and the likelihood of incurring no fees, the relationship between account tenure and the likelihood of incurring no fees is nonlinear. Accounts that were less than a year old were more likely to have incurred no fees than mature accounts (accounts that were more than five years old); but accounts that were one to two years old were modestly less likely to have incurred no fees than mature accounts. Account having more than one account owner were more likely to have had free checking than single owner accounts. Account holders that were between 20 and 65 were less likely to have incurred no fees during the 12 months prior to the account closure window.
Accounts that were opted-in to standard overdraft coverage of debit card or ATM transactions were less likely to have incurred no account fees than accounts that were opted out. However, the extent to which being opted-in reduces the likelihood of incurring no account fees becomes smaller when we control for the additional account-related factors (column 4). The relationship between average monthly deposits and the likelihood of having no account fees depends on
24
whether we control for account balances. Not controlling for account balances, we find that accounts having deposits of less than $3,000 were less likely to have incurred no account fees than accounts in the higher deposit groups. However controlling for account balances, having lower average monthly deposits is associated with a greater likelihood of having incurred no fees during the 12 months prior to the account closure window. Again, this suggests that controlling for account balances, deposits may be reflecting account holder spending.
The average number of debit-card transactions and of non-debit-card transactions per month are both inversely related to the likelihood of incurring no account fees. Not surprisingly, checking account balances are an important determinant of whether an account in our sample incurred monthly account fees. Controlling for all other account-related factors and tract demographics, accounts that had positive but low average daily balances ($300 or less) were only one fourth as likely to have incurred no fees compared to very high balance accounts. Even accounts having moderate balances are notably less likely to have had no fees than high balance accounts.
The relationships between balances in other accounts and the likelihood of incurring no fees are somewhat different from those associated with the level of average monthly fees incurred. Account holders that had any positive available balances in an unlinked credit account were more likely to have incurred no account fees. However, only account-holders that had fairly large available balances in a linked credit account were more likely to avoid fees than account holders with no linked credit accounts. This may reflect the fact that customers with credit accounts linked for the purpose of overdraft protection often pay a fixed dollar “sweep fee” when the credit is extended. Although these sweep fees are generally lower than the per-item fees charged under standard overdraft coverage programs; they are fees nonetheless.
Account holders having linked-deposit-account balances of less than $1,000 were less likely to have had free checking than account holders who did not have a linked deposit account. Only account holders having linked deposit-account balances in the highest balance category were more likely to have incurred no fees than account holders who did not have a linked deposit account. Again, this may reflect the sweep fees that are often charged for the automatic coverage of overdraft items by the transfer of funds from a linked deposit account. Only accounts holders who had low average monthly balances in their unlinked deposit accounts ($100 or less) were less likely to have had no checking account fees than account holders who did not have an unlinked deposit account with their bank.
As robustness check of the free-checking results, we compared these results to estimates from linear probability models relating the categorical variables measuring tract characteristics and account-related factors to the probability that an account had no fees during the 12 months prior to the involuntary closure window. The most straightforward way to compare the results of the