STRATIFICATION INFLUENCES ON INSTREAM
CARBON CHEMISTRY AND EXPORT WITHIN A BEADED
ARCTIC STREAM AND EVALUATION OF
FLUORESCENCE INSTRUMENTATION
Katherine Hope Harrold
A thesis submitted to the faculty of the University of North Carolina at Chapel Hill in partial fulfillment of the requirements for the degree of Master of Science in the Department of Environmental Sciences and Engineering.
Chapel Hill 2013
ii
ABSTRACT
KATHERINE H. HARROLD: Stratification Influences on Instream Carbon Chemistry and Export within a Beaded Arctic Stream and Evaluation of Fluorescence
Instrumentation
(Under the direction of Rose M. Cory)
I investigated the effect of stratification in beaded stream pools on the quantity and quality of dissolved organic matter (DOM). Soil waters feeding the pool bottom waters overlapped in chromophoric (CDOM) and fluorescent (FDOM) quantity and quality, while pool surface waters had on average 56 and 32 % less CDOM and FDOM, respectively, compared to pool bottom waters. The observed differences between pool surface and bottom waters were consistent with shifts in CDOM and FDOM following experimental photodegradation of pool bottom waters. To improve FDOM
iii
ACKNOWLEDGEMENTS
iv
TABLE OF CONTENTS
LIST OF TABLES ... vii
LIST OF FIGURES ... viii
LIST OF ABREVIATIONS AND SYMBOLS... xii
Chapter I. Stratification Influences on Instream Carbon Chemistry and Export within a Beaded Arctic Stream ... 1
INTRODUCTION ... 2
SITE DESCRIPTION ... 5
METHODS ... 6
Weather ... 6
Sunlight attenuation ... 7
In-situ monitoring ... 7
Sampling ... 8
DOM quantity and quality ... 9
Total dissolved iron ... 10
ICP-OES ... 10
Ferrozine assay ... 11
Effects of iron on CDOM and FDOM ... 11
DOM photodegradation ... 12
RESULTS ... 12
Weather patterns ... 12
Physical characteristics of Imnavait Creek ... 13
v
Water track 8 ... 14
Hillslope soil waters ... 15
Pool bottom water ... 16
Pool surface water ... 16
Effect of stratification on pool chemistry ... 17
Effects of iron on CDOM and FDOM ... 19
Photodegradation of DOM in Imnavait Creek water ... 21
DISCUSSION ... 21
Pool bottom water chemistry driven by soil water inputs ... 21
aCDOM,λ is the main UV-light absorbing constituent in Imnavait surface waters ... 23
Photodegradation of DOM in surface waters can account for depth differences in DOM quality ... 24
Assessing the influence of iron on CDOM and FDOM ... 25
CONCLUSIONS ... 29
TABLES ... 31
FIGURES ... 33
II. Aqualog fluorometer for FDOM analysis: evaluation, optimization, and comparison to a conventional fluorometer………38
INTRODUCTION ... 39
METHODS ... 43
Optimizing analysis of CDOM and FDOM using the Aqualog ... 43
Solution preparation ... 43
DOM characterization ... 44
Comparison of Aqualog to Fluoromax-4 ... 46
Sample analysis ... 46
Inter-instrument correction factor ... 48
vi
Absorbance ... 48
Excitation and emission increments ... 49
Inner-filter effects ... 49
Order of corrections ... 50
Effect of concentration ... 50
Minimizing instrument bias ... 51
Instrument-specific correction factors ... 51
Empirical inter-instrument correction factors ... 52
CONCLUSIONS AND RECOMMENDATIONS ... 53
FIGURES ... 56
APPENDIX ... 67
Supporting Information for Chapter One ... 67
vii
LIST OF TABLES
Table
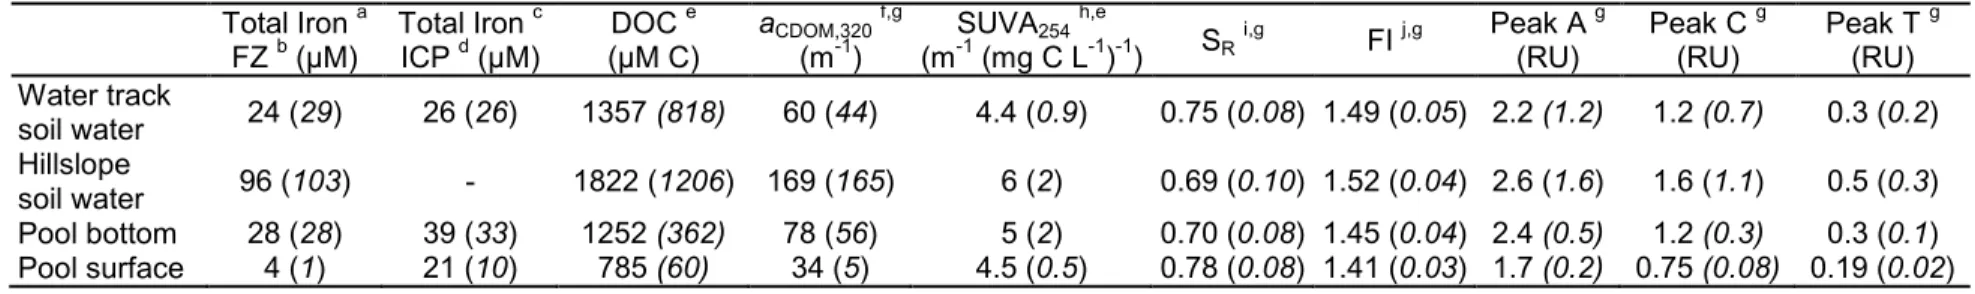
1. Mean and (standard deviation) of iron and DOM chemistry by
sample location at Imnavait Creek. ... 31 2. Mean percent change and (standard error) of DOM chemistry of
Imnavait Creek pool bottom waters after exposure to 12 h of
viii
LIST OF FIGURES
Figure
1.1 Weather variables were measured at Imnavait Creek and Toolik Field Station (TFS). Solar radiation measured at TFS exhibited diel fluctuations in both the UVB (dashed line) and UVA (solid line) (A). Air temperature at Imnavait Creek during the study period exhibited diel fluctuations and the average air
temperature during the study period was 8.7 °C (B). The 2011 summer was overall dry with a few small precipitation events and a total of 7.4 cm of precipitation at Imnavait Creek during
the study period (C)……….…. 33 1.2 Temperature at depths measured from the bottom of the pool.
Pools 2, 3, 5, 6, and 7 were stratified for most of the summer; they were mixed briefly following a storm on 17 July 2011 and re-stratified within four or five days. Pool 1 mixed every night. The shallow depth of pool 4 (0.2 m) likely contributed to it
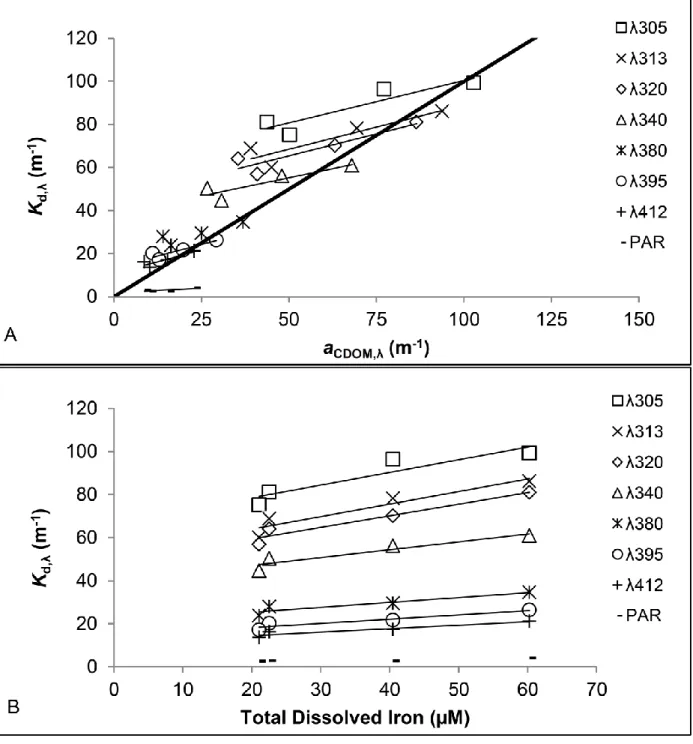
never stratifying …... 34 1.3 The light attenuation coefficients (Kd,λ) were positively
correlated with both (A) CDOM absorption coefficients (aCDOM,λ) shown with a 1:1 line (thick solid line) and (B)
concentrations of total dissolved iron in pool waters on 27 June, 2011. Linear regressions between Kd,λ and both aCDOM,λ and
total dissolved iron are shown (thin solid lines). Kd,λ was less
than aCDOM,λ in each pool except pool 2 (i.e., points fall above the 1:1 line)... 35
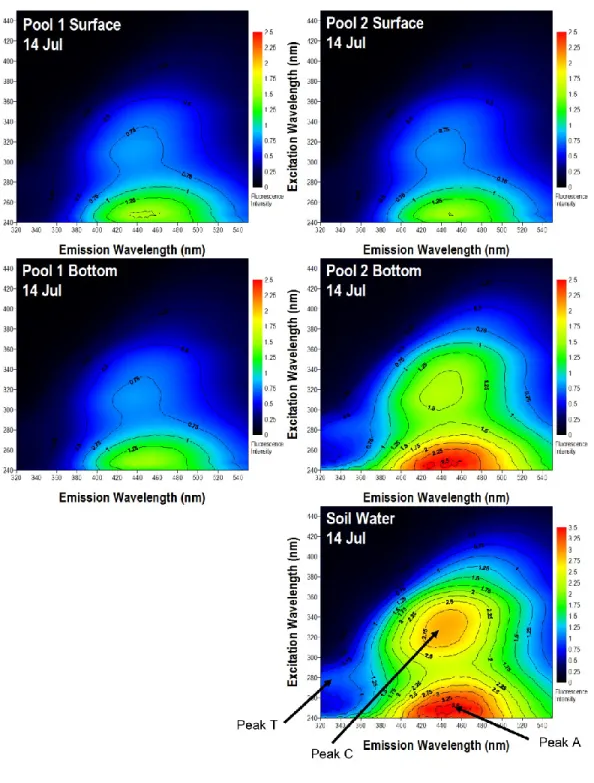
1.4 Representative EEMs of surface and bottom waters of a mixed (pool 1) and unmixed (pool 2) pool in Imnavait Creek and soil water feeding into Imnavait Creek from 14 July, 2011. The three characteristic FDOM peak regions (A, C, and T) are indicated on the soil water EEM. FDOM peak positions and intensity are similar in soil water and stratified bottom water. Likewise, the FDOM peak positions and intensity of surface
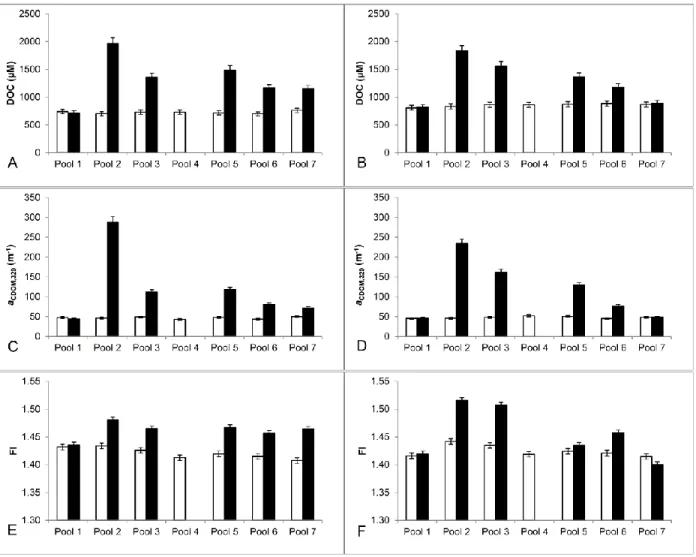
water and mixed bottom water are also similar……….... 36 1.5 DOM quantity was greater and more variable in quality in the
bottom waters (shaded bars) of stratified Imnavait Creek pools compared to the surface waters (open bars). The quantity of DOC was greater in the bottom waters of the stratified pools on 14 July, 2011 (A) and again on 4 August, 2011 (B), following re-stratification after a storm-induced mixing event. The absorption coefficient of DOM at 320 nm (aCDOM,320) was
ix
fluorescence index (FI) of the bottom waters was greater than the surface waters in the stratified pools on both 14 July, 2011 (E) and 4 August, 2011 (F). Pool 7 does not exhibit the same recovery to pre-storm differences in chemistry as the other stratified pools. Pool 1 was mixed throughout the summer and did not show differences in surface and bottom values. Error
bars are of instrumental error………... 37 2.1 A representative EEM of DOM. The three characteristic
FDOM peak regions (A, C, and T) are indicated. Peaks A and C are associated with humic material and peak T is amino acid
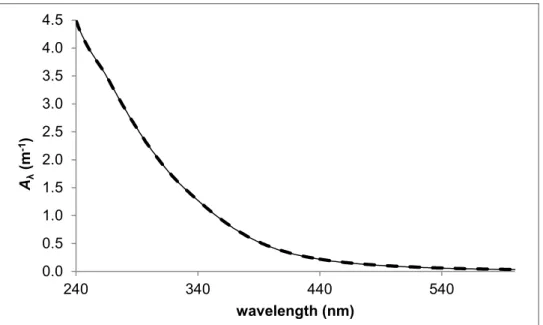
or protein like……….………..… 56 2.2 Average (n = 3) absorbance spectra of SRFA (nominal DOC =
50 mg C L-1) interpolated to 1 nm increments collected at 3 nm increments (dashed line) and 5 nm increments (solid line). The
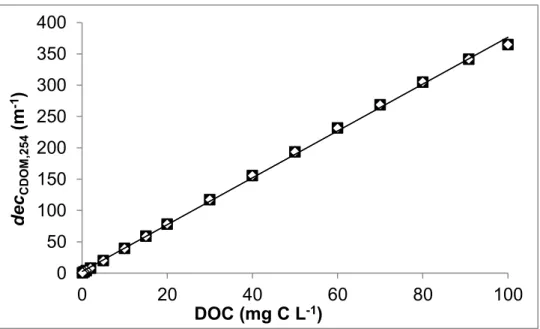
spectra overlap nearly exactly at all wavelengths………….………..…. 57 2.3 Absorption coefficients (mean ± SE) were highly correlated
with DOC (e.g., decadic absorption coefficient at 254 nm;
decCDOM,245; r2 ≥ 0.99). Absorbance was collected at both 5 nm
(black squares) and 3 nm (hollow diamonds) increments and interpolated to 1 nm increments. Error bars smaller than the
symbols are not visible………...………..… 58 2.4 The fluorescence intensity (RU) at peaks A, C, and T (mean ±
SE) collected with excitation/emission increments of 5/1.64 nm/nm (black squares) and 3/3.28 nm/nm (hollow diamonds) is plotted against CDOM concentration (decadic absorption coefficient at 254 nm; dec CDOM,254) along with the linear
relationship between fluorescence intensity at each peak and
CDOM concentration of samples with dec CDOM,254 ≤ 60 m-1…….………... 59
2.5 The uncorrected fluorescence intensity (RU) of peaks A, C, and T (mean ± SE) collected with excitation/emission increments of 5/1.64 nm/nm (black squares) and 3/3.28 nm/nm (hollow diamonds) are plotted against CDOM concentration (decadic absorption coefficient at 254 nm; decCDOM,254) all show a
strongly non-linear response with increasing concentration of CDOM…... 60 2.6 Emission spectra at excitation 255 nm of an EEM corrected
following the Chapman Conference order of operations (solid line) and an EEM corrected following the Horiba Aqualog software order of operations (dashed line). Correction
x
Raman scattering compared to EEMs corrected with the Horiba Aqualog software order of operations (i.e., instrument-specific
excitation and emission correction, blank subtraction, IFE………..……..…. 61 2.7 Slope ratio (SR) and fluorescence index (FI) (mean ± SE, n = 3)
of 100 mg C L-1 SRFA analyzed at 16 dilutions factors, 1 to 1000 (corresponding to DOC concentrations of 100 to 0.1 mg C L-1), and then corrected for dilution. SR and FI values are
plotted against dilution factor (on a log scale). Samples were analyzed with excitation/emission increments of both 5/1.64
nm/nm (hollow diamonds) and 3/3.28 nm/nm (black squares)…………...…. 62 2.8 Forty samples spanning a range of DOC and CDOM
concentrations were analyzed on both the Fluoromax-4 and the Aqualog and corrected following the Chapman Conference order. The paired corrected EEMs were used to develop two empirical correction factors between the Fluoromax-4 and the Aqualog: one used Fluoromax-4 EEMs corrected with excorr FM-rhod and emcorrFM-OrigHoriba and the other with excorrFM-HoribaKit
and emcorrFM-SRM. (A) the FI from analysis on the Aqualog
plotted against FI from analysis on the Fluoromax-4 corrected using excorrFM-rhod and emcorrFM-OrigHoriba (open triangles) and
the Aqualog FI versus the same corrected Fluoromax-4 further corrected with an empirically derived correction factor between the two instruments (black triangles). (B) the corrected
Aqualog FI values versus the excorrFM-HoribaKit and emcorrFM-SRM
corrected Fluoromax-4 FI values (open circles) and the Aqualog FI values versus the same corrected Fluoromax-4 FI values further corrected with an empirically derived correction factor between the two instruments (black circles). (C) and (D) the percent difference of the inter-instrument empirically corrected Fluoromax-4 and Aqualog FI values plotted against aCDOM,320
revealing a systematic bias in the results………..…….... 63 2.9 The fluorescence intensity at peaks A, C, and T as measured on
the Fluoromax-4 and Aqualog plotted against each other along with a 1:1 line. Triangles are used for samples where the Fluoromax-4 data was corrected using excorrFM-rhod and
emcorrFM-OrigHoriba. Circles are used for samples where the
Fluroomax-4 data corrected using the excorrFM-HoribaKit and
emcorrFM-SRM. Open symbols represent samples corrected only
with the respective instrument-specific correction factors and shaded symbols represent samples further corrected with an
empirically derived inter-instrument correction factor……….... 64 2.10 The ratio of fluorescence intensity of peaks C to A (C/A) and T
xi
against each other along with a 1:1 line. Triangles are used for samples where the Fluoromax-4 data was corrected using excorrFM-rhod and emcorrFM-OrigHoriba. Circles are used for
samples where the Fluroomax-4 data corrected using excorr FM-HoribaKit and emcorrFM-SRM. Open symbols represent samples
corrected only with the respective instrument-specific correction factors and shaded symbols represent samples further corrected
with an empirically derived inter-instrument correction factor……….... 66 SI.1 During an intensive monitoring of pool 2 under stratified
conditions, the surface water (dashed line) exhibited diel fluctuations in dissolved oxygen concentrations but was always well oxygenated (percent saturation ranged from 73 to 95 %). The bottom water (solid line) was anoxic during the entire period except for a brief period of stabilization follow the probe
installation……… 67 SI.2 Specific UV absorbance at 254 nm (SUVA254) values of surface
(open bars) and bottom (shaded bars) waters on 14 July, 2011 (error bars of average replicate instrumental analytical error are smaller than can be resolved). Stratified pools almost always had higher SUVA254 in the bottom waters than the surface
waters. There was no significant difference in SUVA254 in pool
1, which mixed daily. Stratified pool 7 also had no significant
difference between the surface and bottom………...………..…. 68 SI.3 Slope ratio (SR) values of surface (open bars) and bottom
(shaded bars) waters on 14 July, 2011 (error bars of average replicate instrumental analytical error are smaller than can be resolved). Stratified pools almost always had higher SR in the
surface waters than the bottom waters. There was no significant difference in SR in pool 1, which mixed daily. Stratified pool 7
showed lower SR in the surface compared to bottom, which is
the only pool sampled on any date that showed lower SR in the
xii
LIST OF ABREVIATIONS AND SYMBOLS
aCDOM,λ Naperian absorption coefficient of CDOM at wavelength λ
Aem Decadic absorbance by CDOM at the emission wavelength
Aex Decadic absorbance by CDOM at the excitation wavelength
Aλ Absorbance reading at wavelength λ
C Carbon
CCD Charge-coupled device
CDOM Chromophoric dissolved organic matter
CO2 Carbon dioxide
decCDOM,254 decadic absorption coefficient of CDOM at 254 nm
DFB Deferoxamine mesylate
DI Laboratory grade deionized water DOC Dissolved organic carbon
DOM Dissolved organic matter EEM Excitation-emission matrix
emcorrFM-OrigHoriba Original Horiba-provided emission correction factor for the
Fluoromax-4
emcorrFM-SRM Emission correction factor generated using Horiba’s NIST
standard reference materials for the Fluoromax-4
excorrFM-rhod User-generated rhodamine excitation correction factor for the
Fluoromax-4
excorrFM-HoribaKit Excitation correction factor created with a Horiba excitation
correction kit (Excitation Correction Factor Kit, F-3028, Horiba) for the Fluoromax-4
xiii
Eλ Downwelling irradiance
FDOM Fluorescent dissolved organic matter
FI Fluorescence index
HCl Hydrochloric acid
IFE Inner-filter effect
Kd,λ Attenuation coefficient at wavelength λ
l pathlength
NIST National Institute of Standards and Technology PAR Photosynthetically active radiation
Pg Petagram
PLFA Pony Lake fulvic acid
RU Raman units
SE Standard error
SD Standard deviation
SR Slope ratio
SRFA Suwannee River fulvic acid
SUVA254 Specific UV absorbance at 254 nm
TMG Trace-metal grade
z Depth
z1% Depth of 1% surface irradiance
CHAPTER ONE
Stratification Influences on Instream Carbon Chemistry and Export within a Beaded Arctic Stream
I investigated the effect of stratification in pools of a beaded stream on the
2
INTRODUCTION
Dissolved organic matter (DOM) is arguably the most important pool of carbon (C) on Earth. It is the largest C pool in the ocean (Sarmiento and Sundquist, 1992), similar in size to the amount of C in the atmosphere. DOM is also the largest flux of organic C from land to oceans worldwide (Cauwet, 2002; Schlesinger and Melack, 1981). Despite its relatively refractory mean nature and age (mean age ~1000 years), some DOM fractions are highly reactive and each year the conversion of DOM to carbon dioxide (CO2) accounts for as much CO2 released from inland waters to the atmosphere
as the net ocean absorption from the atmosphere (Battin et al., 2009; Cole et al., 2007). DOM from land is thus a critical intermediate in the global C cycle. When DOM enters aquatic systems it meets one of three fates: (1) complete oxidation to CO2 and carbon
monoxide, (2) partial oxidation to compounds that may be biogeochemically labile or recalcitrant and subsequent transport to marine systems, or (3) conversion to particulate organic matter by flocculation or incorporation into microbial biomass, followed by sedimentation and burial. Of these fates, complete and partial oxidation of DOM by sunlight and microorganisms to CO2 or to DOM exported to the ocean are dominant.
What controls the relative magnitudes of these two pathways is poorly known, but both pathways have important implications for C budgets.
Transfers of C from soils to surface waters are especially strong in the Arctic (Kling et al., 1991), where soils currently store twice the C found in the atmosphere (Ping et al., 2008; Tarnocai et al., 2009) and where C fluxes from surface waters to the
3
terrestrial sink of 0.4 ± 0.4 Pg C y-1; McGuire et al., 2009). Recent work has shown that photodegradation of DOM from arctic soils can increase the microbial processing of DOM by more than 40 % (Cory et al., 2013). Therefore, rates of DOM photodegradation are critical to understand the impact of thawing arctic soil C on greenhouse gases sources from the Arctic that may create a positive feedback on global warming (Schuur et al., 2008; Serreze and Francis, 2006).
Rates and extent of DOM photodegradation depend on its exposure history and residence time in sunlit surface waters (Cory et al., 2007, 2013; Miller et al., 2009b). Residence time in sunlit surface layers depends on light attenuation of the water column, stratification, and water transit time. The residence time of DOM in sunlit surface is also influenced by storage within hillslope, riparian, and transient zones, which includes in-channel and hyporheic storage (e.g., Bencala and Walters, 1983; McGlynn et al., 1999; McGuire et al., 2007; McNamara et al., 1998; Morrice et al., 1997; Mulholland et al., 1990; Stieglitz et al., 2003). The balance of sunlit surface exposure vs. storage in dark areas may be particularly important for DOM fate in tundra environments (e.g., Brooks and Williams, 1999; McNamara et al., 2008), where headwater streams are shallow (high light exposure) and underlain with permafrost.
For example, Merck et al. (2012) showed differences in DOM quantity and quality between bottom and surface waters of a beaded stream in the Alaskan Arctic that were consistent with extensive photodegradation of DOM in the surface waters.
4
2007). They attributed DOM photodegradation in the surface waters to increased in-pool storage due to strong stratification in the pools. They hypothesized that absorption of solar radiation by DOM was a key factor contributing to stratification because sunlight is rapidly attenuated in waters with high chromophoric DOM (CDOM), restricting the warming of water by solar radiation to the surface layers. The consistent separation of surface and bottom water masses in each pool of the beaded stream results in increased travel times through beaded streams in arctic watersheds, thus affecting the evolution of DOM chemistry and its downstream export.
However, although FDOM has been used as a tracer for DOM source and its photo-exposure history (e.g., Cory et al., 2007), most of this work has been conducted on isolated fractions of DOM or on DOM in low-iron waters (e.g., Biddanda and Cotner, 2003; Miller et al., 2009b). High dissolved iron concentrations in surface waters of the Alaskan Arctic due to export of reduced ferrous iron from soil waters (e.g., Lipson et al., 2010, 2012) may complicate the interpretations of DOM source and degradation along soil flowpaths and in streams. This is because iron can quench DOM fluorescence (Pullin et al., 2007), thereby directly altering the FDOM signature. Alternatively, oxidation of ferrous iron in surface waters may lead to adsorption and subsequent precipitation of DOM (Pullin et al., 2004), which has been suggested to alter DOM quality in a manner similar to DOM photodegradation.
5
Weishaar et al., 2003) and may thus contribute to light attenuation. While Gareis (2010) suggested that CDOM was important for light absorption and attenuation in Arctic lakes of the Mackenzie Delta, the role of CDOM in light absorption in high-iron waters has not been investigated.
Thus, to expand on the Merck et al. (2012) findings that suggested a feedback between absorption of sunlight by DOM in beaded streams leading to extensive
photodegradation of DOM in sunlit surface waters, I investigated (1) the role of DOM in sunlight attenuation in beaded streams, (2) whether photodegradation could account for the differences in DOM quality previously observed between surface and bottom waters, and (3) the influence of iron on CDOM and FDOM quantity and quality.
SITE DESCRIPTION
Imnavait Creek is a headwater beaded stream located on the North Slope of Alaska in a glacial valley formed during the Sagavanirktok glaciation in the Kuparuk River basin at latitude 68.616 N and longitude 149.318 W (Detterman et al., 1958; Hamilton, 1986). The creek primarily lies in the organic soil layer and only occasionally cuts through to the mineral soil (McNamara et al., 1998). The connected pools, or beads, were formed by the erosion and melting of large ice deposits that had underlain the creek (McNamara et al., 1998; Walker et al., 1989).
6
produced by the largest summer storm events (McNamara et al., 2008). Runoff travels both overland and through the subsurface, especially through water tracks that occur along the hillslope. The water paths are limited to the active layer as the region is underlain with up to several hundred meters of permafrost, which effectively separates the active layer from any deep ground waters (Osterkamp and Payne, 1981). Previous studies found typical seasonally thawed active layer depths at this site ranged from 25 to 40 cm, occasionally extending to 100 cm (Hinzman et al., 1991); this is consistent with thaw depths measured in this study, which ranged from 13 to 81 cm. Inputs from the riparian zone occur through both surface flow and diffuse subsurface flow (Kane et al., 2000). In addition to connecting chutes, water travels between pools through side tracks with both subsurface flow through the active layer and above surface flow during high water events (Merck et al., 2011).
I studied an approximately 120 m reach of the creek consisting of a series of seven pools connected by short chutes. Pools were named starting with pool 1 and proceeding downstream sequentially to pool 7. Pool surface areas ranged from 2 to 129 m2 and volumes ranged from 0.1 to 102 m3. Along the reach of creek studied, one water track drains from the adjacent eastern hillslope, referred to as water track 8.
METHODS
Weather
Air temperature 1 m above the ground and precipitation were measured hourly at a meteorological station on the west-facing ridge of the Imnavait Creek basin
approximately 1 km upstream of the study site using a temperature probe (model
7
(Kane and Hinzman, 2011). UVA and UVB solar radiation were measured at 5 min intervals at Toolik Field Station (TFS) located approximately 11 km west of Imnavait Creek with pyranometers (UVA-1 and UVB-1; Yankee Environmental System, Turner Falls, MA).
Sunlight attenuation
Light attenuation with depth was measured in pools 1, 2, 3, and 6 on 28 June, 2011 using a compact optical profiling system for UV light in natural waters (UV C-OPS; Biospherical Instruments Inc., San Diego, CA). The C-OPS measured downwelling cosine-corrected irradiance at 7 wavebands (305, 313, 320, 340, 380, 395, and 412 nm) and photosynthetically active radiation (PAR). Attenuation coefficients (Kd,λ) were
calculated from the downwelling irradiance (Eλ) as a function of depth (z) at each
waveband:
(1)
Based on multiple casts in each pool (n = 1 to 5), the coefficient of variation of
Kd,λ ranged from 1 to 3 % in the UV and 9 % for PAR. Means ± standard deviation (SD)
of Kd,λ are reported unless otherwise noted.
In-situ monitoring
Temperature sensor arrays (HOBO® Water Temp Pro v2; Onset Computer Corporation, Inc., Bourne, MA) were deployed vertically in each pool (n = 1 to 5 per pool) from late-June through mid-August, 2011 measuring at 5 minute intervals. The probes were wrapped with aluminum foil to prevent radiation-caused heating (Neilson et al., 2010) and placed starting 10 to 15 cm from the bottom of the pool and then at
8
monitoring of pool 2 was conducted for one week in July, 2011 consisting of two sondes deployed near the surface and bottom of the pool with oxygen, pH, specific conductance, and temperature probes (YSI 6920 V2 sonde with ROXTM optical dissolved oxygen, 6561 pH, 6560 conductivity, and 6560 temperature sensors; YSI Inc., Yellow Springs, OH) measuring in-situ at 15 minute intervals.
Sampling
9
iron analysis via inductively coupled plasma optical emission spectrometer (ICP-OES) were filtered through 0.45 µm polypropylene filters (Whatman). Filtering introduced air into water samples collected from anoxic pool bottom or soil waters.
DOM quantity and quality
Dissolved organic carbon (DOC) samples were acidified with trace-metal grade hydrochloric acid (TMG HCl) to approximately pH 2 to 3 after filtration and stored in the dark at 4 C until analysis using a high-temperature platinum-catalyzed combustion followed by infrared detection of CO2 (Shimadzu TOC-5000; Shimadzu, Columbia,
MD).
The chromophoric and fluorescent fractions of DOM (CDOM and FDOM, respectively) were analyzed within hours to at most several days of collection. Samples were stored in the dark at 4 ºC until warmed to room temperature (20 to 25 °C) just prior to analysis.
UV-Vis absorbance spectra of CDOM were collected using 1-cm path length quartz cuvettes with a spectrophotometer (USB 2000+UV-VIS; Ocean Optics, Inc., Dunedin, FL). Sample absorption was measured against laboratory-grade deionized (DI) water blanks (Barnstead E-Pure and B-Pure; Barnstead Thermolyne, Dubuque, IA). The spectral slope ratio (SR) was calculated from the absorbance spectrum of each sample as
the ratio of the slope from 275 to 295 nm to the slope from 350 to 400 nm following Helms et al. (2008). CDOM absorption coefficients (aCDOM,λ) were calculated as follows:
303 . 2 ,
l A
aCDOM
(2)
10
divided by the cuvette pathlength (m) and then divided by the DOC concentration (mg C L-1).
Excitation-emission matrices (EEMs) were measured on all water samples with a Fluoromax-4 fluorometer (Horiba Scientific, Edison, NJ) following the procedures of Cory et al. (2010). An aliquot of sample was placed in the 1-cm quartz cuvette for each EEM and diluted with DI if necessary to bring A254 < 0.6. EEMs were corrected for
inner-filter effects and for instrument-specific excitation and emission corrections in Matlab (version 7.7) following Cory et al. (2010). The fluorescence index (FI; McKnight et al., 2001) was calculated from each corrected EEM as the ratio of emission intensity at 470 nm over the emission intensity at 520 nm at an excitation wavelength of 370 nm (Cory et al., 2010). Emission intensity at FDOM peaks A, C, and T was evaluated at excitation/emission pairs 250/450, 350/450, 275/340 (nm/nm), respectively, in RU (Coble et al., 1990). Mean ± SD are reported unless otherwise noted.
Total dissolved iron
ICP-OES
11
Ferrozine assay
Aliquots of filtered water were shipped to the laboratory in Chapel Hill, North Carolina for iron analysis. Total time between collection and analysis ranged from two weeks to two months. Samples were stored at 4 C until analysis, but were not acidified. Although oxidation of ferrous iron is expected to be slower in the acidic water of
Imnavait Creek (mean pH = 5.8 ± 0.5) compared to near-neutral waters (Pullin and Cabaniss, 2003a; Stumm and Lee, 1961), it is likely that the dissolved total iron
concentration measured in the lab were lower than field values due to oxidation of ferrous iron and precipitation of ferric iron.
Total iron was quantified on all samples using the ferrozine assay (Stookey, 1970). Briefly, 2 mL of sample was reduced via the addition of 200 µL of 6.25 M hydroxylamine hydrochloride and then reacted with 100 µL of 15 mM ferrozine in 15 mM HEPES buffer (pH 7) for 45 minutes prior to measuring the absorbance at 562 nm. Absorbance of the sample solution plus ferrozine-ferrous iron complex was corrected for the absorbance of CDOM at 562 nm. The concentration of iron was calculated using a nine-point calibration curve consisting of similarly analyzed solutions of ferrous
ammonium sulfate (0 to 50 µM in 0.01 M TMG HCl). Samples exceeding 50 µM were diluted with DI at the time of analysis. Mean ± SD are reported unless otherwise noted.
Effects of iron on CDOM and FDOM
12
stored in the dark at 4 °C prior to experimentation. A stock solution of 0.22 mM DFB in DI was prepared immediately prior to addition to samples. DFB was added to an aliquot of each sample to achieve a molar ratio of 0.2 DFB to total dissolved iron measured via ferrozine assay. Controls consisted of sample plus DI providing the same dilution. DFB reacted samples and DI controls were allowed to equilibrate for 48 hours at room
temperature in the dark and then subsamples were analyzed for CDOM, FDOM, and total dissolved iron via ferrozine assay as described above.
DOM photodegradation
Pool bottom water collected in amber HDPE bottles in the field was brought back to TFS for photochemical degradation experiments as described in Cory et al. (2013). Briefly, four replicates of GF/F-filtered water samples placed in 12-mL pre-combusted borosilicate Exetainer® vials (Labco Ltd.; Ceredigion, UK) were exposed to natural sunlight for 12 hours alongside four foil-wrapped dark control vials at temperatures ranging from 10 to 16 °C. Although borosilicate glass is not as UV transparent as quartz the difference is quite small for light from 280 through 400 nm, 83 vs. 86 percent
transmittance respectively (Miller et al., 2009a). After exposure to light, subsamples were analyzed for CDOM and FDOM as described above. Changes in DOM quality are reported as mean ± standard error (SE) unless otherwise noted.
RESULTS
Weather patterns
13
August, 2011 (Fig. 1.1). Four precipitation events exceeded 2 mm of water per hour and a total of 7.4 cm of precipitation occurred at Imnavait during the study period (Fig. 1.1).
Physical characteristics of Imnavait Creek
Pools 2, 3, 5, 6, and 7 were thermally stratified on 43 to 46 out of 50 days investigated in the summer of 2011, where stratification was quantified as layers of continuously different temperature water (Fig. 1.2). Pools 1 and 4 did not exhibit the same stratification patterns observed in pools 2, 3, 5, 6, and 7. Pool 1 mixed daily and the shallow depth of pool 4 (0.2 m) in comparison to the mean depths of other pools (1.5 m) likely prevented stratification.
The regularly stratified pools (2, 3, 5, 6, and 7) mixed within hours after a
precipitation event on 17 July, 2011 (Fig. 1.1 and 1.2). Temperature profiles of the pools show that re-stratification occurred within four to five days following the initial
precipitation-driven mixing event (Fig. 1.2).
UV attenuation coefficients, Kd,λ, decreased exponentially with increasing
wavelength, ranging from 88 ± 12 m-1 at 305 nm to 17 ± 3 m-1 at 412 nm. PAR attenuation coefficients were 3 ± 1 m-1. Thus the depth of 1% surface irradiance (z1%)
was < 8 cm in the UVB and 6 to 27 cm in the UVA range. PAR penetrated deepest in the water column, with z1%up to 1.8 m. Given that the depth of pools in which sunlight
14
Kd,λ in the UVB was strongly positively correlated with DOC concentrations in
Imnavait Creek pools (r2 ≥ 0.80, p ≤ 0.10, n = 4 pools; data not shown). Kd,λ was also
strongly positively correlated with aCDOM,λ at all wavelengths measured except 380 nm,
(r2 ≥ 0.81, p ≤ 0.10, n = 4 pools; Fig. 1.3a). On average aCDOM,λ was 84 % of Kd,λ in the
UVB compared to 88 % in the UVA. Differences between aCDOM,λ measured on filtered
water using a UV-Vis spectrophotometer, and in-situ Kd,λ varied by wavelength (Fig.
1.3a). For example, differences between aCDOM,λ and Kd,λ were smaller in the UVA
compared to the UVB (Fig. 1.3a).
Kd,λ was strongly positively correlated with concentrations of total dissolved iron
at all wavelengths measured except PAR, (r2 ≥ 0.85, p < 0.10, n = 4 pools; Fig. 1.3b). The slope of Kd,λ vs. total iron was greater at lower wavelengths (305 to 380 nm) in
contrast to small changes in Kd,λ with increasing iron concentration at 395 and 412 nm
and PAR (Fig. 1.3b). However, likely due to the small sample size for Kd,λ (n = 4 pools),
there were no significant differences in the slopes of the correlations between Kd,λ and
total dissolved iron.
Soil water
Water track 8
Water track 8 soil water samples had a mean conductivity of 26 ± 14 µS, mean pH was 5.2. Water track 8 soil water DOC concentrations ranged from 493 to 4953 µM C with a mean of 1357 ± 818 µM C (Table 1). The mean CDOM absorption coefficient at 320 nm (aCDOM,320), a measure of the concentration of CDOM, was 60 ± 44 m-1. Mean
SUVA254, a proxy for DOM aromaticity (Weishaar et al., 2003), was 4.4 ± 0.9 m-1 (mg C
15
et al., 2008), was 0.75 ± 0.08. Mean fluorescence index (FI), a proxy for aromaticity of the fulvic acid fraction (McKnight et al., 2001) or photo-processing (Cory et al., 2007), was 1.49 ± 0.05.
Analysis of FDOM provides insight into three types of carbon within the DOM pool: carbon associated with terrigenous or microbial source material (peaks A and C) and carbon associated with free or combined fluorescent amino acids (peak T),
specifically tryptophan, tyrosine, and phenylalanine (Coble et al., 1990; representative EEM shown in Fig. 1.4). The mean peak A intensity for water track 8 soil water was 2.2 ± 1.2 RU. The mean ratio of FDOM intensities at peaks C and A (C/A) was 0.54 ± 0.05 and the mean ratio of peaks T and A (T/A) was 0.14 ± 0.05.
There was overlap in both the range and mean concentration of total dissolved iron in the water track soil water measured by ICP-OES and the colorimetric ferrozine assay (Table 1). The water track 8 soil water concentrations of total dissolved iron measured via ICP-OES ranged from 2 to 107 µM with a mean concentration of 26 ± 26 µM. Concentrations of total dissolved iron measured via ferrozine assay ranged from 1 to 111 µM with a mean of 24 ± 29 µM.
Hillslope soil waters
Hillslope soil water DOC concentrations ranged from 442 to 6881 µM C with a mean of 1882 ± 1206 µM C (Table 1). Mean aCDOM,320 was 169 ± 165 m-1. Mean
SUVA254 was 6 ± 2 m-1 (mg C L-1)-1. Mean SR of hillslope soil water was 0.69 ± 0.10
16
hillslope soil waters measured via ferrozine assay ranged from < 1 to 563 µM with a mean of 96 ± 103 µM.
Pool bottom water
When stratified, pool bottom waters had an average conductivity of 37 ± 30 µS cm-1 and average pH of 5.5. The bottom water of pool 2 was always anoxic when stratified based on week-long in-situ probe data collected in July, 2011 during stratified conditions (supporting information Fig. 1.1).
The mean concentration of DOC in the pool bottom water was 1252 ± 362 µM C. Mean aCDOM,320 was 78 ± 56 m-1 (Table 1). Mean SUVA254 was 5 ± 2 m-1 (mg C L-1)-1.
Mean SR of the pool bottom water was 0.70 ± 0.08 and mean FI was 1.45 ± 0.04. Mean
bottom water FDOM intensity at peak A was 2.4 ± 0.5 RU. The mean ratio of FDOM intensities C/A was 0.49 ± 0.04 and the mean ratio of T/A was 0.13 ± 0.04 (representative EEMs in Fig. 1.4).
There was overlap in both the range and mean concentration of total dissolved iron in the pool bottom waters measured by ICP-OES and the colorimetric ferrozine assay (Table 1). Total dissolved iron concentrations in the pool bottom waters measured via ICP-OES ranged from 4 to 114 µM, with a mean of 39 ± 33 µM. Total dissolved iron concentrations measured via ferrozine assay ranged from 3 to 87 µM with a mean of 28 ± 28 µM.
Pool surface water
17
m-1 (mg C L-1)-1. Mean SR of DOM in the surface waters was 0.78 ± 0.08 and mean FI
was 1.41 ± 0.03. Mean surface water FDOM intensity at peak A was 1.2 ± 0.2 RU. The mean ratio of FDOM intensities at peaks C and A was 0.45 ± 0.02 and the mean ratio of peaks T and A was 0.12 ± 0.01 (representative EEMs in Fig. 1.4).
The range of total dissolved iron concentrations in the water track soil water measured by ICP-OES and the colorimetric ferrozine assay overlapped but the mean concentrations as measured by the two methods were significantly different (;Table 1). Total dissolved iron concentrations in pool surface waters measured via ICP-OES ranged from 4 to 46 µM with a mean of 21 ± 10 µM. Total dissolved iron measured via
ferrozine assay ranged from 2 to 7 µM with a mean of 4 ± 1 µM.
Effect of stratification on pool chemistry
High temporal resolution data collected under stratified conditions (i.e., no mixing events occurred) in pool 2 from 8 to 15 July, 2011 showed strong differences in
conductivity, pH, and dissolved oxygen (DO) between surface and bottom pool water in Imnavait Creek. During this period of strong stratification, the specific conductance of the surface water was significantly greater than the bottom water (paired t-test, p < 0.01) with mean values of 13 and 25 µS cm-1, respectively. Likewise, the pH was significantly higher in the surface water compared to bottom water (paired t-test, p < 0.01) with mean values of 5.8 vs. 5.4, respectively. The surface water DO concentration exhibited diel fluctuation but was consistently well oxygenated throughout this period; percent
saturation ranged from 73 to 95 %, with a mean concentration of 240 µM O2. The DO of
18
information Fig. 1.1). The concentration of DO in the surface water was significantly greater than the bottom waters (paired t-test, p < 0.01).
Stratified pools exhibited large differences in DOM quantity and quality. For example on 14 July, 2011, DOC concentrations were up to three times higher in pool bottom waters compared to the surface (Fig. 1.5). In contrast, mixed pool 1 had similar DOM quantity and quality in surface and bottom waters (Fig. 1.5). Stratified pool bottom waters also had significantly greater levels of CDOM and FDOM compared to surface waters (paired t-test, p < 0.01; Fig. 1.5). In addition, stratified pools exhibited differences in DOM quality. For example, surface waters almost always had significantly lower SUVA254 (paired t-test, p < 0.05; supporting information Fig. 1.2), significantly higher SR
(paired t-test, p < 0.01; supporting information Fig. 1.3), and significantly lower FI compared to bottom waters (paired t-test, p < 0.01; Fig. 1.5). There was no significant difference in SUVA254, SR, or FI in mixed pool 1 on 14 July, 2011. Stratified pool 7 also
had no significant depth difference in SUVA254. Stratified pool 7 had lower SR in the
surface compared to bottom waters, which is the only pool sampled on any date with lower SR in the surface compared to the bottom waters.
19
DOM quality and quantity and total dissolved iron concentrations were similar between different pool surface waters throughout the summer of 2011, in contrast to the variability as measured by SD in bottom water values over the season (Table 1). For example on 14 July, 2011, the average surface water DOC across all pools was 723 ± 23 μM C, while the average bottom water DOC was 1305 ± 415 μM C. aCDOM,320 exhibited
similar patterns, with a mean of 47 ± 3 m-1 in pool surface waters compared to higher mean and larger variability in pool bottom waters, 119 ± 87 m-1. Mean SUVA254 was 4.9
± 0.2 m-1 (mg C L-1)-1 in the pool surface waters compared to 6 ± 2 m-1 (mg C L-1)-1 in the pool bottom waters. Likewise, total iron concentrations on 14 July, 2011 were lower and less variable in pool surface waters, 3.2 ± 0.4 μM, compared to bottom waters, 26 ± 31 μM.
After the pools mixed on 17 July, 2011 (Fig. 1.1), the temperature data show that the pools began to re-stratify on 21 through 23 July, 2011 (Fig. 1.1). The direction and magnitude of the depth differences in DOM quantity and quality and in iron
concentration in Imnavait pool water sampled on 4 August, 2011, two weeks after the mixing event and the onset of re-stratification, were similar to the depth differences measured in the pools just prior to the mixing event (14 July, 2011; Fig. 1.5).
Effects of iron on CDOM and FDOM
Dissolved iron and its complexes absorb UV and visible light thus resulting in higher aCDOM,λ and SUVA254 than expected based on DOC concentrations alone
20
water samples to competitively scavenge iron from complexes with the natural DOM to evaluate the effects of iron on CDOM and FDOM. Addition of DFB decreased the ferrozine-accessible iron by 27 ± 5 %. If the iron bound by DFB (measured as iron no longer accessible by ferrozine) had been associated with CDOM and FDOM, the
expectation was that complexation by DFB would result in significant shifts in CDOM or FDOM quality and/or quantity.
There was no significant difference in aCDOM,254 of samples with and without the
addition of DFB (t-test, p > 0.05). DFB itself is weakly absorbing, a254 ≤ 0.1 m-1 in DI at
concentrations added to soil water samples compared to a254 ≥ 100 m-1 of unaltered soil
waters and therefore is not expected to significantly alter absorbance measurements. As expected based on previous work (Pullin et al., 2007), the addition of DFB to soil waters from Imnavait Creek reduced iron quenching of fluorescence and increased FDOM peak intensities. Addition of DFB to soil waters resulted in a significant increase in fluorescence intensity at peaks A, C, and T (t-test, p ≤ 0.05). The fluorescence
21
Photodegradation of DOM in Imnavait Creek water
Exposure of Imnavait Creek DOM to 12 hours of sunlight resulted in significant loss of CDOM and FDOM compared to dark controls (paired t-tests, p < 0.05; Table 2); on average there was a 9 % decrease in CDOM and FDOM (depending on wavelength). Photobleaching resulted in a significant increase in SR (from 0.74 ± < 0.01 to 0.87 ± <
0.01) and a significant decrease in the FI (from 1.55 ± < 0.01 to 1.35 ± < 0.01). There was a preferential loss of fluorescence at peak C compared to loss of intensity for peaks A or T upon exposure to sunlight. For example, peak C decreased by 26 ± < 1 %, peak A decreased by 11 ± 1 %, and the fluorescent intensity of peak T increased by 5 ± 2 % after exposure to sunlight. This preferential loss of fluorescence resulted in a significant shift in the ratio of the fluorescent intensity of C/A from 0.53 ± < 0.01 to 0.44 ± < 0.01 (t-test, p < 0.05) and a significant shift in the ratio of the fluorescent intensity of T/A from 0.09 ± < 0.01 to 0.11 ± < 0.01 (t-test, p < 0.05). Sunlight exposure also resulted in a significant blue-shift of the excitation and emission maxima of peaks A and C, i.e., shifted to lower wavelengths. For example, for photo-exposed DOM the excitation position of peak C was blue-shifted to lower wavelengths by 13 ± 3 nm (t-test, p < 0.05) and the emission peak was shifted to lower wavelengths by 6 ± 1 nm (t-test, p < 0.05) compared to dark controls.
DISCUSSION
Pool bottom water chemistry driven by soil water inputs
In all measures of water chemistry, pool bottom water more closely resembles soil water than pool surface water suggesting that the source of pool bottom water was
22
DOM and iron compared to surface waters. This is evident from the overlap in pH, conductivity, and concentrations of DOC, CDOM, FDOM, and total dissolved iron between both water track 8 and hillslope soil waters with pool bottom waters (Table 1). In contrast, pH, conductivity, and concentrations of DOC, CDOM, FDOM, and total dissolved iron in pool surface waters were significantly different compared to soil waters and pool bottom waters (Table 1; t-test, p < 0.05). Soil water inputs to the pools were also evident based on the similarities of the peak positions and intensities of EEMs of soil water and pool bottom water from a stratified pool (Fig 5; Merck et al., 2011).
Both the soil waters and the pool bottom waters exhibited larger variability in the concentration and quality of dissolved constituents (e.g., Fig. 1.5) both spatially and temporally across the season. It is likely that pool bottom water chemistry depends strongly on soil water inputs, which are affected by flowpaths and inflow volumes. The flowpaths, and thus the sources of soil waters to the different pools, likely change over the season due to shifts in preferential flowpaths along the hillslope and riparian zone. In contrast to the pool bottom waters, the smaller range of concentrations and quality of dissolved constituents across the pool surfaces suggest that the surface waters of the pools are connected and well-mixed (Table 1; Fig. 1.5). This mixing is highlighted by the fact that surface waters may stratify daily but tend to mix at night (Fig. 1.2).
23
variability observed at soil water sites located at the bottom of the hillslope, measured as standard deviation of each site sampled repeatedly during the study period, overlapped the range of standard deviation of all soil water sites at the bottom of the hillslope for each specific sampling date for DOC, aCDOM,320, SUVA254, SR, peak A, FI, and Fe. In
other words, the range of variability in concentrations observed at a given site across all sampling dates overlapped with the variability on a given sampling date across all those sites overlapped. Thus, both spatial and seasonal variability likely altered the inputs to the pool bottom waters. Despite these variations as well as likely changing flowpaths, soil water inputs still were high in DOC and iron and drove the light attenuation and thereby photo-processing of the pool surface waters and photo-protection of the pool bottom waters.
aCDOM,λ is the main UV-light absorbing constituent in Imnavait surface waters
CDOM accounted for most of the UVB and UVA light attenuation in the pools, given that aCDOM,λ was 84 to 88 % of Kd,λ in the UVB and UVA, respectively, consistent
with the literature showing that CDOM is the predominant light absorbing constituent in many surface waters (Gareis et al., 2010; Morris et al., 1995). For example across a range of lakes, aCDOM,λ accounted for on average 36 and 75 % of Kd,λ at 305 nm and PAR,
respectively (Morris et al., 1995).
Kd,λ is expected to be larger than or equal to aCDOM,λ in all water bodies due to
removal of other light absorbing or scattering particles during filtration before aCDOM,λ
analysis. However, the observations in pool 2 did not follow this expectation and thus fall below the 1:1 line (Fig. 1.3). The larger values of aCDOM,λ compared to Kd,λ in pool 2
24
elevated baseline due to scattering or (2) C-OPS measurement error. Only one C-OPS cast was made in pool 2, but the standard error of replicate casts (n = 3 to 5) in the other pools ranged from < 1 to 8 m-1 depending on wavelength and pool, representing on average 0.2 to 7.8 % of the average replicate Kd,λ. In pool 2, aCDOM,λ was 3.5 to 10.5 %
greater than Kd,λ. Thus, measurement error in Kd,λ could account for most of the observed
difference in Kd,λ and aCDOM,λ in pool 2.
Previous work has found that DOM increases the solubility of iron, likely due to the formation of iron-DOM complexes (Luther III et al., 1992; Maranger and Pullin, 2002; Pullin and Cabaniss, 2003b). Addition of iron to solutions containing DOM isolates can increase absorbance in the visible light range (Pullin et al., 2007), whereas freshly formed colloids of fulvic acid isolates and iron have been found to absorb most strongly in the UV region (Pullin and Cabaniss, 2003a). Thus, the larger increase in light attenuation with increasing iron concentration (i.e., greater slope) in the UVB compared to the UVA region (Fig. 1.3) suggests that organic complexes of iron may be an
important factor in UVB light attenuation in Imnavait Creek, in addition to attenuation by particulate iron and other particles not captured by either aCDOM,λ or total dissolved iron
analyses.
Photodegradation of DOM in surface waters can account for depth differences in
DOM quality
25
small but significant increase in the ratio of peak T to A compared to dark controls. Similarly, pool surface waters had lower CDOM and FDOM concentrations, higher SR,
lower FI, and a lower ratio of peak C to A, but, no significant difference in the ratio of peak T to A compared to pool bottom waters. These results suggest that photochemical reactions may be important controls on the differences observed between surface and bottom waters in stratified pools.
One difference in FDOM quality between surface and bottom waters not
explained by DOM photodegradation was the ratio of peak T to A. This ratio, which is a proxy for the labile fraction of DOM (Cory and Kaplan, 2012 and references therein), increased after experimental photo-exposure consistent with previous work showing that photodegradation increases the ratio of amino acid-like to terrestrial DOM (Cory et al., 2007), but there was no significant difference in the ratio of T/A between pool surface and bottom waters. A lack of observed difference in T/A between surface and bottom waters could be due to rapid use of the more labile fraction of DOM in the surface following photodegradation (Cory et al., 2013), thus minimizing the photochemical fingerprint of increased T/A ratio of the FDOM.
Assessing the influence of iron on CDOM and FDOM
Despite the lack of detectable change in aCDOM,λ upon addition of DFB, at the
average total dissolved iron and DOC concentrations of soil water samples from Imnavait we estimate that UV light absorption by free or complexed iron may increase SUVA254
26
iron-organic ligand. Using the average measured values of SUVA254 in the surface and
bottom waters of Imnavait Creek pools (Table 1) and the relationship between SUVA254
and aromaticity developed by Weishaar et al. (2003), we estimated the percent aromatic carbon content of the pool surface and bottom waters as 33 and 36 %, respectively. These values are slightly higher than the 23 % measured on the fulvic acid fraction of Imnavait DOM via 13C-NMR by Cory et al. (2007) given that analytical error is ± 5 % (Kögel-Knabner et al., 1991). DOM in unfractionated whole water likely has an aromatic C content less than or equal to the fulvic acid fraction of DOM (Cory et al., 2007); thus, 23 % is likely a maximum aromatic C content for Imnavait DOM, assuming the DOM collected in previous work is representative of the water in this study. Taken together, the SUVA254 based over-estimate of aromatic C is consistent with the presence of iron
increasing aCDOM,λ and thus SUVA254.
27
iron may be strongly associated with DOM, slowing its oxidation and slowing its competitive complexation with DFB.
Quenching of FDOM by iron likely alters the fluorescence of DOM in all waters sampled from Imnavait Creek, but the observed differences between pool surface and bottom waters are not fully explained by fluorescence quenching alone. The pool surface waters exhibited lower fluorescence at all peaks as well as a lower ratio of peak C to A and no change in the ratio of peak T to A compared to the pool bottom waters. However, quenching of DOM fluorescence would be expected to occur in both the surface and bottom waters due to the presence of iron at both depths (Table 1). The average ratios of DOC to total dissolved iron in the surface and bottom waters are similar when using the iron concentrations measured via ICP-OES (37 vs. 32 µM DOC C per µM Fe,
respectively) in the 0.45 µm filter fraction but quite different using the iron concentrations measured via ferrozine assay (196 vs. 45 µM DOC C per µM Fe,
28
The observed increase in fluorescence of soil waters following the addition of iron-ligand DFB shows that iron quenched the fluorescence of DOM in Imnavait Creek waters but did not alter the FI or fluorescence ratios between samples before and after addition of DFB, suggesting that these measures of DOM quality were not altered by the presence of iron. Further, the increase in fluorescence in soil water samples following the addition of DFB (5 to 10 % depending on the peak) was much less than the observed percent difference between pool surface and bottom waters, 30 to 38 % depending on the peak. The patterns of DOM quality between the surface and bottom waters are not consistent with the changes observed in samples equilibrated with DFB.
Iron may play a role in depth differences of DOM chemistry under stratified conditions because adsorption of DOM to iron particles or formation of iron-DOM colloids and subsequent precipitation in oxic surface waters may preferentially remove fractions of DOM (Brinkmann et al., 2003; Gao and Zepp, 1998; Pullin et al., 2004). Pullin et al. (2004) showed that adsorption to iron particles and photochemical degradation both alter DOM chemistry in the same way, such that the net effect of sunlight exposure on DOM in the presence of iron is greater than either process acting alone. Adsorption of photochemically reacted DOM to goethite produced solutions with lower molecular weight and less aromatic DOM than addition of goethite in the dark or photodegradation of DOM in the absence of goethite (Pullin et al., 2004). These
processes would be expected to result in an increase in SR, the proxy inversely related to
average molecular weight of DOM, and a decrease in SUVA254, a proxy for aromaticity,
29
the surface waters of Imnavait Creek is altered by the dual effects of photo-oxidation and adsorption to iron particles. For example, higher SR in the surface waters suggests lower
average molecular weight of the DOM compared to the bottom waters, consistent with fractionation due to adsorption of DOM to goethite, and lower SUVA254 in the surface
waters compared to the bottom waters suggests lower aromaticity. Although the depth differences are consistent with photochemical degradation of the DOM, the strong gradient in iron and DO between surface and bottom waters likely means that both photo-processing and iron-induced adsorption occur in this system.
CONCLUSIONS
An important consequence of high concentrations of terrestrially-derived CDOM and iron in Imnavait Creek was that nearly all UV light was attenuated within the top layer of water (i.e., z1% of UV light < 30 cm at all wavelengths) and even PAR light,
which reached the bottom of each pool measured, was attenuated by 50 % at 17 to 28 cm. Thus, DOM in the bottom waters was protected by the surface waters from
photodegradation. In pools where the water column mixed, all the DOM in the pool was susceptible to photodegradation. The fact that experimental photodegradation of
30
specific fractions of DOM from the surface waters and contribute to the observed differences between the bottom and surface waters of stratified pools.
Table 1. Mean and (standard deviation) of iron and DOM chemistry by sample location at Imnavait Creek.
Total Iron a
FZ b (µM) Total Iron
c
ICP d (µM) DOC
e
(µM C)
aCDOM,320f,g
(m-1) SUVA254
h,e
(m-1 (mg C L-1)-1) SRi,g FI j,g Peak A g
(RU) Peak C
g
(RU) Peak T
g
(RU) Water track
soil water 24 (29) 26 (26) 1357 (818) 60 (44) 4.4 (0.9) 0.75 (0.08) 1.49 (0.05) 2.2 (1.2) 1.2 (0.7) 0.3 (0.2) Hillslope
soil water 96 (103) - 1822 (1206) 169 (165) 6 (2) 0.69 (0.10) 1.52 (0.04) 2.6 (1.6) 1.6 (1.1) 0.5 (0.3) Pool bottom 28 (28) 39 (33) 1252 (362) 78 (56) 5 (2) 0.70 (0.08) 1.45 (0.04) 2.4 (0.5) 1.2 (0.3) 0.3 (0.1) Pool surface 4 (1) 21 (10) 785 (60) 34 (5) 4.5 (0.5) 0.78 (0.08) 1.41 (0.03) 1.7 (0.2) 0.75 (0.08) 0.19 (0.02)
a n = 53 for water track 8, 179 for hillslope, 12 for pool bottom, and 14 for pool surface samples b FZ indicates total dissolved iron detected via ferrozine assay
c n = 36 for water track 8, 12 for pool bottom, and 14 for pool surface samples
d ICP indicates total dissolved iron detected via inductively coupled plasma optical emission spectrometer analysis e n = 55 for water track 8, 144 for hillslope, 18 for pool bottom, and 21 for pool surface samples
fa
CDOM,320 indicates absorption coefficient of CDOM at 320 nm
g n = 55 for water track 8, 181 for hillslope, 18 for pool bottom, and 21 for pool surface samples h SUVA
254 indicates specific UV absorbance at 254 nm i S
R indicates slope ratio
j FI indicates fluorescence index
T
ABL
E
S
32
Table 2. Mean percent change and (standard error) of DOM chemistry of Imnavait Creek pool bottom waters after exposure to 12 h of sunlight relative to dark controls.
aCDOM,320 a SR b FI c Peak A Peak C Peak T
%Δ -9.5 (0.2) 17.9 (0.3) -12.9 (0.3) -11.2(0.6) -26.0(0.3) 5 (2)
aa
CDOM,320 indicates absorption coefficient of CDOM at 320 nm b S
R indicates slope ratio
33
FIGURES
34
35
Figure 1.3. The light attenuation coefficients (Kd,λ) were positively correlated with both
(A) CDOM absorption coefficients (aCDOM,λ) shown with a 1:1 line (thick solid line) and
(B) concentrations of total dissolved iron in pool waters on 27 June, 2011. Linear regressions between Kd,λ and both aCDOM,λ and total dissolved iron are shown (thin solid
lines). Kd,λ was less than aCDOM,λ in each pool except pool 2 (i.e., points fall above the 1:1
36
37
Figure 1.5. DOM quantity was greater and more variable in quality in the bottom waters (shaded bars) of stratified Imnavait Creek pools compared to the surface waters (open bars). The quantity of DOC was greater in the bottom waters of the stratified pools on 14 July, 2011 (A) and again on 4 August, 2011 (B), following re-stratification after a storm-induced mixing event. The absorption coefficient of DOM at 320 nm (aCDOM,320) was
CHAPTER TWO
Aqualog fluorometer for FDOM analysis: evaluation, optimization, and comparison to a conventional fluorometer
I evaluated the analysis of the fluorescent fraction of dissolved organic matter (FDOM) using an Aqualog spectrofluorometer, a new instrument optimized for FDOM analysis. Because the effects of a spectrofluorometer on FDOM spectra can be
significant, the ability to relate FDOM data collected on the new Aqualog to data collected on other instruments is unknown, thus constraining long-term monitoring studies incorporating FDOM analysis. To address this knowledge gap, I analyzed FDOM on the Aqualog across a range of dissolved organic carbon (DOC) concentrations from 100 to 0.1 mg C L-1. I tested the effect of excitation and emission wavelength
increments, the effect of sample dilution to evaluate the effective DOC range of the Aqualog, the range over which inner-filter effect (IFE) can be linearly corrected, and the effect of order of corrections on sample signal. I further compared the CDOM and FDOM results of forty samples analyzed using both the optimized Aqualog parameters and a separate UV-Vis coupled with a Fluoromax-4 spectrofluorometer, including two well characterized reference samples (Suwannee River fulvic acid (SRFA) and Pony Lake fulvic acid (PLFA)) and 38 filtered natural water samples ranging in DOC concentration from 2.0 to 12.9 mg C L-1. For optimal analysis of CDOM and FDOM using the Aqualog I recommend dilution of samples with decadic absorption coefficient at 254 nm (decCDOM,254) > 60 m-1 and correction for instrument-specific effects and IFE
39
analysis of FDOM on the Aqualog was determined to be approximately 2 to 15 mg C L-1 under the parameters investigated in this study. Outside this range, there was higher standard error of mean intensities, lower signal to noise, or significant IFE. The optics and performance of different instruments means that inter-instrument variability cannot be fully removed using instrument-specific correction factors, even using NIST standard reference materials. The application of an empirical inter-instrument correction factor improved the comparison of results between instruments. However, care must be taken in interpreting the results even after inter-instrument correction.
INTRODUCTION
UV-visible absorbance and excitation-emission matrix (EEM) fluorescence spectroscopy have been used extensively to characterize dissolved organic matter
(DOM), a complex and heterogeneous mixture of organic compounds produced from the breakdown of plants and microbial organic matter. Absorbance spectra of DOM
typically exhibit a smooth exponential decay with increasing wavelength of light (Stedmon and Markager, 2001). Fluorescence signals of DOM tend to be broad and featureless emission curves. As DOM contains many fluorophores (emitting moiety) the emission spectra are collected as a function of excitation energies. These EEMs show a surface of wavelength-specific emission intensities plotted over a range of excitation wavelengths. Excitation and emission peak maxima (wavelength and intensity) in an EEM depend on the source of DOM (McKnight et al., 2001), whether EEM collection followed established protocols, and the instrument used for analysis (Cory et al., 2010).
40
example, waters receiving large inputs of humic material from terrestrial sources would be expected to have high fluorescence intensity in the peak regions associated with terrestrial humic material whereas waters with microbial inputs would be expected to contain greater concentrations of microbially-produced fluorophores (Fig. 2.1).
The most important consideration for EEM analysis is correction for the self-shading or “inner-filter effect” (IFE, Miller et al., 2010). IFE is the self-self-shading of DOM, which results in (1) a non-constant intensity of excitation light throughout a solution as light is absorbed exponentially as it travels from the light source through a solution prior to exciting molecules and (2) re-absorption of the emitted light as it travels from the source through a solution to the detector. The established correction for the IFE is based on the absorbance of the sample at each excitation and emission wavelength pair (ex/em):
emission intensityex/em = measured emission intensityex/em
Aex Aem) (1)
where Aex and Aem are decadic absorbance by CDOM at the excitation and
emission wavelength, respectively, with units of cm-1 (McKnight et al., 2001).
Miller et al. (2010) determined that IFE can be corrected up to absorbance values of 0.3 to 0.8 in a 1-cm pathlength cuvette. At higher absorbance values, corrected emission intensity no longer increases linearly with absorbance suggesting that IFE can’t be removed from these optically thick waters.
41
the emission signal non-uniformly. Therefore, correction of instrument-specific biases is necessary to minimize their effect on the DOM fluorescence signal (Cory et al., 2010).
Procedures for correcting EEMs for instrument specific response have been applied in many studies (e.g., Coble et al., 1993; Cory et al., 2010; DeRose et al., 2007; Holbrook et al., 2006; Miller et al., 2010). Cory et al. (2010) compared the results of instrument-specific corrections from the same samples run on three different
spectrofluorometers. The correction factors improved comparability of spectra between instruments, but did not result in 100 % overlap in peak positions or emission intensities.
Thus, work to date suggests that instrument bias cannot be removed from sample signal by instrument-specific correction factors alone (Cory et al., 2010). This means that long-term data sets collected with multiple instruments must characterize and account for the effects of instrument bias. For example, SanClements et al. (2012) used analysis of FDOM to characterize and understand decadal trends in DOC concentrations. They found that the chemical signature of FDOM had changed along with DOC concentrations and used the FDOM results to support their hypothesis that changes in acid deposition had resulted in greater terrestrial inputs to surface waters due to higher solubility of soil organic matter (SanClements et al., 2012). However, the main FDOM measurement used was fluorescence index (FI) and while relative patterns of FI within a set of samples remain consistent regardless of the instrument used, the magnitude of specific samples can vary significantly between instruments (Cory et al., 2010) limiting the ability to compare datasets collected with multiple instruments.
42
longer term FDOM trends in a similar manner using data collected over time with multiple instruments will have to evaluate instrument specific response. These studies that rely on data collected with multiple instruments, which will occur as instrument technology continues to improve, will run into issues of instrument effects impeding the interpretation of their data. Thus, if we want to use FDOM to understand changes in any system over time due to climate or land use change, we need to understand the effect of the instrument on FDOM signals. This problem is confounded because instruments change and improve over time, and because instrument manufacturers rarely control for every variation in output or behavior of machines from one version to the next. Here I summarize the effects of instrument on FDOM signals, and demonstrate our approach to characterizing and correcting for the effect of instrument bias.
The Aqualog (Horiba; Edison, NJ) has recently been introduced as a
spectrofluorometer optimized to characterize FDOM in natural waters. It includes both an absorbance detector and fluorescence detector and matching bandpass for both spectra designed specifically to minimize the IFE from natural water samples. The Aqualog also has a double grating excitation monochromator to minimize the influence of stray light thereby minimizing the effects of unwanted wavelengths of light, scattering, and
emission measurement interference (Lakowicz, 2006). The goal of the new Aqualog was an instrument applicable to analysis of DOM in natural waters over a large range of DOC concentrations, from dilute seawater where the ratio of signal to noise is an issue to freshwater samples where correcting for the IFE is important.
43
C L-1. I tested the effect of excitation and emission wavelength increments, the effect of sample dilution to evaluate the effective DOC range of the Aqualog, the range over which IFE can be linearly corrected, and the effect of order of corrections on sample signal.
I compared the optimized Aqualog CDOM and FDOM results to CDOM and FDOM results collected on a “conventional” set up, in this case an Ocean Optics UV-Vis coupled with a Fluoromax-4 spectrofluorometer. I analyzed forty samples on each system, including two well characterized reference samples (SRFA and Pony Lake fulvic acid (PLFA)) and 38 filtered natural water samples ranging in DOC concentration from 2.0 to 12.9 mg C L-1. I compared uncorrected and corrected EEMs between each system on the dataset of 40 samples to evaluate how well instrument-specific corrections
minimized instrument bias. I also developed two average empirical correction factors between the two systems using the dataset of 40 samples and evaluated the ability of the empirical correction factors to minimize instrument-specific bias.
METHODS
Optimizing analysis of CDOM and FDOM using the Aqualog
Solution preparation