Cover Page
The handle
http://hdl.handle.net/1887/19932
holds various files of this Leiden University
dissertation.
Author:
Wardenaar, Klaas Johan
Title:
Syndromes versus symptoms : towards validation of a dimensional approach of
depression and anxiety
Syndromes versus Symptoms
Towards Validation of a Dimensional Approach
of Depression and Anxiety
cover design and illustrations: Klaas Wardenaar
Print: Ridderprint BV, Ridderkerk, the Netherlands.
The infrastructure for the NESDA study (www.nesda.nl) is gratefully acknowledged. The NESDA infrastructure is funded through the Geestkracht program of the Netherlands Organisation for Health Research and Development (Zon-Mw, grant number 10-000-1002) and is supported by participating universities and mental health care organizations (Vrije Universiteit University Medical Center, GGZ inGeest, Arkin, Leiden University Medical Center, GGZ Rivierduinen, University Medical Center Groningen, Lentis, GGZ Friesland, GGZ Drenthe, Scientific Institute for
Quality of Healthcare (IQ healthcare), Netherlands Institute for Health Services Research (NIVEL) and Netherlands Institute of Mental Health and Addiction (Trimbos Institute).
GGZ Rivierduinen is gratefully acknowledged for making the Routine Outcome Monitoring database available for analysis.
Syndromes versus Symptoms
Towards Validation of a Dimensional Approach
of Depression and Anxiety
Proefschrift
ter verkrijging van
de graad van Doctor aan de Universiteit Leiden, op gezag van Rector Magnificus prof. mr. P.F. van der Heijden,
volgens besluit van het College voor Promoties te verdedigen op donderdag 4 oktober 2012
klokke 16.15 uur
door
Klaas Johan Wardenaar geboren te Heerhugowaard
Promotiecommissie
Promotores: Prof. dr. F.G. Zitman Prof. dr. B.W.J.H. Penninx Copromotores: Dr. E.J. Giltay
Dr. T. van Veen Overige leden: Prof dr J. Gussekloo
Prof. dr. J. Ormel (Rijksuniversiteit Groningen) Dr. F.P.M.L. Peeters (Universiteit van Maastricht) Prof. dr. Ph. Spinhoven
Table of Contents
Chapter 1 Introduction 7
Chapter 2 Development and Validation of a 30-Item Short Adaptationof the Mood and Anxiety Symptoms Questionnaire (MASQ)
23
Chapter 3 The Structure and Dimensionality of the Inventory of Depressive Symptomatology Self Report (IDS-SR) in Patients with Depressive Disorders and Healthy Controls
39
Chapter 4 Dimensions of Depression and Anxiety and the Hypothalamo-Pituitary-Adrenal Axis
57
Chapter 5 Dimensions of Depression and Anxiety and the Metabolic Syndrome: Somatic Arousal is Associated with Somatic Symptoms of the Metabolic Syndrome
75
Chapter 6 Change on Different Symptom Dimensions of Depression and Anxiety in Response to Life Events
93
Chapter 7 Symptom Dimensions as Predictors of the Two-Year Course of Depressive and Anxiety Disorders
109
Chapter 8 Dimensions of the Inventory of Depressive Symptomatology as Predictors of the Course of Depressive and Anxiety Disorders
119
Chapter 9 Discussion 133
Reference list 145
Summary 169
Samenvatting 175
Curriculum Vitae 181
7
Chapter 1: Introduction
1.1 The epidemiology of depression and anxiety
Both depressive and anxiety disorders are very common. Major depressive disorder (MDD) alone has a lifetime prevalence of 19.0% in the general population (Bijl et al., 1998). Anxiety disorders are a more heterogeneous group and can be divided into different diagnoses: social phobia, generalised anxiety disorder (GAD), panic disorder, agoraphobia, specific phobia, obsessive compulsive disorder and post-traumatic stress disorder. The lifetime prevalence of these diagnoses is also high and ranges up to 19.3% in the general population (Bijl et al., 1998). The World Health Organization (WHO) reported that MDD is the leading cause of years lost to disability (WHO, 2004). Moreover, in the year 2000, MDD was ranked as the fourth largest contributor to the global burden of disease and it is projected to rank second by the year 2020 for all ages and both sexes, leaving only cardiovascular disease above it as the largest global cause of disability (Murray & Lopez, 1996; WHO, 2004).
Depressive disorders exert a long lasting influence on many aspects of a person’s life, including social, personal and productive functioning (Ormel et al., 2008). Role-disability has been found to be larger for psychiatric disorders than for many somatic disorders (Alonso et al., 2004). Therefore, MDD constitutes a considerable economic burden on society (Sobocki et al., 2006).
Both MDD and anxiety follow a chronic-intermittent course. MDD is characterised by an episodic course with interchanging periods of remission and recurrence of depressive episodes; some MDD patients only experience a few episodes throughout their lives, while others experience an episode every year or even chronic depression (Keller & Baker, 1992; Spijker et al., 2002; Ormel et al., 1993; Piccinelli & Wilkinson, 1994). Anxiety disorders tend to follow a more chronic course trajectory with less remission than single MDD (Ormel et al., 1993; Keller & Hanks, 1993; Pollack & Otto, 1997; Keller, 2006; Tiemens et al., 1996; Penninx et al., 2011). When depression and anxiety occur together, prognosis is especially unfavourable with less remission and more chronicity (e.g. Penninx et al., 2011).
1.2 The etiology of depression and anxiety
Much research has focussed on the underlying mechanisms that determine the onset and course of depression and anxiety, addressing biological, social and psychological etiological mechanisms. Over the past decades, research has become more focussed on biological mechanisms (Kendler, 2005).
8
2011). However, although much was expected from these GWA studies, replicability of many initial results has been limited (e.g. Bosker et al., 2010; Breen et al., 2011). Moreover, other GWA studies have found no associations at all (Muglia et al., 2008).
Other lines of research have focussed more upstream on the different biological pathways that could play a role in the pathophysiology of depression and anxiety. For instance, the hypothalamo-pituitary-adrenal (HPA) axis, which regulates the secretion of the stress hormone cortisol, has for long been hypothesized to play an important role in depression (Holsboer, 2000). Several studies have found dysregulated patterns of cortisol secretion in depressed patients (Pruessner et al., 2003; Bhagwagar et al, 2005; Vreeburg et al., 2009; Holsboer & Ising, 2010). However, these effects have been invariably small and other studies have found no differences between patients and controls or even the reversed effect (Stetler & Miller, 2005; Huber et al., 2006; Veen et al., 2011), leaving an inconsistent and inconclusive body of results. Moreover, it is still unclear whether these effects are the effect rather than the cause of depression and anxiety. Numerous lines of research have focussed on a variety of other possible underlying mechanisms, including: monoamines (review: Heninger et al., 1996), neuroplasticity (review: Duman & Monteggia, 2006) the autonomic nervous system (Licht et al., 2008; Kemp et al., 2010) and neuroimaging (review: Drevets et al., 2008). Many of these factors seem to play a role in the etiology of depression and/or anxiety, but the extent and consistency of their distinct and interactive roles have been hard to establish. Like biological research, studies that have focussed more on psychosocial factors, such as life events (Kessler, 1997), social support and coping styles (Coyne & Downey, 1991; Paykel, 1994) have yielded similarly varied results.
Another broad and relevant field of research is that of the interactions between psychiatric problems and indicators of somatic health. For instance, a large body of psychosomatic work has shown that depression is associated with a larger risk of cardiovascular disease (CVD) and vice versa (e.g. Musselman, 1998; Vogelzangs et al., 2010; Ormel & De Jonge, 2011). Increased prevalence of the metabolic syndrome (components) and autonomic nervous system dysregulations have been hypothesized to underlie both depression and CVD (Vogelzangs et al., 2009). This would explain the observed bi-directional link between these disorders in the population.
9 events are mediated by buffering factors, such as coping (Billings & Moos, 1981), social support (Cohen & Wills, 1985) and vulnerability factors, such as previous childhood trauma (Heim & Nemeroff, 2001). A more recent line of research has started to focus on the impact of daily hassles/stressors on day-to-day emotional variations and has shown that the magnitude of these variations is related to important clinical characteristics, including clinical course (Wichers et al., 2010) and treatment response (Geschwind et al., 2011).
In conclusion, there seem to be sufficient promising leads for further research into the etiology of depression and anxiety, but no general and consistent findings that could be regarded as undisputable textbook truisms.
1.2.1 Lack of scientific progress
Given the abovementioned inconclusive results, one would be tempted to think that we have been looking for the wrong causes of psychopathology. Should we try harder and expand our search for possible mechanisms? The answer is likely to be no. Given the large range of already investigated mechanisms with small and inconsistent effects, it is not very plausible that much will be gained by simply adding ever more new mechanisms to the list of possible candidate pathways, each of which is still poorly understood on an individual level. In fact, it seems that until now, every new and promising direction of research has only yielded small reward in terms of understanding the etiology of depression or anxiety.
A more plausible hypothesis is that depression and anxiety are caused by many interacting mechanisms, each with a very small effect on its own but with a larger combined effect (Caspi & Moffit, 2006; Jaffee & Price, 2007). From this perspective, it seems only reasonable that conflicting results are found when only a single mechanism is investigated. Indeed, results from studies of interactions between genes and environmental factors have indicated that important effects can be missed if genetic and environmental factors are each studied in isolation (e.g. Caspi et al., 2003). However, these interactive effects are much more complex to investigate and have so far been hard to replicate (Risch et al., 2009).
10
The DSM has without doubt helped the clinical field of psychiatry grow into a professional medical discipline with a globally accepted standardized diagnostic classification system and has improved the communication between health-care professionals worldwide (First, 2005). However, despite its obvious clinical utility, the DSM should primarily be judged on its validity when it comes to its use in scientific research (Kendell & Jablensky, 2002). In fact, it is doubtful whether DSM diagnoses could be considered valid and suitable for this use (e.g. Kendell, 1989; Kendell & Jablensky, 2002; Widiger & Clark, 2000; Widiger & Samuel, 2005). Taking this point even further, the widespread adaptation of DSM diagnoses as outcome variables in research could be argued to be one of the main reasons why scientific progress in psychiatry has been very slow during the last three decades (Shorter & Tyrer, 2003). Although this point is tentative and impossible to prove, the practice of pursuing the underlying mechanisms of a DSM-diagnosis does not seem very useful to gain more understanding of psychiatric problems, when we know that DSM-diagnoses were merely intended as clinical tools (Kendell & Jablensky, 2002).
With regard to depression and anxiety, several important issues of the DSM have been raised that are problematic for clinical and scientific purposes and could explain why so far scientific breakthroughs have been scarce and results inconsistent. These issues form the background to the research that is described in this dissertation and three of the most important issues will be discussed: comorbidity of depression and anxiety (see 1.3), heterogeneity of diagnoses (see 1.4) and discontinuity between health and disease (see 1.5)
1.3 Comorbidity of depression and anxiety
Depressive and anxiety disorders frequently co-occur. Comorbidity between the two diagnostic groups has been investigated in large-scale epidemiological studies and reported prevalence rates range from around 40 to 60%, depending on the population and diagnoses studied (Kaufman & Charney, 2000; Bijl et al., 1998). The rate of comorbidity seems to be even higher in clinical samples, probably because comorbid patients are more severely ill and more prone to seek help (Clark et al., 1995). The high rates of comorbidity of MDD and anxiety disorders have important clinical implications and have also given rise to a heated theoretical debate about the appropriateness of the division between anxiety and depression as separate entities (Mineka et al., 1998; Widiger & Clark, 2000; Clark et al., 1995). Below, both implications will be discussed.
1.3.1 Clinical implications of comorbidity
11 2000), response to treatment is lower (Brown et al., 1996; Kornstein & Schneider, 2001), and there is a higher probability of attempted and committed suicide (Beautrais et al., 1996; Roy-Byrne et al., 2000) than in single cases. Longitudinal studies have shown that the course of comorbid MDD and anxiety is chronic (56.8%) much more often than the course of single MDD (24.5%) or single anxiety disorders (41.9%; Penninx et al., 2011). Unfortunately, research on the etiology and pharmacological treatment of comorbid patients is scarce. Despite its high prevalence, comorbidity is often an exclusion criterion for research because it is regarded as an anomaly that blurs the depression- or anxiety-specific effects that researchers are usually looking for (Shorter & Tyner, 2003). Although comorbid patients have gained more attention in research in recent years, it seems that the group is still under-investigated.
1.3.2 Theoretical implications of comorbidity
The formal distinction between depression and anxiety was introduced in the first drafts that lead to the eventual DSM in the beginning of the 1980’s (Widiger & Clark, 2000). Depression and anxiety have since become widely accepted as separate clinical entities, which has lead clinicians and pharmacologists to organise separate lines of care for depression and anxiety. This has lead researchers to search for distinct etiological mechanisms underlying these different classes of disorders (Kendell & Jablensky, 2002). Indeed there seems to be some face-validity and clinical utility to the distinction between depression and anxiety. Semantically, the terms clearly have different meanings and some symptoms can easily be characterized as either depressive (e.g. ‘lack of interest’) or anxious (e.g. ‘feeling jumpy’). However, although some patients fit the diagnostic moulds nicely, real world epidemiological studies have shown that the majority of patients do not fit neatly into one well-defined diagnostic class, because boundaries between diagnoses are blurry (Kendell, 1989). From this perspective, the separation between depression and anxiety as separate disorders looks rather forced and artificial. In fact, one could argue that if a model is designed to optimally describe and organize the nosology of psychopathology, the boundaries should be drawn such that the resulting groups explain as much information as possible (Kendell, 1989). Thus, the system should be able to classify all patients in the simplest and most consistent way possible (Kendell, 1989; Kendell & Jablensky, 2002). Unfortunately, in the majority of cases, more than one diagnostic label is needed to diagnose the patient, which indicates that the underlying categorical model of the DSM is inefficient in describing reality, adding more complexity instead of one simple and reliable diagnostic solution for each individual (e.g. Clark, 1995; Widiger & Clark, 2000; Kendell & Jablensky, 2002; Widiger & Samuel, 2005).
12
that account more elegantly for the blurry boundaries between individual patients (Kendell & Jablensky, 2002)
1.4 Heterogeneity
An important issue that is inherent to the way the DSM works is within-diagnosis heterogeneity (Frances et al., 1990). DSM-diagnoses are made using a syndrome-approach, in which a fixed number of criteria has to be met in order to get a diagnosis. An inevitable side effect of this approach is that patients with a similar DSM diagnosis do not necessarily have similar symptoms; there is considerable within-diagnosis heterogeneity (Clark et al., 1995; Widiger & Samuel, 2005). For instance, if two patients both meet five out of nine criterion symptoms for MDD, they both meet the criteria but only have to share one symptom. Understandably, this leads to a lot of symptom variation across MDD patients, who might be assumed to be very similar judged by their common diagnosis. Within-diagnosis heterogeneity has several important practical and theoretical implications.
1.4.1 Clinical Implications of diagnostic heterogeneity
13 The problem of heterogeneity also applies to the widely used severity ratings of depression, which assume that all symptoms of depression contribute equally to the same broad underlying dimensions of severity. Such measures include the widely used Hamilton Depression Rating Scale (HDRS) and the Beck Depression Inventory (BDI). Indeed, many factor-analytical studies have shown that simply adding up symptom ratings to acquire a simple and broad severity score does not do justice to the heterogeneity of the assessed symptoms. Instead, factor analyses have repeatedly shown that sets of items that assess similar symptom domains cluster together on distinct factors, across which scores can vary independently (Shafer, 2006). So, where a one-construct structure is often assumed, a two-, three or more-one-construct structure often fits better to the actual data. This suggests that a more complex model is needed to measure the several coexisting spectra of severity that play a role in depression and anxiety (Goekoop et al., 2007). Indeed, for many depression severity measures, well validated subscales that measure these spectra have been developed to assess more specific symptom domains (e.g. for the HRSD: Bagby et al., 2004; for the BDI: Endler et al., 1999). In the current dissertation this pragmatic approach to decrease the heterogeneity of psychiatric assessment is also explored. Chapter 3 describes the development and validation of a dimensional model and corresponding subscales for the widely used Inventory of Depressive Symptomatology Self Report (IDS-SR).
1.4.2 Theoretical implications of heterogeneity
14
find out how the complex underlying mechanisms work, since there is a severe lack of statistical power. These issues revolve around each other and constitute a circular problem, which is not limited to genetic research: regardless of the etiological factor, diagnostic heterogeneity will be a problem when the expected effect or difference is small.
The lack of power in psychiatric research has certainly received attention, especially in genetic research, but the focus has been mainly on decreasing the relative influence of within-group noise by increasing sample size (e.g. Wray et al., 2009). Especially in the field of psychiatric genetics, experts have been stating that collecting enormous samples, in the order of tens- or hundreds-of-thousands of subjects is the only way to gain the power that will be needed to detect meaningful and replicable results from genetic studies and genome wide screens (discussed in: Abbott, 2008). In a similar vein, power could be increased by performing repeated measurements within the same group of people (Vickers et al., 2003). Although these methods of increasing measurement quantity should be considered as one viable option, the abovementioned issues should also encourage researchers to do something about the heterogeneity of their studied phenotypes, since this is one of the reasons why enormous power – and thus vast samples and multiple measurements - are needed in the first place.
In conclusion, diagnostic heterogeneity leads to a lack of clinical specificity and loss of power in scientific research. Therefore, researchers should find better ways to account for this.
1.5 Discontinuity
15 1.5.1 Clinical implications of discontinuity
The actual continuity of psychopathology in the population is not incorporated in our current diagnostic system. However, there exists a considerable group of individuals that could be characterized as patients with subclinical illness: they do not (yet) meet the full criteria for a diagnosis. It has been found that even in these subclinical cases, increases in severity are associated with increased disability (e.g. Martin et al., 1996; Lewinsohn et al., 2000; Cuijpers et al., 2004). Thus, these individuals could very well be in need of care or preventive measures. Indeed, it has been shown that preventive psychosocial treatment decreases the incidence of MDD, disease severity, the level of disability (Clarke et al., 1995; 2001; Willemse et al., 2004), and the subsequent use of care in individuals with subclinical depression (Wells et al., 2005). However, no evidence has been found for the efficacy of antidepressants in sub-threshold depressive individuals (Barbui et al., 2011). Indeed, in a meta-analysis these were shown to be mainly effective in patients with severe MDD (Kirsch et al., 2008). Thus, using a strict dichotomous model to divide care among individuals seems to lead to a situation in which a proportion of those needing care are ignored. This is unfortunate, because if treatment is only started after a DSM diagnosis is made, the developmental end-stage of the disorder is already reached and the disabling effects are much harder to stop and reverse than when interventions are made in an earlier developmental stage (McGorry et al., 2006; McGorry; 2007).
1.5.2 Theoretical implications of discontinuity
As discussed above, most researchers divide their subjects into DSM-defined healthy and diseased groups. However, the continuous distribution of disease severity in the population causes both groups in these so called case-control studies to include subjects with varying levels of psychopathology, decreasing the contrast between the mean psychopathology levels of the two groups and thus decreasing the potential to detect a difference on an etiological variable. In fact, the methodology literature advises clearly against dichotomising variables that are actually continuously distributed, because it leads to a decrease in statistical power that is equal to the decrease that would be seen after reducing sample size by a third (Altman & Royston, 2006). In other words, if we choose to dichotomise depression rather than to approach it as a continuous variable, we need to collect 50% more data to reach the same amount of statistical power. Dichotomising can be seen as effectively throwing away valuable information about possible effects and it has been shown to lead to biased results (Royston et al., 2006). Therefore, phenomena with a continuous distribution throughout the population should ideally be analysed with continuous variables (MacCallum et al, 2002; Royston et al., 2006).
1.5.3 Patching up the DSM
16
the issues could be solved with relatively minor adjustments or additions to the existing system as has been the practice for all previous editions of the DSM. Comorbidity could be tackled by introducing an ad hoc “mixed depression-anxiety” diagnosis in the DSM (Katon & Roy-Byrne, 1991; Zinbarg et al., 1994; Shorter & Tyrer, 2003). This would mould comorbidity into one official diagnosis, albeit without any direct consequence for treatment other than the already known consequences of comorbidity itself. Diagnostic heterogeneity could be reduced by assigning individuals to increasingly numerous and specific diagnostic subcategories (e.g. Carragher et al., 2009). However, for reasons listed above, subtypes within diagnoses have so far proven to be limited in their validity and usefulness (Clark et al., 1995; Stewart et al., 2007). Discontinuity could partly be accounted for by including a threshold for subclinical depression (e.g. Hybels et al., 2001) and/or anxiety to better enable staged diagnostics (Fava & Kellner, 1993; McGorry et al., 2006). However, introduction of such a diagnosis would automatically create new subclinical diagnoses with limited specificity: many subtreshold cases do not need treatment or will not respond to it (Lyness et al., 2007). In addition, it is unclear where cut-offs should be defined between different preclinical stages. If natural points of rarity do not exist between different clinical entities (Kendell & Jablensky, 2002), it remains to be seen if they exist between different clinical stages.
1.6 Solution of issues: a dimensional approach
The problems with each of the abovementioned proposals are that they tackle specific issues in an ad hoc fashion and act as specific add-ons that bear no relation to the functioning of the system as a whole. Moreover, rather than to suggest that some small adjustments are needed to the system, the issues with the DSM go deeper and imply that something much more elemental is wrong with its categorical approach. Therefore, it would be overly optimistic to expect that the problems can simply be patched up until a next revision is due.
Completely different approaches to psychopathology have been proposed that aim to better describe the actual characteristics of psychiatric symptoms in a more integrated fashion. Of the proposed approaches, the dimensional approach has been shown to be one of the most promising contenders. This approach is the main focus of this dissertation.
1.6.1 A dimensional approach to psychopathology
17 depression and anxiety, dimensional models circumvent and explain comorbidity, by assuming common and specific symptom dimensions instead of a fixed set of categories (Clark & Watson, 1991). For depressive and anxiety disorders, promising dimensional models have been developed that have been shown to be very useful in describing the clinical state of any individual, irrespective of his or her DSM diagnosis.
1.6.2 A dimensional approach to depression and anxiety
The starting point for the development of a dimensional approach of depression and anxiety was the observed high rate of comorbidity between the two disorders, as this highlighted an elemental flaw in the descriptive model of the DSM (Mineka et al., 1998). As described above, comorbid patients often have a less favourable prognosis and respond poorly to treatment. The obvious reason for this is that comorbidity occurs more often in patients that have more (severe) symptoms. Therefore, authors argued that it is these patients’ relatively high position on an underlying severity dimension that accounts for their worse prognosis and not merely the fact that they have two or more diagnoses (Clark et al., 1995). This assumption was central to the emergence of a series of dimensional models of depression and anxiety during the past two decades.
The first question that the developers of these dimensional models sought to answer was how the general underlying severity dimension could be defined. Researchers that aimed to explain the relationship between depression and anxiety observed that patients with depression and anxiety show considerable overlap in their experienced symptoms irrespective of severity or demographics. These shared symptoms were mainly characterised by general psychological distress, and together they were labelled as ‘Negative Affect’ (Watson & Clark, 1984; Watson et al, 1988). In this form, increased Negative Affect was found to be associated with the occurrence and persistence of both depression and anxiety and worse prognosis (Watson et al., 1988; Clark et al., 1994). This led researchers to assume that Negative Affect is indeed a central or common symptom domain that explains the overlap between DSM-defined depression and anxiety and their comorbidity (Watson et al., 1988; Clark et al, 1995).
1.6.3 The tripartite model
18
together with decreased Positive Affect, were found to specifically characterize those individual with mood-related problems, such as anhedonia (Watson & Clark, 1984; Watson et al., 1988). Importantly, the dimensional nature of both Negative and Positive Affect allows a large range of combinations of both common and specific symptom severity to be described, and models the heterogeneity across different individuals. The third dimension of ‘Somatic Arousal’ included symptoms of somatic hyper arousal, such as sweating, trembling, palpitations and other sympathetic symptoms. This specific dimension was added to the model to account for panic and anxiety symptoms (Mineka et al., 1998; Joiner et al., 1996).
The tripartite model was initially meant to explain comorbidity between depression and anxiety, and at the same time to acknowledge the specific features on which individuals can differ from each other. Although the tripartite approach is simple and far from complete in explaining all aspects of depressive and anxious symptomatology, this seems to have advantages. The model is easy to operationalize with a simple measurement scale, called the mood and anxiety symptoms questionnaire (MASQ, Watson et al., 1995a; 1995b). Using data collected with the MASQ and other instruments, the hypothesized dimensional structure was proven to be generalizable across many populations. The 3-dimensional structure has been replicated in school children (Chorpita et al., 2000; 2002; Cannon & Weems, 2006), healthy college students (Watson et al., 1995a; Keogh & Reidy, 2000), veterans (Watson et al., 1995a), adult psychiatric outpatients (de Beurs et al., 2007), adolescent psychiatric patients (Joiner et al., 2000), the elderly (Cook et al, 2004), and patients with somatic problems (e.g. Geisser et al., 2006).
19 symptoms are present. Therefore, it has been proposed that Negative Affect should be subdivided into more homogenous subdimensions (Mineka et al., 1998; Den Hollander-Gijsman et al., 2010).
Interestingly, parallel to the tripartite model, other models have also been proposed in the literature from a more neurobiological perspective (Shankman & Klein, 2003). The best known of these are the approach-withdrawal model and the valence-arousal model (Murphy & Lawrence, 2003), which make predictions about patterns of activation of different emotional response systems for negative (withdrawal related) and positive (approach related) emotions in the brain (Murphy & Lawrence, 2003). These emotional systems roughly correspond to Negative Affect, Positive Affect and Somatic Arousal. The valence-arousal model adds an extra anxiety-specific domain, called Anxious Apprehension (Shankman & Klein, 2003). These models make similar assumptions about the way affect is structured in depression and anxiety, but operationalize the framework in terms of brain-activation patterns in reaction to stimuli instead of questionnaire scores.
1.6.4 The hierarchical model
The realisation that Negative Affect is a very broad severity-defining construct with many underlying specific dimensions that account for the variation across patients has led researchers to take the tripartite model a step further. Several authors (Zinbarg & Barlow, 1996; Brown et al. 1998; Mineka et al. 1998; Krueger & Finger, 2001; Kotov, 2011) proposed that rather than to coexist, the dimensions of the tripartite model should be seen in a hierarchical structure: Negative Affect was defined as a general distress factor with several underlying specific dimensions, including positive affect and somatic arousal, but also other dimensions that capture the specific features of different anxiety disorders. This hierarchical model has been proven very successful in explaining how different DSM diagnoses are interrelated in the general population (Watson et al., 2005). Depression and GAD on one hand and anxiety disorders on the other hand can be grouped in separate factors under the umbrella of one broad negative affect factor (Krueger, 1999; Vollebergh et al., 2001; Watson, 2005). The disorders that can be grouped under negative affect are often referred to as ‘internalising’ disorders, as opposed to ‘externalising’ disorders, such as substance abuse and antisocial behaviour, which fall under their own factor (Krueger, 1999). All internalising disorders are thought to have a largely shared aetiology, which explains why they co-occur so often (Watson et al., 2005). The same rationale applies to the externalising disorders.
20
collected with this instrument had a hierarchical structure, operationalized in a bifactor factor model with one general latent factor, explaining variation in all assessed symptoms, and several specific latent factors explaining variation in subsets of symptoms (Simms et al., 2008). Importantly, the hierarchical, bifactor model was also found to fit well on data collected with other instruments (Simms et al., 2011; Den Hollander-Gijsman et al., 2011).
1.6.5 The hierarchical model versus the tripartite model
What distinguishes the hierarchical model from the tripartite model is that the former defines negative affect as a latent factor that loads on all lower level dimensions. Negative Affect is thus solely represented in the high covariances between the lower level dimensions. Measures that aim to assess these lower level dimensions consequently do not include a common Negative Affect scale (e.g. the IDAS). In contrast, the tripartite model defines negative affect as a part of a symptom profile that can be measured alongside other, more specific dimensions. The hierarchical model has the advantage that it works elegantly to explain the structure of psychopathology. The tripartite model has the advantage that all of its dimensions, including Negative Affect, can be easily measured and used as variables in etiological research. Thus, although the hierarchical model may be superior in describing how disorders co-occur within the DSM in the way they do, the tripartite model is a more descriptive model that can be used to describe an individual’s clinical state with a dimensional profile, irrespective of DSM-diagnosis. Both approaches have potential clinical and scientific use.
1.7 Towards the use of dimensions in the DSM
Dimensional approaches have gained a lot of attention as potential alternatives or additions to the DSM. Several dimensional models – especially for depression and anxiety - have proven to be structurally valid and effective in describing patients’ clinical states.
Some work groups have investigated whether it is possible to implement a paradigm shift and add dimensions to the existing system or to completely replace some categories with dimensions in the DSM-V (Helzer et al., 2008). The latter has, for instance, been proposed for Axis-II personality disorders and there is a fair chance that Axis II will become largely dimensional in the DSM-V, mainly because widely accepted dimensional operationalisations of personality have been around for decades (e.g. the MMPI; the Big Five) and have already become a trusted part of the working clinicians’ vocabulary. However, especially for those, who work in a strictly medical environment, the transition from Axis-II disorders to dimensions will be less natural and it will probably take time before the new approach will be completely trusted and accepted within the field.
21 1.7.1 Coverage and integration
The most general objection to introducing dimensions into the DSM-V is that there is currently no dimensional model that is ready to be implemented as the clinical standard. Most published dimensional models cover a limited range of disorders (e.g. depression or autism or psychosis), each offering strong proof of concept but not a readily usable clinical approach. Although recent attempts to integrate a broader range of symptoms in a single model have been quite successful (e.g. Watson, 2005), no well-validated model covers all clinically relevant symptoms that would be needed for daily diagnostic practice.
1.7.2 Acceptability of dimensions
The current psychiatric system has been designed around the DSM. Clinicians, scientists, insurance companies and drug administration bodies such as the Federal Drug Administration have all become used to thinking in terms of categorical diagnoses. Describing patients with DSM-diagnoses has become second nature within the field, making any alternative approach seem unintuitive.
Even if an all-encompassing, completely valid and intuitively acceptable dimensional approach existed, introduction into the DSM would have many undesirable side effects. For instance, additional dimensional ratings could increase the workload for already busy clinicians (Frances, 2009). More generally, a shift to a dimensional paradigm would have severe consequences for the continuity within the field: mental health care administration systems would all need to be reformed and previous DSM-based scientific findings would become hard to interpret (First, 2005). Although realistic and relevant, these objections would be rendered obsolete if a dimensional approach was proven to have significant clinical and scientific benefits. However, as long as dimensional models remain in the realm of theory and have not been operationalized for actual practical applications, these objections stand firmly. As Frances (2009) aptly stated: “…introducing a botched dimensional system prematurely into DSM–V mayhave the negative effect of poisoning the well for their futureacceptance by clinicians … “.
1.8 The validity of dimensions
22
The external validity of current dimensional models is far from established and has received far less attention than their internal validity. With regard to the tripartite model, some etiological studies have been conducted showing that Negative Affect and Positive Affect are associated with biological factors, such as the HPA-axis (e.g. Veen et al., 2011). Also, studies of the course and outcome of psychopathology have shown that NA and PA predict the outcome of depression and anxiety in certain settings (e.g. Joiner & Lonigan, 2000; Lonigan et al., 2003; Clark et al., 2003). However, these studies have been limited in relative size and scope, when compared to studies of internal validity, summarized in paragraph 1.6.3.
Meaningful associations between dimensions and etiological factors, such as genetic, biological and environmental factors could be established where DSM diagnoses show inconsistent or very small associations. If dimensions really add something on top of DSM diagnoses in terms of explanatory power and are shown to have their own underlying mechanisms, this would be strong evidence that dimensions are not just psychometric constructs, but naturally occurring phenomena (Kendell & Jablensky, 2002). The value of dimensions can only be established if they are shown to represent endpoints of different etiological mechanisms. Ideally, factor analytical and etiological research should thus be combined for the validation of dimensional psychopathology.
1.9 The current project
The aim of this dissertation was (1) to further improve measurement of dimensions of depression and anxiety by improving the validity of the measurement scales and (2) to investigate the added value of the measured dimensions in etiological and clinical psychiatric research.
The first step was to find optimal ways to measure dimensions across different settings. In Chapter 2, the development and validation of an instrument that can be used to efficiently measure the three dimensions of the tripartite model is described. In Chapter 3, a pragmatic approach is described to optimally measure specific symptom dimensions, extracted from an already widely used self-report questionnaire.
The second step of the project was dedicated to the investigation of associations between dimensions and a range of potential etiological factors and to establish whether the dimensions did show more specific associations. In Chapter 4, a study of the association between dimensions and the HPA-axis is described. In Chapter 5, a study of the associations between dimensions and different metabolic factors is described. Chapters 6 describes studies of the dynamic associations between dimensions and different types of life events.
Chapter 2:
Chapter 1: Introduction
Abstract
The original Mood and Anxiety Symptoms Questionnaire (MASQ) is a 90 item self report, designed to measure the dimensions of Clark and Watson’s tripartite model. We developed and validated a 30-item short adaptation of the MASQ: the MASQ-D30, which is more suitable for large scale psychopathology research and has a clearer factor structure. The MASQ-D30 was developed through a process of item reduction and grouping of the appropriate subscales in a sample of 489 psychiatric outpatients, using a validated Dutch translation, based on the original English MASQ, as a starting point. Validation was done in 2 other large samples of respectively 1461 and 2471 subjects with an anxiety, somatoform and/or depression diagnosis or no psychiatric diagnosis. Psychometric properties were investigated and compared between the MASQ-D30 and the full (adapted) MASQ. A 3-dimensional model (negative affect, positive affect and somatic arousal) was found to represent the data well, indicating good construct validity. The scales of the MASQ-D30 showed good internal consistency (all alphas > 0.87) in patient-samples. Correlations of the subscales with other instruments indicated acceptable convergent validity. Psychometric properties were similar for the MASQ-D30 and the full questionnaire. In conclusion, the MASQ-D30 is a valid instrument to assess dimensional aspects of depression and anxiety and can easily be implemented in psychopathology studies.
Previously published as:
25 2.1 Introduction
26
can be used in large scale prospective cohort studies and trials, taking the Dutch translation of the MASQ that is based on the original English MASQ, as starting point. Use of short and self-report questionnaires is the most effective method to decrease respondent burden, increase response rates and to reduce possible bias due to selective loss (Dillman et al., 1993). Therefore, we developed a 30 item short adaptation of the MASQ (MASQ-D30) to use in large scale research into shared and distinctive features of anxiety and depression. We aimed for the psychometric qualities to be as close as possible to the full questionnaire. To evaluate this, a number of analyses were conducted. First, we assessed indices of internal consistency and evaluated the inter-correlations of the AD, AA and GD scales. Second, we investigated convergent validity by comparison of the 3 scale scores with other psychometric instruments. Third, we compared these psychometric results between the MASQ-D30 and the full questionnaire. Fourth, we investigated the dimensional structure of the MASQ-D30 with confirmatory factor analysis. The initial development of the short-form was done by use of data from a large sample of psychiatric outpatients (n = 489): the Routine Outcome Monitoring (ROM). We carried out subsequent analyses with more data from ROM (n = 1461) and with data from a large sample of psychiatric patients: the Netherlands Study of Depression and Anxiety (NESDA,_n=2471).
2. 2 Methods
Participants and procedures
Routine outcome monitoring participants
27
NESDA participants
Sample 3 was composed of participants in the NESDA study (Penninx et al., 2008). NESDA is a large scale longitudinal research project, in which 2981 participants with an anxiety disorder, depressive disorder and no psychiatric diagnosis are included from different locations in the Netherlands and in different settings (community, primary care and mental health care organizations). The baseline assessment consisted of a blood draw, a cognitive task, a medical exam, a psychiatric interview and administration of several self report questionnaires. Of all participants, 82.9% completed all questionnaires that were used for the present analyses (n=2471). In sample 3 there were 1652 women (66.9 %) and 819 men (33.1%) and the mean age was 42.1 years (SD=13.1, range 18-65).
For subgroup analyses, three subsamples were drawn from sample 3, based on mental health care setting. A primary care group (n=909) was composed of patients who received care in general practices (for general, somatic and/or mental complaints), a mental health care group (n=621) was composed of patients who were referred to mental health care organizations and a healthy control group (n=577) was composed of subjects without any lifetime psychiatric diagnosis. The protocol of the NESDA study was approved centrally by the Ethical Review Board of the Leiden University Medical Centre and by local review boards of participating centres. All subjects signed informed consent before assessment.
Instruments
Dutch translation based on the MASQ
All participants in sample 1 and sample 2 filled out the Dutch translation that was based on the original MASQ. The translation process and psychometric evaluation of this adapted MASQ were described by De Beurs et al. (2007). Like in the original English version of the MASQ, on this adapted MASQ individuals are asked to rate how much in the past week they have experienced “feelings, sensations, problems and experiences that people sometimes have” on a 5-point Likert scale, with 1 being “not at all” and 5 being “extremely”. Sum scores were computed, using the items described by De Beurs et al. (2007) with a GD scale of 20 items, an AD scale of 22 items and an AA scale of 18 items.
Short adaptation of the MASQ (MASQ-D30)
28
factor loadings >0.50) with sufficient ability to differentiate (difference of at least 0.20 between loadings on different factors) were selected from each of the three extracted factors to construct short scales. Next, the content of the selected items was evaluated by clinical experts and several redundant and overlapping items were replaced by items with a lower factor loading (none <0.50) that contributed to better content coverage.
Other instruments in sample 1 and 2 (ROM)
The Mini International Neuropsychiatric Interview (MINI) (Sheehan et al., 1998; Van Vliet and De Beurs, 2007: Dutch version), a standardized diagnostic interview with 23 modules that assess the presence of DSM criteria for the main Axis I psychiatric disorders (mood, anxiety, psychotic, somatoform and eating disorders) was used to assess diagnostic status. The Brief Symptom Inventory (BSI) (Derogatis, 1975: De Beurs and Zitman, 2006: Dutch version), a list of 53 symptoms, was administered to all patients. A 5-point Likert scale (0 =“not at all”, 4=“extremely”) was used to assess to what extent respondents experienced each of these symptoms in the past week. The BSI, with subscales for somatic complaints, depression, anxiety, phobic avoidance and interpersonal sensitivity was completed by all respondents. The total BSI score was used as an index of general psychopathology. The Beck Depression Inventory II (BDI) (Beck and Steer, 1987; Beck et al., 2002: Dutch version) was completed by patients with a current major depression or dysthymia diagnosis. The psychopathology of the patients was also rated by the research nurse, using two subscales from a shortened version of the Comprehensive Psychiatric Rating Scale (CPRS), a scale of 25 items (Goekoop et al., 1991: Dutch version). The used subscales were the Brief Anxiety Scale (BAS, 10 items) and the Montgomery-Åsberg Depression Rating scale (MADRS, 10 items). Different response options for each of the items of the CPRS were rated on a 7 point scale anchored at 4 points (1, 3, 5 and 7).
Other instruments in sample 3 (NESDA)
29
Statistical Analyses
Analyses were conducted using the SPSS 14.0 and EQS 6.1 (Multivariate Software Inc., Encino, California, USA) software packages. First, the internal consistency coefficients (Cronbach’s alpha) of the scales were computed. Second, the bivariate correlations between the MASQ-D30 subscales were computed to assess whether the subscales measure distinct constructs. Third, bivariate correlations between the MASQ-D30 subscales with other instruments were calculated to investigate convergent validity. Fourth, internal consistency and validity were compared between the MASQ-D30 and the full MASQ. Fifth, the analyses were repeated in sample 3 and the subsamples to obtain independent replications. Sixth, confirmatory factor analysis (CFA) was used in sample 3 and the subsamples to evaluate the fit of a 3-dimensional model to the data, based on a maximum likelihood estimation method. To assess the fit of the model to the data with CFA, several approaches can be used. Model fit can be assessed with a χ2 statistic or a robust Satorra-Bentler (S-B) χ2 statistic, which is less impacted by deviations from normality. In this test, a non significant result indicates good fit. However, in large samples the χ2 statistic is oversensitive to minor derivations from perfect model fit, which makes it practically not useful for this study. Thus, the fit of the model was assessed with fit-indices that are less affected by sample size (Byrne, 2006). The used fit indices were: the comparative fit index (CFI), the normed fit index (NFI), the non-normed fit index (NNFI) and the root mean square error of approximation (RMSEA). A CFI, NFI and NNFI of at least 0.90 indicate satisfactory fit and a RMSEA, lower than 0.06 indicates that the model is a good descriptor of the data (Byrne, 2006).
Missing Data
In samples 1 and 2, no data were missing. In sample 3, 2624 (90.8%) of 2891 subjects completed the MASQ-D30; 357 subjects (9.2%) did not return the MASQ-D30 questionnaire they received to complete at home. This group of non-responders had a higher percentage of males, a lower mean age and fewer years of education than the group of responders, which could have made our sample slightly less representative.
Of the 2624 subjects that completed the MASQ-D30, 153 (5.8%) subjects had one or more missing responses. All items were categorical with a strongly skewed distribution. Therefore, we decided not to impute the missing values, because each method could introduce new sources of bias into our data. Thus, subjects with missing values were excluded from the analyses. This resulted in a sample size of 2471 subjects. We checked whether the psychometric results of the MASQ-D30 differed between this sample and the original sample of 2624 subjects and found that the psychometric results were largely similar. This makes it unlikely that exclusion of incomplete cases has biased our results.
2.3 Results
30
Diagnoses and demographic variables
The demographic information and the lifetime diagnoses of depressive, anxiety, somatoform and comorbid diagnoses for each of the three studied samples are shown in Table 2.2. From the table it can be seen that there is a considerable amount of comorbidity between anxiety and depression in each of the samples. However, the percentages of subjects with anxiety, depressive or both disorders differ significantly between the samples. Somatoform disorders were only diagnosed in samples 1 and 2; the percentages of these disorders (single and together with anxiety and/or depression) did not differ significantly between the samples.
The observed differences between the developmental and validation samples make it possible to evaluate the consistency of the characteristics of the MASQ-D30 across different patient groups.
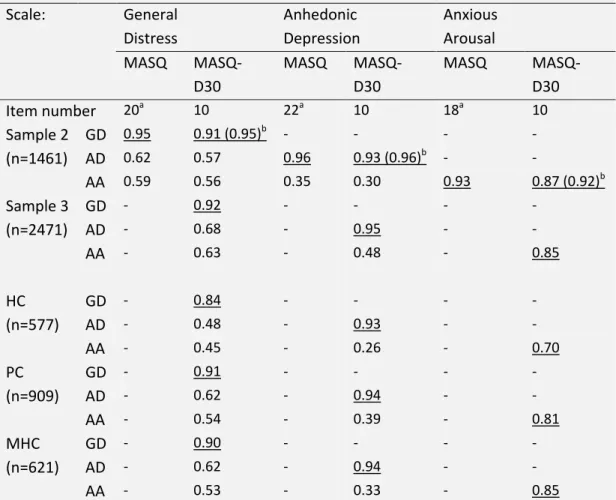
Internal Consistency
Internal consistency coefficients (Cronbach’s alpha) for each of the three scales are presented in Table 2.3. These ranged from 0.93 to 0.96 for the full MASQ and from 0.87 to 0.93 for the MASQ-D30. We used the Spearman-Brown formula (Nunnally and Bernstein, 1994, pp. 262-264) to assess whether the lower alphas of the MASQ-D30 scales could be attributed to the reduced number of items. Using this formula we computed the estimated alpha coefficients of the MASQ-D30 scales when expanded back to original length. These estimated alpha coefficients ranged from 0.91 to 0.96, indicating that the internal consistency was preserved with item reduction.
In sample 3, we found a similar pattern of Cronbach’s alpha coefficients (0.85 to 0.95) for the MASQ-D30. In the subgroups, the alpha coefficients ranged from 0.81 to 0.94 in the primary care group and from 0.85 to 0.94 in the mental health care group. In the healthy control group, the alphas of the GD and AD scale were 0.84 and 0.93 respectively. However, for the AA scale, alpha was considerably lower (0.70), which indicated only moderate internal consistency. These results indicate that the MASQ-D30 scale reliability, estimated by internal consistency, is good and stable over different patient subsamples and only less for the AA scale in non-patients.
Subscale inter-correlations
31 fairly distinct symptom domains, while GD is related to both AD and AA. This is in line with the tripartite model.
Table 2.1: Factor loadings on the dimensions of the tripartite model for the MASQ-D30 in 489 subjects
Items General
Distress
Anhedonic Depression
Anxious Arousal
1 Felt confused 0.59 0.12 0.35
4 Felt worthless 0.76 0.29 0.05
7 Felt irritable 0.54 0.19 0.34
10 Felt hopeless 0.76 0.28 0.23
12 Blamed myself for a lot of things 0.70 0.10 0.10 13 Felt dissatisfied with everything 0.67 0.35 0.20 17 Felt pessimistic about the future 0.65 0.23 0.10
23 Felt inferior to others 0.70 0.17 0.08
25 Had trouble making decisions 0.62 0.19 0.19
28 Worried a lot about things 0.62 0.19 0.24
3 Felt successful 0.18 0.67 0.13
6 Felt really happy 0.35 0.62 0.13
9 Felt optimistic 0.27 0.71 0.02
11 Felt like I was having a lot of fun 0.23 0.75 0.14 14 Felt like I accomplished a lot 0.17 0.73 0.06 16 Felt like I had a lot to look forward to 0.15 0.71 0.04
19 Felt really talkative 0.16 0.58 0.02
22 Felt really ‘up’ or lively 0.27 0.73 0.13
26 Felt like I had a lot of energy 0.21 0.69 0.07 29 Felt really good about myself 0.39 0.68 0.09
2 Startled easily 0.35 -0.06 0.57
5 Felt nauseous 0.17 0.09 0.58
8 Felt dizzy or light-headed 0.14 0.14 0.66
15 Was trembling or shaking 0.18 0.10 0.72
18 Had pain in my chest 0.01 0.04 0.61
20 Had hot or cold spells 0.18 0.14 0.65
21 Was short of breath 0.12 0.04 0.57
24 Muscles were tense or sore 0.05 0.12 0.65 27 Heart was racing or pounding 0.20 0.08 0.61
30 Had trouble swallowing 0.14 -0.04 0.61
32
Table 2.2: Demographic and diagnostic information for samples 1, 2 and 3
Sample 1 Sample 2 Sample 3 P value1
Source study ROM ROM NESDA
N 489 1461 2471
Male 192 (39.3%) 520 (35.6%) 819 (33.1%) 0.03
Female 297 (60.7%) 941 (64.4%) 1652 (66.9%)
Age mean (SD) 37.5 (11.7) 38.7 (13.1) 42.1 (13.1) <0.001
Age range 18-65 18-65 18-65
Lifetime psychiatric diagnoses:
Diagnostic instrument MINI MINI CIDI
Only depressive disorder 76 (15%) 302 (21%) 478 (19%) 0.05 Only anxiety disorder 103 (21%) 371 (25%) 294 (12%) <0.001
Only somatoform disorder 28 (6%) 70 (5%) - 0.48
Comorbidity: depression and anxiety
105 (22%) 294 (20%) 1122 (46%) <0.001
Comorbidity: depression and/or anxiety and Somatoform disorder
42 (8%) 128 (9%) - 0.91
No lifetime diagnosis 135 (28%) 296 (20%) 577 (23%) 0.002
1
)Tests of significance using ANOVAs or χ2-tests. ROM = Routine Outcome Monitoring; NESDA = Netherlands Study of Depression and Anxiety; MINI = Mini International Neuropsychiatric Interview; CIDI = Composite International Diagnostic Interview.
Convergent validity
33 mostly specific to anxiety and somatisation and less to depressed state. Remarkably, the correlation of the IDS with AD (r=0.67) was similar to that with AA (r=0.66), while the IDS is intended as a measure of depression. This could be caused by the fact that the IDS is heterogeneous and also measures somatic and anxious symptoms along with symptoms of depression. Table 2.4 reveals that the correlations are largely similar for the MASQ-D30 and MASQ scales. This indicates that the convergent validity of the MASQ is preserved in the MASQ-D30. The correlations of the MASQ-D30 scales with the BAI, IDS and the 4DSQ- distress scale were similar in the 3 healthcare subgroups of sample 3. Thus, convergent validity was consistent across different health care settings.
Table 2.3: Reliability and inter correlations of the MASQ-D30 scales and the full MASQ scales
Scale: General Distress
Anhedonic Depression
Anxious Arousal MASQ
MASQ-D30
MASQ MASQ-D30
MASQ
MASQ-D30
Item number 20a 10 22a 10 18a 10
Sample 2 GD 0.95 0.91 (0.95)b - - - -
(n=1461) AD 0.62 0.57 0.96 0.93 (0.96)b - -
AA 0.59 0.56 0.35 0.30 0.93 0.87 (0.92)b
Sample 3 GD - 0.92 - - - -
(n=2471) AD - 0.68 - 0.95 - -
AA - 0.63 - 0.48 - 0.85
HC GD - 0.84 - - - -
(n=577) AD - 0.48 - 0.93 - -
AA - 0.45 - 0.26 - 0.70
PC GD - 0.91 - - - -
(n=909) AD - 0.62 - 0.94 - -
AA - 0.54 - 0.39 - 0.81
MHC GD - 0.90 - - - -
(n=621) AD - 0.62 - 0.94 - -
AA - 0.53 - 0.33 - 0.85
Cronbach’s alpha coefficients are underlined; MASQ = Dutch Adaptation of the Mood and Anxiety Symptoms Questionnaire; MASQ-D30 = Short Form of the Dutch adaptation of the MASQ; GD =General Distress; AD = Anhedonic Depression; AA = Anxious Arousal; HC = healthy control group; PC = primary care group; MHC = mental health care group (all correlations p < 0.01).
a
Computation of GD, AD and AA scales following de Beurs et al. (2007).
b
34
Construct validity
We conducted CFA to assess the fit of a 3 factor model to the MASQ-D30 data of several samples, with items 1, 4, 7, 10, 12, 13, 17, 23, 25 and 28 loading on a GD factor, items 3, 6, 9, 11, 14, 16, 19, 22, 26, and 29 loading on an AD factor and items 2, 5, 8, 15, 18, 20, 21, 24, 27, and 30 loading on an AA factors. The 3 factors were left free to inter-correlate. Table 2.5 shows the χ2 statistics and indices. The 3 factor model showed acceptable fit to the MASQ-D30 data of sample 3, with fit indices that all exceeded their respective critical cut-off values (NNFI, NFI and CFI > 0.90 and RMSEA < 0.06). Similar results of acceptable model fit were found in the primary care group, mental health care group, healthy control group and the male and female subpopulations of sample 3. These results indicate that the MASQ-D30 represents the 3 dimensions it was designed to measure and that the underlying structure is invariant over different subpopulations, which supports the construct validity of the instrument.
2.4 Discussion
We present a shortened 30 item adaptation of the MASQ: the MASQ-D30, which we constructed by use of factor analysis and the additional judgement of clinical experts. The MASQ-D30 questionnaire was constructed to represent the dimensions of the tripartite model and we demonstrated its scales to have acceptable internal consistency and convergent validity that were comparable with the full MASQ. In addition, we found support for the construct validity of the MASQ-D30.
The MASQ-D30 has two major advantages. First, problematic items with weak or complex loadings in the MASQ are not present in the MASQ-D30, which is likely to make it a more stable representation of the tripartite model. Second, administration of the MASQ-D30 takes less time, which makes the application less expensive.
The MASQ-D30 represents an underlying tripartite structure, analogue to the model that has been found in earlier studies with the MASQ (Keogh and Reidy, 2000; De Beurs et al., 2007). Research on the tripartite model has mostly relied on the study of associations between self report measures, structured interviews and observer ratings (Watson et al., 1995a, b; Keogh and Reidy, 2000; De Beurs et al., 2007) and has regularly used instruments that were not primarily designed to measure the dimensions of the tripartite model (De Beurs et al., 2005). Because of its improved applicability, the MASQ-D30 can help to study the tripartite model more thoroughly and to compare this dimensional approach to the categorical DSM-IV method. In addition, the MASQ-D30 can be used in epidemiological studies and trials to study the relation between the tripartite model and biological markers and psychosocial determinants.
35 about the neural substrates of distinct behavioural dimensions that could underlie symptoms of depression and anxiety (Shankman and Klein, 2003).
Table 2.4: The bivariate correlation coefficients of the MASQ-D30 and full MASQ scales with rating scales and self-report measures in sample 2 (n =1461), sample 3 (n = 2471), the healthy control group (HC), the primary care group (PC) and the mental health care group (MHC)
Scale: General
Distress (GD)
Anhedonic Depression (AD)
Anxious Arousal (AA) MASQ
MASQ-D30
MASQ
MASQ-D30
MASQ MASQ-D30
MADRS 1416 0.72 0.70 0.64 0.61 0.53 0.52
BAS 1416 0.57 0.56 0.45 0.42 0.60 0.60
BDI-affa 961 0.73 0.71 0.61 0.57 0.49 0.47
BDI-soma 961 0.64 0.63 0.52 0.48 0.58 0.55
BDI-coga 961 0.71 0.72 0.47 0.44 0.42 0.40
BDI-tota 961 0.79 0.78 0.60 0.56 0.57 0.55
BSI-dep 1456 0.87 0.85 0.63 0.60 0.52 0.51
BSI-anx 1456 0.67 0.66 0.40 0.36 0.70 0.70
BSI-pho 1456 0.58 0.57 0.39 0.34 0.59 0.58
BSI-som 1456 0.54 0.53 0.35 0.31 0.88 0.89
BSI-int 1456 0.70 0.71 0.44 0.40 0.42 0.42
BSI-tot 1456 0.84 0.83 0.53 0.49 0.72 0.71
IDS 2471 - 0.75 - 0.67 - 0.66
BAI 2471 - 0.60 - 0.49 - 0.76
4DQSd 2471 - 0.83 - 0.67 - 0.65
HC IDS 577 - 0.60 - 0.50 - 0.55
BAI 577 - 0.50 - 0.37 - 0.61
4DQSd 577 - 0.65 - 0.41 - 0.40
PC IDS 909 - 0.67 - 0.59 - 0.56
BAI 909 - 0.48 - 0.37 - 0.68
4DQSd 909 - 0.79 - 0.61 - 0.59
MHC IDS 621 - 0.65 - 0.57 - 0.56
BAI 621 - 0.45 - 0.28 - 0.72
36
Table 4 (continued). Legend: MASQ = Dutch Adaptation of the Mood and Anxiety Symptoms Questionnaire; MASQ-D30 = Short Form of the Dutch adaptation of the MASQ; MADRS = Montgomery Åsberg Depression Rating Scale; BAS = Brief Anxiety Scale; BDI = Beck Depression Inventory II: aff = affectivity, som = somatisation, cog = cognition, tot = total score; BSI = Brief Symptom Inventory: dep = depression, anx =anxiety, pho = phobic anxiety, som = somatic complaints, int = interpersonal sensitivity, tot = total score; IDS = Inventory of Depressive Symptoms; BAI = Beck Anxiety Inventory; 4DSQd = 4-Dimensional Symptoms Questionnaire Distress scale; HC = healthy control group; PC = primary care group; MHC = mental health care group (all correlations p<0.01 two-tailed)
a
The BDI was only administered to patients who met criteria for a mood disorder.
Table 2.5: Results of confirmatory factor analysis with a 3-dimensional model of the MASQ-D30 in sample 3, the healthy control group (HC), the primary care group (PC) and the mental health care group (MHC) and separately for males and females in sample 3.
Sample N S-Bχ2 a NFI NNFI CFI RMSEA (90% CI) Sample 3 2471 2375.46 0.94 0.94 0.95 0.045 (0.043-0.046) PC 909 1149.93 0.91 0.94 0.94 0.045 (0.042-0.048) MHC 621 979.35 0.90 0.94 0.94 0.048 (0.044-0.052) HC 577 671.60 0.82 0.91 0.92 0.034 (0.030-0.039) Male 819 1102.24 0.92 0.94 0.95 0.046 (0.043-0.049) Female 1652 1770.30 0.93 0.94 0.94 0.045 (0.043-0.048)
MASQ-D30 = Short Form of the Dutch Adaptation of the Mood and Anxiety Symptoms Questionnaire; NFI = Normed fit index; NNFI = non-normed fit index; CFI = comparative fit index; RMSEA = root mean-square error of approximation; 90% CI = 90% confidence interval
a)All Satorra-Bentler
χ2 statistics with 402 degrees of freedom; all p-values <0.001