MECHANISMS OF DRUG-INDUCED LIVER INJURY: THE ROLE OF HEPATIC TRANSPORT PROTEINS
Kyunghee Yang
A dissertation submitted to the faculty of the University of North Carolina at Chapel Hill in partial fulfillment of the requirements for the degree of Doctor of Philosophy
in the Eshelman School of Pharmacy
Chapel Hill 2014
iii ABSTRACT
Kyunghee Yang: Mechanisms of Drug-Induced Liver Injury: The Role of Hepatic Transport Proteins (Under the direction of Kim L.R. Brouwer)
The objectives of this research were to investigate mechanisms of drug-induced liver injury (DILI) that involve drug-bile acid (BA) interactions at hepatic transporters, and develop a novel strategy to reliably predict human DILI. Troglitazone (TGZ), an antidiabetic withdrawn from the market due to severe DILI, was employed as a model hepatotoxic drug. Pharmacokinetic modeling of taurocholic acid (TCA, a model BA) disposition data from human and rat sandwich-cultured hepatocytes (SCH) revealed that species differences exist in TCA hepatocellular efflux pathways; in human SCH, TCA biliary excretion predominated, whereas biliary and basolateral excretion contributed equally to TCA efflux in rat SCH. This finding explains, in part, why rats are less susceptible to DILI compared to humans after administration of drugs that inhibit BA biliary excretion. The present study also revealed for the first time that TGZ sulfate (TS), a major TGZ metabolite, inhibits BA basolateral efflux in addition to biliary excretion. These findings support the hypothesis that TS is an important mediator of altered hepatic BA disposition; increased hepatic TS exposure due to impaired canalicular transport function might
predispose a subset of patients to hepatotoxicity. A novel in vitro model system, rat SCH lacking selected canalicular transporters [breast cancer resistance protein (Bcrp) and multidrug resistance-associated protein 2 (Mrp2)] was established to test this hypothesis; biliary excretion of hepatically-generated TS was not significantly altered, suggesting that alternate transporters can excrete TS into bile, and loss of Bcrp and/or Mrp2 function would not necessarily be risk factors for increased hepatocellular TS accumulation in rats. To translate experimental data to in vivo humans, a mechanistic model that
iv
v
ACKNOWLEDGEMENTS
First of all, I want to thank Dr. Kim Brouwer for her constant support, guidance, and
encouragement, and for having been there as a great mentor at every stage of my growth over the last four years. I also want to thank all the members of my dissertation committee who have been influential on my scientific and personal development: Dr. Watkins for serving as my chair and all of the guidance, advice, and opportunities he has provided during my dissertation research and also for future career; Dr. Thakker for insights on drug metabolism and transport, and exciting scientific discussions; Dr. Howell for all of the modeling advice and expertise which have enabled me to carry out the mechanistic modeling project; Dr. Clewell for all of the helpful comments and insights on pharmacokinetic modeling; Dr. Paine for serving as my early committee and continuing support.
vi
students of my year, Nicole Zane, Akinyemi Oni-Orisan, and Dan Crona, who were there with me enduring together the coursework and the qualifying exam, and celebrating survival. I also want to thank a number of ESOP members who have helped me throughout the graduate school years: Christina Won, Julie Lauffenburger, Melea Ward, Scott Brantley, Brandon Gufford, Garrett Ainslie, and Kristina Wolf. I cannot thank the DILIsim team and the folks at the Hamner Institutes enough for their support and all the times we spent together; Jeffrey Woodhead, Scott Siler, Yuching Yang, Lisl Shoda, Patti Steele, and Geoffrey Bock. There are so many people who had brought expertise from various fields and help strengthen my research: Alexander Sedykh, Alexander Tropsha, Bob St. Claire, Cassandra Hubert, and Paul Stewart. I also thank my previous advisors and mentors, Myung Gull Lee and Hyunyoung Jeong, who led me to the exciting world of science and have been watching my development ever since.
vii
viii
TABLE OF CONTENTS
LIST OF TABLES ... ix
LIST OF FIGURES ... x
CHAPTER 1. Introduction ... 1
CHAPTER 2. Analysis of Hepatic Transport Proteins ... 53
CHAPTER 3. Species Differences in Hepatobiliary Disposition of Taurocholic acid in Human and Rat Sandwich-Cultured Hepatocytes; Implications for Drug-Induced Liver Injury ... 98
CHAPTER 4. An Experimental Approach to Evaluate the Impact of Impaired Transport Function on Hepatobiliry Drug Disposition using Mrp2-deficient TR- Rat Sandwich-Cultured Hepatocytes in Combination with Bcrp Knockdown... 124
CHAPTER 5. Hepatocellular Exposure of Generated Metabolites, Troglitazone Sulfate and Glucuronide, is Determined by the Interplay between Formation and Excretion in Rat Sandwich-Cultured Hepatocytes Lacking Selected Canalicular Transporters ... 153
CHAPTER 6. Quantitative Relationship between Intracellular Lithocholic Acid, Chenodeoxycholic Acid and Toxicity in Sandwich-Cultured Hepatocytes; Incorporation into a Mechanistic Model of Drug-Induced Liver Injury ... 179
CHAPTER 7. Mechanistic Modeling of Drug-Induced Liver Injury Predicts Delayed Presentation and Species Differences in Bile Acid -Mediated Troglitazone Hepatotoxicity ... 211
CHAPTER 8. Summary and Future Directions ... 261
ix
LIST OF TABLES
Table 1.1. Physicochemical and pharmacokinetic properties of drugs with
different mechanisms of cholestasis. ... 25
Table 1.2. Relationship between mechanism of cholestasis (impaired formation of bile and obstruction of bile flow) and the extent of metabolism and excretion, BDDCS, and BSEP inhibition for 77 cholestatic compounds... 31
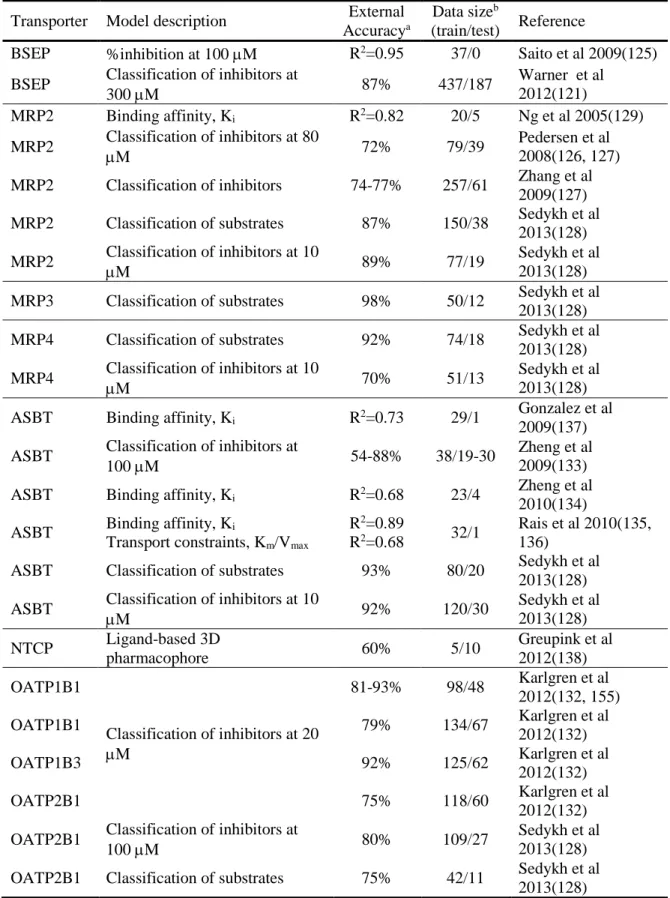
Table 1.3. Computational models of small molecule interactions with bile acid transporters. ... 32
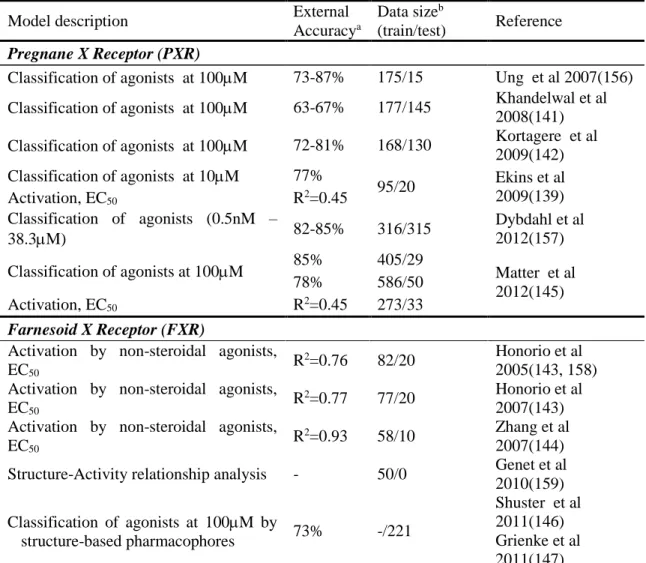
Table 1.4. Computational models of PXR and FXR activation. ... 33
Table 2.1. Human hepatic influx transporter proteins. ... 74
Table 2.2. Human hepatic efflux transporter proteins. ... 76
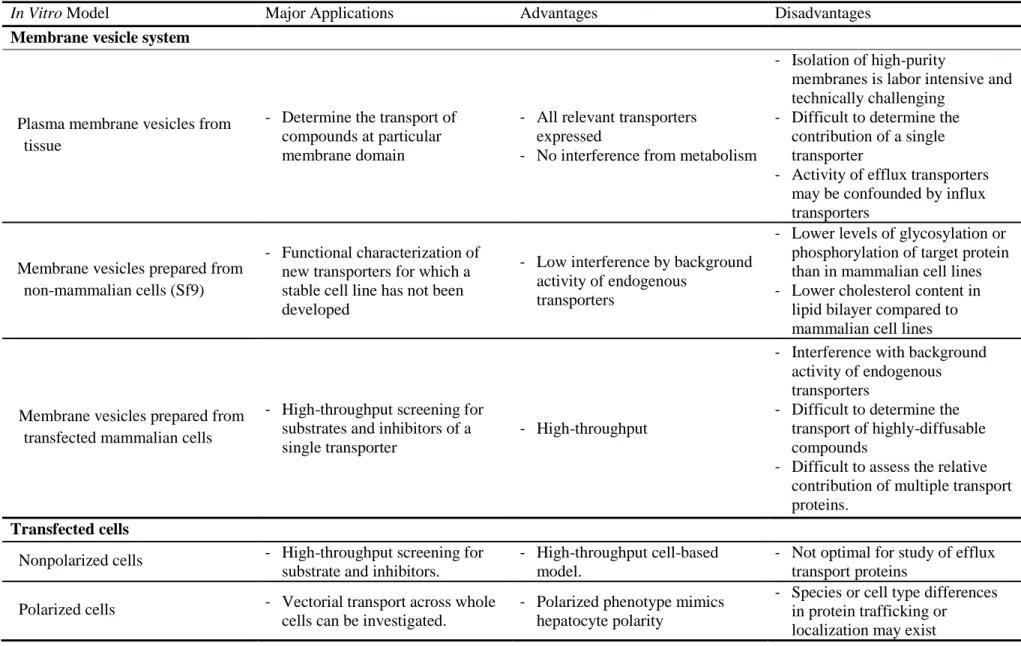
Table 2.3. Summary of advantages and disadvantages of in vitro models used to study hepatobiliary drug transport. ... 78
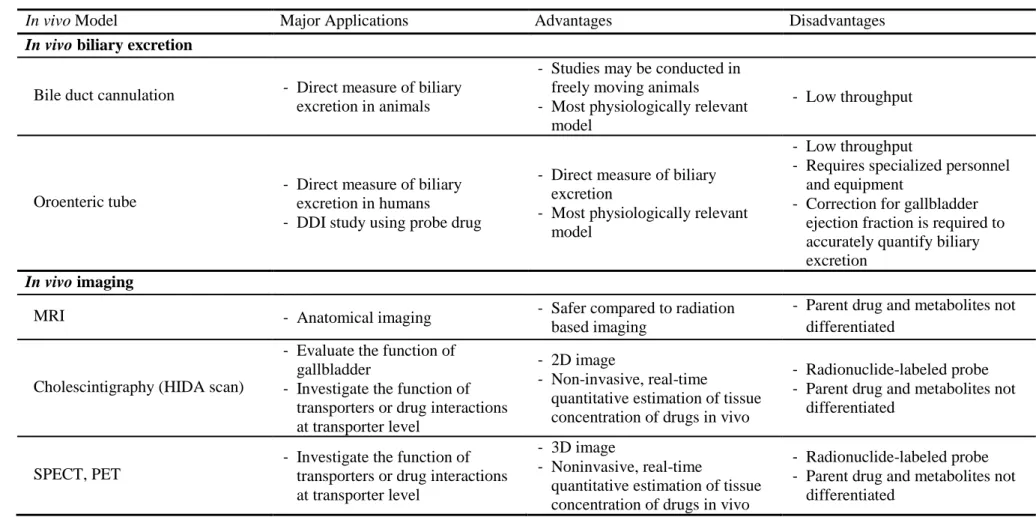
Table 2.4. Summary of advantages and disadvantages of in vivo models used to study hepatobiliary drug transport. ... 81
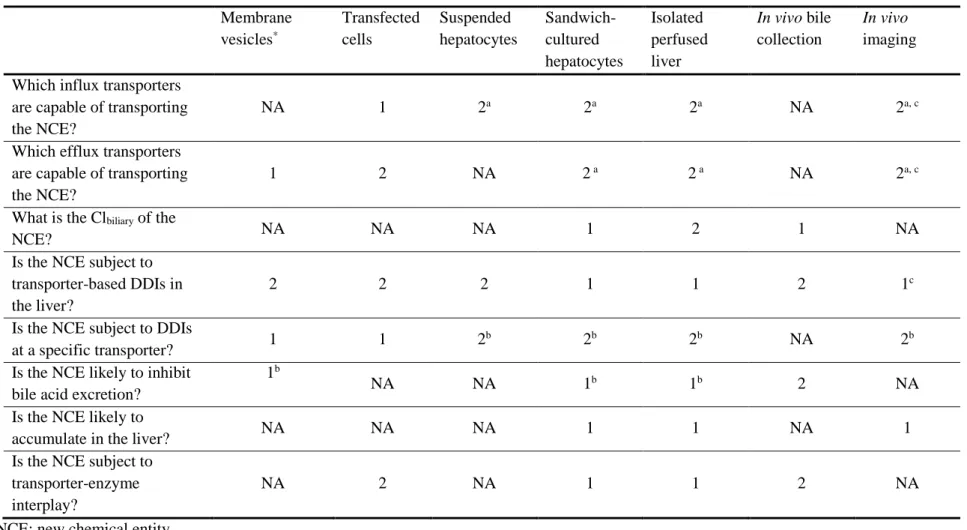
Table 2.5. Preferred approaches to answer specific questions regarding hepatobiliary drug transport. ... 82
Table 3.1. Summary of parameter estimates based on the model scheme depicted in Figure 3.2 describing taurocholic acid (TCA) disposition in human and rat sandwich-cultured hepatocytes (SCH) without (Control) or with 10 µM Troglitazone (+TGZ) pre-incubation. ... 113
Table 4.1. Total Accumulation and BEI (mean ± SEM) of probe substrates at MOI=5 vs. non infected control. ... 141
Table 6.1. Parameter values describing the relationship between hepatocellular lithocholic acid (LCA) and chenodeoxycholic acid (CDCA) concentrations, and intracellular ATP. ... 196
Table 7.1. Summary of troglitazone-mediated hepatotoxicity in human SimPops and clinical trials. ... 224
x
LIST OF FIGURES
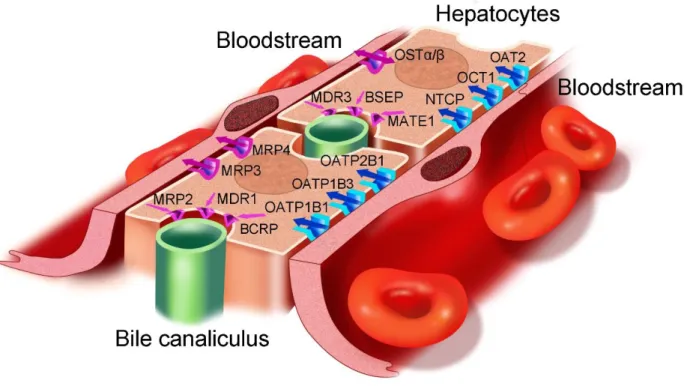
Figure 1.1. Localization of bile acid transporters in human hepatocytes (A) and enterocytes (B). ... 34 Figure 1.2. Mechanisms of altered bile acid transport by cholestatic drugs. ... 35 Figure 2.1. In vivo architecture of polarized hepatocytes with distinct apical and
basolateral domains facing respectively the bile canaliculus and bloodstream. ... 83 Figure 2.2. In vitro models and the related methods to study hepatobiliary drug transport. ... 84 Figure 3.1. Schemes depicting the uptake and efflux protocol. ... 114 Figure 3.2. Model schemes depicting the disposition of taurocholic acid (TCA)
in sandwich-cultured hepatocytes (SCH) studies based on the experimental design
depicted in Figure 3.1. ... 115 Figure 3.3. Taurocholic acid (TCA) mass versus time data in rat and human
sandwich-cultured hepatocytes (SCH) in the absence (Control) or presence of
10 µM troglitazone (TGZ) pre-incubation. ... 116 Figure 3.4. Inhibition of multidrug resistance-associated protein 4 (MRP4)-mediated
transport of [3H]dehydroepiandrosterone sulfate (DHEAS) by troglitazone sulfate (TS)
in membrane vesicles from MRP4-overexpressing and control human embryonic kidney cells. ... 117 Figure 3.5. Impact of impaired function of canalicular and/or basolateral efflux transporters
on hepatic TCA exposure. ... 118 Figure 3.6. Net effects of inhibition of uptake and efflux transporters on hepatic TCA exposure. ... 119 Figure 4.1. Efficient knockdown of Bcrp in WT and TR- rat SCH. ... 142 Figure 4.2. Effects of Bcrp knockdown on mean relative levels of Oatp1a1, Ntcp, Bsep, P gp,
Mrp4, and Mrp2 proteins in WT and TR- rat SCH infected with Ad siNT Ad siBcrp. ... 143 Figure 4.3. Effects of non-targeted and targeted adenoviral infection in WT and TR- SCH
at increasing MOI. ... 144 Figure 5.1. Proposed mechanism of troglitazone (TGZ)-mediated hepatotoxicity. ... 167 Figure 5.2. Intracellular accumulation of troglitazone (TGZ) and generated metabolites
[TGZ sulfate (TS) and TGZ glucuronide (TG)] in WT and TR- rat SCH in the absence or
presence of Bcrp Knockdown. ... 168 Figure 5.3. Accumulation of troglitazone (TGZ) and generated metabolites
[TGZ sulfate (TS) and TGZ glucuronide (TG)] in the medium of WT and TR- rat SCH
in the absence or presence of Bcrp Knockdown. ... 169 Figure 5.4. Recovery of troglitazone (TGZ) and generated metabolites [TGZ sulfate (TS),
TGZ glucuronide (TG), and TGZ quinone (TQ)] in WT and TR- rat SCH in the absence or
presence of Bcrp Knockdown. ... 170 Figure 5.5. Bsep-mediated transport of taurocholate (TC) and troglitazone sulfate (TS)
in membrane vesicles. ... 171 Figure 5.6. Hepatobiliary disposition of troglitazone (TGZ) and generated
metabolites [TGZ sulfate (TS) and TGZ glucuronide (TG)] in WT and TR- rat SCH
xi
Figure 5.7. Metabolism of troglitazone (TGZ) in S9 fraction prepared from liver tissues of
WT and TR- rats. ... 173 Figure 6.1. Schematic overview of the bile acid (BA) transport inhibition model in DILIsym®... 197 Figure 6.2. Toxicity and bile acid (BA) accumulation in lithocholic acid (LCA)-treated
rat, human, mouse, and dog sandwich-cultured hepatocytes (SCH). ... 198 Figure 6.3. Toxicity and bile acid (BA) accumulation in chenodeoxycholic acid
(CDCA)-treated rat and human sandwich-cultured hepatocytes (SCH). ... 199 Figure 6.4. Relationship between intracellular lithocholic acid (LCA) and
chenodeoxycholic acid (CDCA) concentrations and ATP. ... 200 Figure 7.1. Schematic overview of the bile acid transport inhibition module in DILIsym. ... 227 Figure 7.2. Predicted and observed plasma concentration of troglitazone (TGZ) and
TGZ sulfate (TS) in humans and rats. ... 228 Figure 7.3. Simulated DILI responses in human and rat populations (SimPops)
1
CHAPTER 1. Introduction
An Updated Review on Drug-Induced Cholestasis: Mechanisms and Investigation of
Physicochemical Properties and Pharmacokinetic Parameters
1INTRODUCTION
The liver is the major organ responsible for the metabolism and excretion of endogenous and exogenous compounds, including drugs. The liver is predisposed to drug toxicity because of its anatomical location and the expression of uptake transporters that facilitate accumulation of drugs in hepatocytes. Drug-induced liver injury (DILI) is the most common cause of acute liver failure (1), and is one of the primary reasons for the failure of pharmaceutical agents during drug development.
Unfortunately, current in vitro screening approaches or in vivo preclinical studies do not adequately predict the likelihood of DILI. Even Phase III clinical trials that involve a few thousand patients often fail to detect DILI. In some cases, instances of severe liver injury and death only were observed after drug approval and administration to tens or hundreds of thousands of patients. These unexpected findings led to blackbox warnings, or in severe cases, withdrawal of the drug from the market. Recent examples include troglitazone and bromfenac (withdrawn), and bosentan and diclofenac (blackbox warnings).
DILI is classified into hepatocellular, mixed, or cholestatic injury based on the major underlying mechanism (2). Among 784 DILI cases reviewed by the Swedish adverse drug reactions advisory committee between 1970 and 2004, almost one-half of the cases had either cholestatic or mixed cholestatic hepatic toxicity (3). Acute cholestatic injury comprised approximately 16% of all hepatic
2
adverse drug reactions in a Danish study of 1100 DILI cases from 1978 to 1987 (4). In the United States, drugs were responsible for approximately 20% of cases of jaundice in the elderly population (5).
However, reported reactions are thought to be only a small fraction of all the instances of drug-related cholestasis in the community because drug-induced cholestasis can present with asymptomatic disease where the only clinical manifestation is an elevation in liver enzymes, which often is not detected or reported. Therefore, the actual number of cases and medical costs associated with drug-induced cholestasis could exceed what has either been reported or estimated. In the present paper, the clinical presentation and mechanisms of bile-acid mediated drug-induced cholestasis are reviewed. In addition, we investigated whether the physicochemical properties or pharmacokinetic parameters of selected drugs, or the ability of these compounds to inhibit BSEP, influenced the type of cholestatic liver injury (impaired bile formation vs. obstruction of bile flow). Furthermore, existing in silico models developed to predict drug effects on bile acid transporters and nuclear receptors that are involved in bile acid homeostasis are reviewed.
CLINICAL FEATURES OF DRUG-INDUCED CHOLESTASIS Diagnosis
Biochemical tests (liver function tests) typically are used to define drug-induced cholestasis. The Council of International Organizations of Medical Sciences (CIOMS) defines cholestatic injury as an elevation of serum alkaline phosphatase (AP) to greater than 2x the upper limit of normal (ULN) combined with a major elevation of γ-glutamyl transpeptiase (GGT) in the presence of a normal alanine
3
laboratory tests including liver biopsy findings, if available, and the exclusion of other potential causes for liver injury.
Clinical Presentation
Drug-induced cholestasis may present as an acute illness that promptly diminishes after withdrawal of the offending drug. Drug-induced cholestasis may present with or without jaundice, and symptoms may occur weeks or months after the start of treatment. Nonspecific symptoms such as nausea, malaise, anorexia, and fatigue may be elicited due to parenchymal liver injury. For some drugs (e.g., amoxicillin-clavulanate, erythromycin), abdominal pain or discomfort has been reported (7). Chronic drug-induced cholestasis can result in the development of xanthomas, pruritus, and melanoderma. Symptoms often resolve following withdrawal of the offending drug, but in some cases, if there is
significant loss of the interlobular bile ducts, chronic liver disease may develop and even progress to liver failure (8). Rarely, drugs can induce cholelithiasis (gall stones) or mimic large duct sclerosing cholangitis, resulting in extrahepatic obstruction (9). Drug-induced cholestasis can be classified into the following categories:
Acute Drug-Induced Cholestasis without Hepatitis (Bland Cholestasis): This is a rare type of drug-induced cholestasis that typically is produced by estrogens or anabolic steroids, and manifests histologically as pure canalicular cholestasis. Bland cholestasis causes abnormal biliary secretions without hepatocellular damage.
Acute Drug-Induced Cholestasis with Hepatitis (Cholestatic Hepatitis): This type of drug-induced cholestasis is associated with concomitant hepatic parenchymal damage. Cholestatic hepatitis is characterized by portal inflammation and varying degrees of hepatocyte injury and necrosis.
4
Chronic Drug-Induced Cholangiopathies: These drug-induced cholestatic disorders vary from mild, nonspecific bile duct injury (mild elevation in AP or GGT) to vanishing bile duct syndrome (VBDS), sclerosing cholangitis, and cholelithiasis (10).
PHYSIOLOGY OF BILE ACID HOMEOSTASIS
Cholestasis may occur if there is impaired formation of bile or if there is a physical obstruction to the flow of bile after it has been secreted from hepatocytes. To understand the pathogenesis of cholestasis, it is important to understand the physiological principles involved in bile flow.
Synthesis and Conjugation
Primary bile acids are synthesized from cholesterol in hepatocytes. Approximately 16 enzymes are involved in this process; the rate limiting step is 7α-hydroxylation by Cytochrome P450 7A1
(CYP7A1) (11, 12). Chenodeoxycholic acid (CDCA) and cholic acid (CA) are the most common primary bile acids in humans while rodents have high levels of muricholic acid (MCA) and hyocholic acid (HCA). Secondary bile acids are formed by gut bacteria-mediated dehydroxylation of primary bile acids. The most common secondary bile acids include lithocholic acid (LCA) and deoxycholic acid (DCA), which are formed by 7-dehydroxylation of CDCA and CA, respectively. Bile acids are conjugated extensively with glycine or taurine in the liver, and more than 98% of bile acids excreted from the liver are amidated. Bile acids also may undergo sulfation or glucuronidation. Conjugated bile acids are more water soluble and therefore, are excreted more readily into feces and urine. Bile acid synthesis has been
comprehensively reviewed elsewhere (11, 13). Hepatobiliary Transport
5
OATPs. The efficiency of hepatic uptake varies depending on the bile acid structure: trihydroxy > dihydroxy bile acids, and conjugated > unconjugated bile acids (14). Individual bile acids may use different uptake transporters. The uptake of conjugated bile acids such as taurocholic acid (TCA) is mediated predominantly (>75%) by sodium-dependent NTCP. In contrast, sodium-dependent uptake accounts for less than half of the uptake of unconjugated bile acids (15-18). Within hepatocytes, bile acids are translocated by diffusion or undergo carrier-mediated transport after binding to cytosolic proteins such as glutathione S-transferases, liver fatty acid binding protein (L-FABP), and dehydrogenases (19).
Vesicular transport of bile acids has been suggested, but confocal microscopy studies of fluorescent bile acid analogs in hepatocyte couplets showed no intracellular vesicular structure containing bile acids (20). However, characteristics and intracellular disposition of fluorescent bile acid analogs may differ between individual bile acids, and the significance of vesicular transport of bile acids in hepatocytes remains to be investigated. At the canalicular membrane, bile acids are excreted into bile predominantly via the bile salt export pump (BSEP) in an ATP-dependent manner (Figure 1A). Multidrug resistance-associated protein (MRP) 2, which is the main driving force for bile salt-independent bile flow through canalicular excretion of reduced glutathione, also transports glucuronide and sulfate conjugates of bile acids (21). The osmotic forces that are generated by bile acid secretion, coupled with the coordinated contraction of the actin filaments that surround the canaliculus, generate the pressure necessary to force bile to flow down the bile duct. The biliary tract itself is composed of a network of small to large ducts that are lined by
cholangiocytes (bile duct epithelial cells). Cholangiocytes also express ion and organic anion transporters on the apical [i.e. apical sodium-dependent bile salt transporter (ASBT), OATP1A2] and basolateral [i.e. organic solute transporter (OST)α/β, MRP3] membranes that modify the composition of bile before it
6
taurolithocholate 3-sulfate (TLC-S), whereas TCA was transported to a significant degree only by rat Mrp3 (24). Unconjugated (CA, DCA) and conjugated bile acids [TCA, GCA, taurochenodeoxycholic acid (TCDCA), glycochenodeoxycholic acid (GCDCA)] were transported by MRP4 in the presence of
glutathione with higher affinity than MRP3 (25), suggesting that MRP4 may play an important role in basolateral efflux of bile acids in humans. OSTα-OSTβ transports glycine and taurine conjugated bile acid species by facilitated diffusion; OSTα-OSTβ mediates cellular efflux or uptake depending on the
electrochemical gradient (26, 27). The contribution of basolateral efflux to overall hepatic bile acid excretion is small under normal conditions, but expression of these transporters is up-regulated under cholestatic conditions as an important part of adaptive response to serve as a compensatory route of bile acid excretion (28-32). Assem et al. reported that Mrp4 and sulfotransferase (Sult) 2a1 are both
upregulated during cholestasis suggesting that increased sulfation and hepatic basolateral efflux of sulfated bile acids leads to increased renal excretion as a compensatory excretion route (33). In healthy humans, the proportion of sulfated bile acids in the serum is less than 2% of bile acids, and the amount of total bile acids excreted in urine is minimal, whereas in patients with hepatobiliary/cholestatic disease, urinary excretion of bile acids increased more than 100-fold, with 25 – 80% of urinary bile acids excreted in the sulfated form (34). These studies demonstrate that sulfation and glucuronidation of bile acids are important detoxification pathways; conjugation increases the hydrophilicity of bile acids and, in most cases, decreases the toxicity and facilitates the urinary excretion of bile acids.
Intestinal Transport
7
OSTα-OSTβ (Figure 1B) (16, 23, 37-41), and return to the liver in portal blood followed by efficient
uptake by hepatocyte transporters, as described above. It has been reported that MRP4 is expressed in the basolateral membrane of Caco-2 cells (42), but its expression and contribution to basolateral transport of bile acids in enterocytes remain to be investigated. Sulfate-conjugates of bile acids are not deconjugated readily and only a limited amount of sulfated bile acids are re-absorbed (34). Bile acids that are not absorbed from the colon are eliminated in the feces; fecal elimination is balanced by biosynthesis from cholesterol in the liver.
Bile Acid Toxicity
Bile acids are required for the digestion and absorption of fats and fat-soluble vitamins and they facilitate the excretion of bile pigments, cholesterol, and other medium-sized molecules by micellar solubilization. Bile acids induce biliary lipid secretion and solubilize cholesterol in bile, thereby
promoting cholesterol elimination. Bile acids are potent activators of nuclear receptors such as farnesoid-X receptor (Ffarnesoid-XR) and pregnane farnesoid-X receptor (Pfarnesoid-XR), and they play an important role in the regulation of lipid homeostasis (43, 44).
However, bile acids can be cytotoxic when present in abnormally high concentrations in hepatocytes. Therefore, defects in bile acid excretion may lead to cholestasis. Defects in hepatocytes (especially at the canalicular membrane), altered fluidity of bile, impaired contraction of the actin filaments in the pericanalicular region, and changes in bile duct patency can reduce bile flow.
Importantly, drugs also can affect bile flow at one or more of these steps, which will be discussed in more detail in the following sections. Bile acid toxicity is thought to be highly correlated with hydrophobicity; more hydrophobic bile acids are more cytotoxic. The rank order of bile acid cytotoxicity, from greatest to least is: LCA> CDCA, DCA > CA > ursodeoxycholic acid (UDCA) (45). Under normal conditions, it is likely that the unbound concentration of bile acids in the cytosol of hepatocytes is low because bile acids are highly bound to cytosolic proteins. However, if hepatic concentrations exceed the binding capacity of the cytosolic proteins, unbound bile acid concentrations would be expected to increase markedly.
8
necrosis (46, 47). LCA has been shown to induce biliary tract injury; oral administration of LCA to mice resulted in cholangitis (48).
MECHANISMS OF DRUG-INDUCED CHOLESTASIS
Cholestatic drugs may disrupt bile acid homeostasis by direct inhibition of bile acid transport (Figure 2A), or by indirect processes, which may include regulation of transporter localization (Figure 2B) or expression (Figure 2C). In the following section, the physiological mechanisms of drug-induced cholestasis that are associated with altered bile acid homeostasis are reviewed.
Role of hepatic transport proteins in drug-induced cholestasis
Hepatic biliary and basolateral transport proteins regulate the physiologic/pathophysiologic effects of endogenous compounds such as bile acids as well as exogenous compounds. Increasing evidence supports the hypothesis that drug-mediated functional disturbances in hepatic bile acid transporters can lead to intracellular accumulation of potentially harmful bile acids and subsequent development of cholestatic hepatocyte damage. In an effort to avoid drug-induced cholestasis, an in vitro
test for BSEP inhibition during drug development may prove beneficial to screen for hepatotoxic
9
hepatocytes; total as well as unbound intracellular bile acid concentrations may be important in predicting drug-bile acid interactions.
Several transport proteins have been identified as potential loci for drug-induced cholestasis. These include the basolateral uptake transporters (NTCP and OATPs), canalicular efflux transporters (BSEP, MRP2, and MDR3), and basolateral efflux transporters (MRP3 and MRP4). The potential role(s) of each of these transport proteins in drug-induced cholestasis will be discussed in detail in the following paragraphs.
Hepatic Canalicular Efflux Transport Proteins. The rate-limiting step in bile formation is transport of biliary constituents across the canalicular membrane. This process is mediated predominantly by BSEP, a hepatic transport protein that is a member of the ATP-binding cassette (ABC) gene
superfamily. Impaired BSEP function due to defects in gene coding or gene regulation can lead to inherited and acquired cholestatic disorders such as progressive familial intra-hepatic cholestasis type 2 (PFIC2), benign recurrent intrahepatic cholestasis type 2 (BRIC2), and intrahepatic cholestasis of pregnancy (50-52). Many drugs that cause either cholestatic or mixed hepatocellular/cholestatic liver injury (e.g., troglitazone, bosentan, cyclosporine, rifampin, sulindac, and glibenclamide) inhibit
10
acids (TCA, GCA, TCDCA, and GCDCA) with similar potencies (IC50), whereas cyclosporine A
exhibited a 10-fold more potent inhibition of GCA and TCDCA transport compared to TCA and GCDCA (57). Thus, extrapolation of the results of transport inhibition from one bile acid to another may not be accurate. Also, one should note that membrane vesicles do not express metabolizing enzymes, thus inhibitory effects of metabolites cannot be detected unless the metabolite(s) are tested directly.
Whereas most of the BSEP inhibitors directly cis-inhibit BSEP, estradiol 17β-glucuronide and progesterone metabolites indirectly trans-inhibit Bsep after secretion into the bile canaliculus by Mrp2 (61). Bosentan stimulated Mrp2-dependent bilirubin excretion and bile salt-independent bile flow, while phospholipid and cholesterol secretion were markedly inhibited and uncoupled from bile salt secretion (62). Inhibition of biliary lipid secretion was not observed in Mrp2-deficient TR- rats, which suggested that translocation of organic anions across the canalicular membrane is a prerequisite for the occurrence of the uncoupling effect (62).
MDR3, an ATP-dependent phospholipid flippase, translocates phosphatidylcholine from the inner to the outer leaflet of the canalicular membrane (63). Subsequently, canalicular phospholipids are solubilized by canalicular bile salts to form mixed micelles, thereby protecting cholangiocytes from the detergent properties of bile salts. Mutations in MDR3 result in impaired biliary excretion of
phosphatidylcholine and cause PFIC3, a severe pediatric liver disease that usually requires liver
11
Hepatic Basolateral Efflux Transport Proteins. As described above, BSEP inhibition is a risk factor for drug-induced cholestasis. However, not all drugs that inhibit BSEP cause cholestasis. This suggests that screening for BSEP inhibition alone cannot accurately predict the hepatotoxic potential of drugs. This might be due to compensatory mechanisms of bile acid transport. The basolateral efflux transporters, MRP3 and MPR4, play a minor role in bile acid efflux under normal conditions, but they are up-regulated under cholestatic conditions to compensate for impaired biliary excretion (67-72). Compensatory basolateral efflux prevents hepatic bile acid accumulation and enables subsequent renal elimination of bile acids. Thus, impaired function of MRP3 and MRP4 by drugs, or genetic
polymorphisms resulting in reduced-function variants may result in accumulation of toxic bile acids in hepatocytes. Troglitazone sulfate (TS), a major metabolite of troglitazone and a potent BSEP inhibitor, also inhibits MRP4-mediated dehydroepiandrosterone (DHEAS) transport; potent inhibition of both canalicular and basolateral efflux of bile acids by TS may predispose hepatocytes to toxicity (73). Our group has investigated the inhibitory effects of 88 compounds on MRP3 and MRP4, and reported that MRP4 inhibition was associated with an increased risk of cholestatic potential for drugs that are not BSEP inhibitors (74, 75). These results suggest that MRP4 inhibition also may represent a risk factor for the development of cholestatic DILI in humans.
Hepatic Uptake Transport Proteins. Basolateral uptake transporters are important in controlling hepatic and systemic exposure to drugs and toxins. The hepatic accumulation of bile acids is regulated by both uptake and efflux (basolateral and canalicular) processes, thus inhibition of hepatic bile acid uptake may exert protective effects by preventing the hepatic accumulation of bile acids. Bosentan, a potent inhibitor of human BSEP and rat Bsep, caused hepatic injury in humans, but bosentan-treated rats did not develop hepatotoxicity (54). Species difference in bosentan-induced hepatotoxicity might be explained by differential inhibition of human NTCP and rat Ntcp. Bosentan was a more potent inhibitor of sodium-dependent TCA uptake in rat (IC50 = 5.4 µM) than human (IC50 = 30 µM) suspended hepatocytes,
12
differentially affected the uptake and accumulation of CDCA species (CDCA and metabolites) compared with TCA in rat SCH, causing an intracellular increase in CDCA species but not TCA (18). Troglitazone inhibited both uptake and biliary excretion of TCA in rat and human hepatocytes, leading to unchanged or even decreased intracellular accumulation (18, 77-79). Hepatic accumulation of CDCA species was not altered after incubation with 10 µM troglitazone, but was significantly increased with 100 µM
troglitazone suggesting that biliary excretion of CDCA species was inhibited to a greater extent than uptake processes by higher concentrations of troglitazone. CDCA is more abundant in humans, and is known to be more cytotoxic compared to TCA (80, 81). These results suggest that one should consider species differences as well as differential inhibitory effects of drugs on individual bile acids when predicting hepatotoxicity in humans.
Role of intestinal transport proteins in drug-induced cholestasis
Bile acid concentrations in enterocytes are important in the bile acid regulatory loop. Once activated by bile acids, intestinal FXR induces an intestinal hormone, fibroblast growth factor 19 (FGF19; or Fgf15 in mice), which migrates to the liver and activates hepatic FGF receptor 4 (FGFR4) signaling to inhibit hepatic bile acid synthesis (13). Activation of hepatic FXR also down-regulates bile acid synthesis by activation of small heterodimer partner (SHP) (13). In ASBT null mice, which were unable to absorb bile acids in the ileum, intestinal and hepatic FXR activity was impaired resulting in decreased Fgf15 and Shp in the ileum and liver, respectively (82). Because Fgf15 and Shp play important roles in the
13
pruritus (83-85). Bile acid sequestrants are non-digestible resins that bind to intestinal bile acids and form an insoluble complex, reducing absorption of bile acids. They are used to treat primary
hypercholesterolemia, and also as a second-line treatment for pruritus in patients with incomplete biliary obstruction. ASBT inhibitors have been investigated to treat hypercholesterolaemia, but the effects on cholestatic liver disease have not been evaluated fully. Reduced absorption of bile acids through the enterohepatic circulation may have therapeutic effects in certain types of cholestatic liver disease, but effects on the feedback loop of bile acid synthesis also must be considered.
Indirect Interactions: Effects on Expression/Activity/Localization of Transport Proteins and Enzymes Involved in Bile Acid Homeostasis
Due to the critical physiological and pathophysiological role of bile acids, homeostasis is tightly regulated through multiple nuclear receptors including FXR, the retinoid-X receptor (RXR), the liver receptor homologue-1 (LRH-1), the constitutive androstane receptor (CAR) and the liver-X-receptor (LXR), as well as the cell surface bile acid receptors including the G-protein coupled receptor TGR5. In addition, bile acid transporters undergo post-transcriptional regulation including insertion/retrieval of transporters into/from the plasma membrane. These mechanisms allow fine tuning of bile acid synthesis and transport and, under normal physiological conditions, maintain enterohepatic circulation and regulate intracellular concentrations of bile acids through repression of bile acid synthesis, induction of bile acid metabolism (e.g. induction of phase I and II hydroxylation, sulfation and conjugation) as well as inhibition of hepatic bile acid uptake, and stimulation of bile acid efflux. The importance of nuclear receptors in the adaptive response to bile acids has been demonstrated in numerous knockout rodent models. For example, PXR or CAR knockout mice are more susceptible to cholestatic liver injury than wild-type mice (31, 86, 87). Nuclear receptor-mediated adaptive changes are likely caused by compounds normally excreted into bile (e.g. bile acids, hormones, drugs, or bilirubin) that are retained during
cholestasis and act as nuclear receptor ligands (88, 89).
14
example, acetaminophen liver toxicity was exacerbated by increased phase I-mediated oxidation to the reactive metabolite N-acetyl-p-benzoquinone-imine by CYP inducers (90, 91).
Several anticholestatic compounds such as UDCA, phenobarbital, and rifampicin are nuclear receptor agonists, which could explain their anticholestatic properties. In recent years, FXR agonists have been proposed as a treatment for cholestatic liver disease because they repress bile acid uptake and synthesis, and promote bile acid excretion by activation of canalicular bile acid transporters. However, the utility of FXR agonists in the treatment of cholestasis might depend on the type of cholestasis, and
changes in the expression of transport proteins that are induced. For conditions that are characterized by bile duct destruction such as primary biliary cirrhosis (PBC) or primary sclerosing cholangitis (PSC), stimulation of canalicular bile acid excretion may worsen liver injury. Interestingly, FXR knockout mice but not wild-type mice adapted to bile duct obstruction by increasing expression of Mrp4 mRNA and were protected from liver injury after ligation of the common bile duct (92). It was suggested that FXR acts as a negative regulator of the basolateral bile acid transport protein MRP4, whose increased expression normally protects the liver from accumulation of potentially toxic bile acids through basolateral efflux and subsequent renal elimination. FXR competes with CAR for binding at the MRP4 promoter and represses MRP4 induction by CAR activation; activation of FXR could impair the MRP4-mediated basolateral efflux of bile acids (93). Because of this, FXR antagonists might be beneficial in certain types of cholestasis (e.g. total biliary obstruction) where increased renal bile acid excretion is desired. For more detail about FXR and PXR and their role as potential targets for cholestasis, see the review of Jonker et al (43).
15
cholestasis. The most prominent example of this type of cholestasis is estrogen- and C17-alkylated steroid-induced cholestasis, which causes a clinical picture that is similar to intrahepatic cholestasis of pregnancy in susceptible women who use oral contraceptives or postmenopausal estrogen replacement therapy. Estrogen-induced cholestasis can be induced experimentally in rodents with estradiol-17β-D-glucuronide (E217G) or the synthetic estrogen ethinylestradiol (94, 95). Although trans-inhibition of BSEP-mediated bile acid transport by E217G has been demonstrated (61), the internalization of Bsep and Mrp2, which impairs the excretory function within minutes by reducing the amount of protein in the canalicular membrane, appears to be a key mechanism of cholestasis (96-98). E217G activates classical, Ca2+-dependent protein kinase C and phosphoinositol 3-kinase signaling pathways, which are
cooperatively involved in internalization and intracellular retention of Bsep/Mrp2 (99, 100). Furthermore, E217G activates the estrogen receptor α (ERα) in isolated perfused rat liver (101). This might explain why chemical inhibition or knock-down of ERα partially prevented decreased Bsep/Mrp2 activity and reduced transporter internalization (101). This finding is substantiated further by the observation that Erα(-/-) mice are resistant to ethinylestradiol-induced hepatotoxicity (102). At the moment, it is not quite clear how the activation of the ERα leads to internalization of transporter proteins. Recent data suggest that
phosphoinositol 3-kinase is not directly involved in this process, and it was shown that activation of protein kinase C actually precedes activation of ERα, suggesting that other yet unknown mediators are
involved (101). Interestingly, the upregulation of Mrp3 expression and activity in rat liver after
administration of ethinylestradiol was independent of cholestasis and required the estrogen receptor (103). Inflammation-induced cholestasis. Inflammation often contributes to liver injury during
16
liver, which respond by producing proinflammatory cytokines and/or nitric oxide (NO). These cytokines and NO activate membrane receptors and after intracellular signal transduction, they alter hepatic and renal transport protein expression and function.
Most of our knowledge about inflammation-induced changes in hepatic transport proteins is based on animal models; reduced expression of the bile acid uptake proteins Ntcp and Oatp, decreased expression of the canalicular bile acid efflux pumps Bsep and Mrp2, and downregulation of phase I and II metabolizing enzymes have been described. There is also some regulation through internalization of Bsep and/or Mrp2 from the canalicular membrane to intracellular vesicles (106, 107). However, the key factor appears to be translational regulation resulting in reduced mRNA transcription and hence protein
synthesis. Interestingly, signal transduction of inflammatory cytokines targets regulatory transcription factors (e.g. through phosphorylation or decreased binding of nuclear transcription factors) resulting in reduced nuclear quantities and function of these nuclear receptors. This has, for example, been
demonstrated for RXRα, an important heterodimerization partner for numerous nuclear receptors such as FXR, RAR, PXR and CAR, in response to LPS or IL-1β treatment (108-110).
So far, only a few studies have investigated the effects of inflammation-induced cholestasis in human disease. In PBC and PSC, cholestasis develops with a substantial inflammatory component; decreased expression of NTCP, OATP1B1, MRP2, and BSEP have been reported, whereas MRP3, MRP4, and OSTα/β expression were increased (30, 32, 111). Furthermore, in patients with advanced
stage PBC, the canalicular localization of MRP2 was disrupted and the expression of the uptake
17
ASSESSMENT OF PHYSICOCHEMICAL PROPERTIES AND PHARMACOKINETIC PARAMETERS OF DRUGS WITH DIFFERENT MECHANISMS OF CHOLESTASIS
In previous sections, direct and indirect mechanisms of drug-induced cholestasis mediated by interruption of bile acid homeostasis were reviewed. Since multiple processes are involved in bile acid homeostasis, an accurate prediction of the cholestatic potential of drugs mediated by these pathways is not straightforward. Several studies have investigated risk factors for the development of drug-induced cholestasis based on the drugs’ inhibitory effects on BSEP and physicochemical properties and
pharmacokinetic parameters (59, 60). In this type of analysis, it is critical to establish well-defined phenotypes (i.e. cholestasis). In general, there are two major mechanisms of drug-induced cholestasis: (1) impaired formation of bile due to drugs that interact with bile acid formation and/or hepatic bile acid transport (hepatic cholestasis), and (2) physical obstruction of bile flow after bile has been secreted from hepatocytes, which might be caused by drugs that damage the bile duct itself (ductular/ductal cholestasis). If cholestatic drugs with different mechanisms of cholestasis are all considered as one group, it may confound the study results and lead to inaccurate predictions of cholestatic potential. In the present investigation, we compared the physicochemical properties and pharmacokinetic parameters of 77 cholestatic drugs. The compounds selected for investigation included 50 drugs reported to cause cholestasis due to impaired bile acid formation (bland cholestasis or cholestatic hepatitis; classified into Group 1) and 27 drugs reported to cause cholestasis by obstruction of bile flow (classified into Group 2) (Table 1.1) (6, 114-117). Eleven drugs, including glyburide and carbamazepine, were reported to cause both impaired bile formation and obstruction of bile flow; these drugs were classified into Group 3 (“Mixed Cholestasis”; Table 1.1), and were not included in the statistical analysis (6, 114-117).
18
from Dragon Ver.5.5 (Talete SRL, Milano, Italy). The molecular weight distribution of these compounds ranged from 114.2 to 1202.8 g/ml. The median (range) molecular weights for Group 1 and Group 2 cholestatic drugs were 346.9 (114.2 – 1202.8) and 295.8 (136.1 – 814.1) g/mol, respectively. The log P value, which is an indicator of lipophilicity, varied from -1.8 to 8.6, with median (range) values of 2.6 (-1.4 – 8.6) and 2.3 (-1.8 – 5.1) for Group 1 and Group 2, respectively. The solubility, indicated by logS, ranged from -10.2 to 0.4, with median (range) values of -3.5 (-10.2 – 0.4) and -2.8 (-5.7 – -0.1) for Group 1 and Group 2, respectively. There were no statistically significant differences between drugs from these two different cholestatic groups with regard to any of the physicochemical properties discussed above.
Relationship between Mechanism of Cholestasis and Plasma Concentrations of Drugs
To explore the relationship between the mechanism of cholestasis and systemic exposure, we investigated the maximum plasma concentrations (Cmax), maximum unbound plasma concentrations (Cmax,u), and standard and maximum daily doses of the cholestatic drugs in humans. Information about Cmax, standard and maximum daily doses were retrieved from Thompson’s Micromedex DRUGDEX index, Lexicomp database, and PubMed. The Cmax,u was calculated for each drug using the Cmax and experimentally determined plasma protein binding values available from published sources. If protein binding data were not available, estimated values were used (118); estimated and experimentally
determined protein binding values were comparable for the drugs with available protein binding data. The Cmax distribution ranged from 0.00004 to 492 µg/ml (Table 1.1). The median (range) Cmax values for Group 1 and Group 2 cholestatic drugs were 1.1 (0.00028 – 492) and 2.0 (0.004 – 150) µg/ml,
19
standard daily doses or maximum daily doses between the two groups of cholestatic drugs, indicating that these values, by themselves, were not predictive of the mechanism of cholestasis.
Relationship between Mechanism of Cholestasis and the Metabolism and Excretion of Drugs To explore the relationship between the mechanism of cholestasis and drug disposition, we investigated the extent of metabolism, renal excretion and biliary excretion of cholestatic drugs. Drugs were categorized as high, intermediate or low, if the extent of metabolism/excretion was ≥ 70%, between
30% and 70%, and < 30%, respectively. The relationship between the mechanism of cholestasis and the biopharmaceutics drug disposition classification system (BDDCS) class also was investigated. The BDDCS categorizes drugs into four classes; class 1 represents drugs with high solubility and extensive metabolism, whereas class 2 drugs have low solubility and extensive metabolism. Drugs with high solubility and poor metabolism are categorized into class 3, and class 4 is composed of drugs with low solubility and poor metabolism (119). Information on metabolism, the routes of excretion, BDDCS class, and clinical parameters were retrieved from Thompson’s Micromedex DRUGDEX index, Lexicomp
database, PubMed, and WOMBAT-PK 2007 (120), and are presented in Table 1.1. Among the 50
cholestatic drugs categorized in Group 1, 26 (52%) drugs were classified as low with respect to the extent of metabolism. Among 27 cholestatic drugs categorized in Group 2, information about metabolism was available for 25 drugs; 60% (15 out of 25) of these were metabolized to a minimal extent. Drugs with low renal excretion accounted for 44% (22 out of 50) of Group 1 cholestatic drugs and 48% (13 out of 27) of Group 2 cholestatic drugs. Importantly, 64% (32 out of 50) of Group 1 and 78% (21 out of 27) of Group 2 cholestatic drugs were excreted extensively into bile (≥70%). However, the classification of cholestatic
20
Relationship between Mechanism of Cholestasis and Inhibition of Bile Acid Transport Proteins by Drugs
Inhibition of bile acid transport is one important mechanism of drug-induced cholestasis. Thus, the relationship between the mechanism of cholestasis and the ability of drugs to inhibit bile acid transport was investigated. BSEP is a major transport protein responsible for the biliary excretion of bile acids. Inhibition data for BSEP is relatively abundant compared to inhibition of other bile acid transport proteins based on recent publications describing high-throughput screening approaches to analyze for BSEP inhibition (59, 60, 121). Information about BSEP inhibition was available for 41 cholestatic drugs (Table 1.1). Drugs with IC50 values less than 133 µM were defined as BSEP inhibitors as reported previously (59). Chi-square analysis revealed that BSEP inhibitors are more abundant in Group 1 compared to Group 2 cholestatic drugs (61% vs 20%, p=0.023; Table 1.2); among the 31 Group 1 cholestatic drugs, 19 drugs (61%) were BSEP inhibitors. On the other hand, only 2 out of 10 Group 2 cholestatic drugs were BSEP inhibitors. Although this analysis was performed with only a limited number of drugs, the data suggest that BSEP inhibition might not play a major role in cholestasis that is caused by bile duct obstruction. Inhibition data for other bile acid transporters such as ASBT, NTCP, OATP and MRP4, as well as substrate information on major drug transporters such as OATP, MRP2, BCRP, and P-gp, might be necessary to understand the complex interplay of bile acid homeostasis, the pharmacokinetic behavior of drugs, and direct and indirect regulation of the pathogenesis of different types of cholestasis.
IN SILICO MODELING TO PREDICT DIRECT AND INDIRECT EFFECTS OF DRUGS ON BILE ACID HOMEOSTASIS
21
effects on nuclear receptors involved in bile acid homeostasis are even more scarce because the role of nuclear receptors in bile acid homeostasis has been revealed only recently (123, 124). In silico modeling can be used to fill this data gap; existing datasets can be used to build in silico models based on the structural properties of drugs, and these models can be used to predict drug effects on bile acid
homeostasis. When large datasets are available and resulting in silico models are well-validated, they can help reduce the financial burden in early drug discovery and development by limiting the need for
extensive laboratory experiments. In the following section, in silico models to predict drug effects on bile acid transporters and nuclear receptors such as PXR and FXR are reviewed.
In Silico Modeling to Predict Drug Interactions with Bile Acid Transport Proteins
The 3D structures of membrane transport proteins remain scarce. Thus, current computational transporter studies rely on a series of experimentally measured interactions of small molecules with membrane transporters and employ statistical learning approaches, such as quantitative structure-activity relationship (QSAR) and ligand-based pharmacophore construction. Available computational models of bile acid transporters (i.e., MRP2, MRP3, MRP4, BSEP, NTCP, ASBT, OATPs) are summarized in Table 1.3. Due to the great heterogeneity of experimental reports (e.g., from diverse assay types, test
concentrations and experimental conditions), most of the computational studies present classification models (e.g., inhibitors vs. non-inhibitors). The few available quantitative models (such as for binding affinity or inhibition) usually are limited to small sets of compounds with the measurements from the same source.
For the canalicular efflux transporters BSEP and MRP2 (Table 1.3), Warner et al. reported
classification of BSEP inhibitors (defined by an IC50 threshold of 300M) by a recursive partitioning
QSAR for over 600 chemicals using molecular descriptors as covariates (121). An earlier study by Saito et al. reported a multiple linear regression model of BSEP inhibition (measured in % of taurocholate transport at 100M test concentration) for 37 diverse drug-like compounds using chemical fragment
22
for MRP2 inhibition at various potency thresholds (Table 1.3) using linear (e.g., PLS – partial least squares regression and discriminant analysis) and non-linear modeling methods (SVM – Support Vector Machine, kNN – k Nearest Neighbors, RF – Random Forest) (126-128). The accuracy of these models on external data (judged by test sets) ranged from 70 to 90%. In addition, Ng et al. developed a QSAR model of binding affinity to rat Mrp2 for 25 methotrexate analogues as well as a pharmacophore for their
binding model (129). Zhang et al. have constructed a pharmacophore for MRP2 inhibitors, which performed slightly worse than their SVM QSAR model (127).
Due to lack of experimental measurements, very few computational studies exist for the
basolateral bile acid efflux transporters MRP3 and MRP4 (Table 1.3). Sedykh et al. reported classification models of MRP4 inhibitors at a 10M threshold with external accuracy of 70%, however, the modeling
was based on a rather small set of 64 molecules (128). In a recent study, Akanuma et al. attempted structural analysis of MRP4 transport for several groups of -lactam antibiotics (130).
For the bile acid uptake transporters, there were appreciably more studies on ASBT and OATPs than on NTCP (Table 1.3), which reflects the importance of the former to the absorption, distribution, metabolism, excretion and toxicity of pharmaceuticals because they also are expressed in gut and kidney (131). Karlgren et al. reported classification models of OATP1B1, OATP1B3, and OATP2B1inhibitors at a 20M potency threshold, with expected accuracy of 75-93% (132). Several QSAR models of ASBT
binding affinity as well as pharmacophores were developed by Zheng et al., Rais et al., and Gonzalez et al. with squared correlation coefficient (R2) values of 0.68-0.89, albeit all were trained on small
congeneric series of conjugated bile acid derivatives (133-137). Sedykh et al. and Zheng et al. reported classification QSARs of ASBT inhibitors based on 10M and 100M potency thresholds respectively
23
Based on the data presented in Table 1.3, the small size of the modeling data sets is the major limitation to accurate in silico prediction of drug interactions with bile acid transporters. Conformational flexibility of membrane transporters, their broad substrate specificity, as well as noisiness and limitations of experimental assays all require large and diverse sets of chemical structures for proper statistical learning. Large and diverse modeling sets also are necessary for the broad applicability of the resulting models, so that more structural classes of chemicals can be covered and reliably predicted. Presently, there are too few compounds with experimental data available for MRP3, MRP4 and NTCP transporters. Even though OSTα/β is essential for bile acid transport, adequate data for in silico modeling is not yet available (27).
In Silico Models of Drug Interactions with the Nuclear Receptors, FXR and PXR
A number of the resolved 3D protein structures of FXR and PXR are publicly available (e.g., 1OSH, 1OSV for FXR, 3R8D, 2QNV for PXR at www.pdb.org), which allows for application of modeling techniques such as docking and structure-based pharmacophore construction. However, accurate characterization of a drug-protein interaction by structure-based methods can be difficult, which is the case for PXR with its large and flexible pocket leading to promiscuous binding and poor docking results (139, 140). Therefore, statistical knowledge-inference methods, such as QSAR, are still applied widely. Currently available computational models of FXR and PXR are reviewed in Table 1.4. Although stand-alone docking yielded modest results (~60% accuracy), as demonstrated by Khandelwal et al., Kortagere et al., and Ekins et al., docking was used routinely to impute bound conformations of chemicals for the subsequent 3D-QSAR modeling studies (139, 141-144). Most of the classification models of PXR agonists have external accuracy in the 70-85% range (Table 1.4). A few quantitative models for the potency of PXR activation (measured as EC50) also have been reported (139, 145), although it is important to note that these do not take into account the extent of activation (i.e., efficacy), which can vary substantially among the agonists.
24
correlations in the 0.76-0.93 range (square of Pearson’s correlation coefficient), albeit on rather small data sets. Recent studies by Shuster and Grinke employed a set of pharmacophores for classification of FXR agonists with accuracy of ~70% (146, 147). While diverse models for PXR activation currently are available (e.g., see the recent review by Kortagere et al.(140)) and further improvements are likely to be incremental, in the case of FXR, new models based on larger data samples definitely are needed for reliable use in drug design and risk assessment.
CONCLUSIONS AND FUTURE DIRECTIONS
Disruption of bile acid homeostasis is an important mechanism of drug-induced cholestasis. In order to accurately predict the cholestatic potential of drugs, an understanding of the molecule’s effects on the many processes involved in bile acid homeostasis appears to be necessary. In silico modeling, which
will diminish the time and resources required for laboratory experiments, is a promising approach to
obtain this mechanistic information. Drugs may inhibit bile acid transporters directly, or alter the
expression, function and/or localization of transporters by indirect interactions mediated by nuclear
receptors and intracellular signaling pathways. In addition, patient-specific factors including genetic polymorphisms, underlying disease, and pregnancy may alter the function of bile acid transporters and predispose individuals to cholestasis. These data can be integrated and incorporated into mechanistic, mathematical models to improve predictions. Multi-scale modeling approaches incorporating both drug
disposition and physiological processes (i.e. systems biology) is an exciting, emerging area. Recent
efforts using mechanistic, mathematical modeling approaches have successfully predicted the
hepatotoxicity induced by drugs such as acetaminophen and methapyrilene (148, 149). The same
approach can be taken to predict drug-induced cholestatic injury, thereby allowing more accurate
25
Table 1.1. Physicochemical and pharmacokinetic properties of drugs with different mechanisms of cholestasis.
Drug MW logP
a
logSa PPBa (%)
Cmaxb (µg/ml)
Cmax,uc (uM) Std Daily Dosed,e (mg /day) Max Daily Dosed (mg/ day) Meta-bolismf Renal Excre-tionf Fecal/ biliary Excre-tionf BDD -CSg BSEP Inhibi -tionh
IC50 for BSEP Inhibition (µM)
Group 1: Impaired Formation of Bile (n=50)
6-Mercapto-purine 152.2 -0.4 -1.3 19.0 0.073 0.39 225 350 H I L 2 - -
Acitretin 326.5 6.4 -6.7 99.0 0.42 0.013 37.5 75 I I I 2 Y 18(60)
Atorvastatin 540.7 5.7 -7.4 98.5 0.019 0.0005
3 45 80 H L H 2 - -
Azithromycin 749.1 4.0 -1.3 28.5 0.40 0.38 875 1500 I L H 3 N >1000
(121)
Bupropion 239.8 3.6 -2.9 84.0 0.14 0.093 300 450 H H L 1 N >1000
(121)
Captopril 217.3 0.3 -0.1 27.5 0.93 3.1 234 450 I H L 3 - -
Celecoxib 381.4 3.9 -4.9 97.0 1.2 0.091 400 600 H I I 2 - -
Cephalexin 347.4 -0.7 -1.5 12.5 32 81 2500 4000 L H L 3 - -
Cetirizine 388.9 1.7 -3.6 93.0 0.31 0.056 7.5 10 L H L 3 - -
Chlorambucil 304.2 3.3 -1.4 99.0 492 16 15.0 28 H I L 1 - -
Clarithro-mycin 748.1 3.2 -2.6 50.5 3.7 2.4 1000 1500 H I L 3 Y <13(121)
Cyclosporine 1203 3.0 -5.2 93.7 0.93 0.049 525 1260 H L H 2 Y
0.3-10 (59, 60, 121, 150-152)
Danazol 337.5 0.5 -5.6 96.2* 0.025 0.0028 450 800 H L I 2 Y <10 (121)
Dapsone 248.3 1.0 -3.1 75.3 0.93 0.93 175 300 H H L 2 N >1000
(60, 121)
Dextro-methorphan 271.4 3.6 -1.3 74.8
* 0.0077 0.0071 120 180 H H L 1 - -
Dicloxacillin 470.4 2.9 -5.1 96.9 91 6.0 1750 2000 L I I 3 Y <10(121),
26
Fenofibrate 360.9 5.3 -5.7 99.0 4.4 0.12 100 160 I I L 2 Y 15(59)
Fosinopril 563.7 6.3 -4.4 94.4 0.37 0.037 22.5 40 I I I 2 Y <13(121)
Gabapentin 171.3 -1.1 -1.2 1.5 2.5 14 2700 3600 L H L 3 N >1000
(121)
Gemcitabine 263.2 -1.4 -1.2 6.4 7.0 25 1912.5 2125 H H L 1 - -
Glimepiride 490.7 3.5 -5.6 99.5 0.55 0.0056 4.5 8 I I I 2 Y <10(121),
16(59)
Griseofulvin 352.8 2.2 -4.6 83.8* 1.6 0.73 540 750 H I I 2 - -
Hydrochloro-thiazides 297.8 -0.1 -2.7 67.9 0.49 0.53 56.25 100 L H L 3 - -
Isoniazid 137.2 -0.8 0.0 5.0 11 73 300 300 H H L 1 N >1000
(60, 121)
Itraconazole 705.7 5.7 -8.9 99.0 2.0 0.028 450 800 H I L 2 Y 18(59)
Ketoconazole 531.5 4.4 -4.9 99.0 3.5 0.066 700 1200 I L I 2 Y
2.9-65 (59, 60, 121, 153)
Loracarbef 349.8 0.5 -0.9 25.0 13 27 500 800 L H L 3 - -
Mesalamine 153.2 1.2 -2.2 43.0 5.0 19 3600 4800 H L H 2 N 381(121)
Metformin 129.2 -0.5 0.0 2.5 1.0 7.5 1250 2550 L H L 3 N >1000
(121)
Methimazole 114.2 -0.3 0.4 0.0 0.21 1.9 37.5 60 H H L 1 N >1000
(60, 121)
Methyldopa 211.2 0.4 -1.3 20.0 3.1 12 1750 3000 I H L 3 N >1000
(60)
Metolazone 365.9 2.5 -3.8 95.0 22 3.1 10.25 20 L H L 4 - -
Nevirapine 266.3 1.8 -3.4 60.0 2.3 3.4 300 400 H H L 2 N 295(121)
Nifedipine 346.4 2.2 -4.8 96.0 0.094 0.011 45 180 H H L 2 Y
19-40 (60, 121, 154)
Nitro-furantoin 238.2 -0.1 -3.1 60.0 0.50 0.84 300 400 I I L 4 N
>1000 (60, 121)
Norfloxacin 319.4 -1.0 -2.6 12.5 2.4 6.6 800 800 L I L 4 - -
Ofloxacin 361.4 -0.4 -2.0 22.5 2.8 5.9 700 800 L H L 3 N >1000
27
Orlistat 495.8 8.6
-10.2* 99.0 0.10 0.0020 270 360 L L H 4 - -
Oxacillin 401.5 2.4 -4.5 92.0 43 8.6 6750 12000 I H L 3 - -
Propafenone 341.5 3.2 -3.6 96.0 0.0002 8
0.0000
32 675 900 H I I 2 Y 54(121)
Propyl-thiouracil 170.3 0.4 -2.2 80.0 6.5 7.6 500 900 H I L 1 - -
Repaglinide 452.7 5.9 -5.9* 98.0 0.051 0.0023 8.5 16 H L H 2 - -
Risperidone 410.5 3.0 -3.2 89.0 0.033 0.0088 8.5 16 H H L 1 Y <10(121)
Rofecoxib 314.4 3.2 -3.5 87.0 0.32 0.13 31.25 50 H H L 2 Y 95(121)
Rosiglitazone 357.5 2.4 -4.0 99.8 0.37 0.0021 4 8 I I L 1 Y
4.4-6.4 (56, 57, 118)
Roxithro-mycin 837.2 2.8 -3.9 86.0 12 2.0 387.5 600 I L I 4 - -
Tamoxifen 371.6 7.1 -6.3 99.0 0.060 0.0016 30 40 H L I 1 Y
10-23 (121, 150, 153)
Ticlopidine 263.8 2.9 0.0 98.0 2.1 0.16 500 500 I I L 1 Y 27-74 (60,
121)
Troglitazone 441.6 3.6 -5.9* 99.0 2.8 0.064 400 600 H L H 4 Y
4-66 (121, 153, 154)
Warfarin 308.4 2.6 -4.2 99.5 1.5 0.026 6 10 H H L 2 Y 115(121)
Group 2: Obstruction of Bile Flow (n=27)
Ajmaline 326.5 1.8 -2.8 46.0 1.5 2.4 42.5 50 H L H 1.5 - -
Allopurinol 136.1 -0.6 -2.4 0.5 1.9 14 450 800 H H L 2 - -
Amineptine 337.5 5.1* -4.7* 95.3* 0.77 0.11 150 200 - H L - - -
Amitriptyline 277.4 4.9 -4.5 94.8 0.029 0.0054 187.5 300 H I L 1 - -
Ampicillin 349.5 1.4 -1.7 24.0 107 232 6500 12000 L H L 3 - -
Carmustine 214.1 1.5 -1.8 80.0 1.7 1.6 297.5 340 I I L 1 N.D.
28
Chloro-thiazide 295.8 -0.2 -2.8 50.0 0.50 0.85 750 1000 L H L 4 - -
Cimetidine 252.4 0.4 -1.6 17.5 1.1 3.7 800 1600 I I L 3 N >1000
(121, 153)
Ciprofloxacin 331.4 0.3 -3.3 30.0 3.8 8.0 1000 1500 I H L 4 N >1000
(121)
Clindamycin 425.1 2.2 -1.1 93.0 4.5 0.73 1600 2600 H L H 1 - -
Cromolyn 468.4 1.9 -0.4 69.5 0.0092 0.0060 440 800 L L H 3 N >1000
(57, 118)
Cypro-heptadine 287.4 4.7 -1.9 90.1
* 30 10 12 20 H I I 1 - -
Diazepam 284.8 2.8 -3.7 96.8 0.17 0.019 22 40 H H L 1 - -
D-penicillamine 149.2 -1.8 -0.1 80.6 5.6 7.3 187.5 4000 L H L 3 N
>1000 (60)
Floxuridine 246.2 -1.4 -1.3 7.7* 3.3 12 24.5 42 H L L - - -
Haloperidol 375.9 4.3 -4.0 92.0 0.020 0.0043 1.25 15 H H L 2 Y 23(121)
Ibuprofen 206.3 4.0 -3.7 99.0 57 2.8 1000 3200 H H L 2 N
>790 (121, 154), 599(60)
Imipramine 280.5 4.8 -4.2 92.0 0.025 0.0070 162.5 300 H H L 1 - -
Methyl-testosterone 302.5 3.5
* -4.8* 98.0 0.032 0.0021 30 50 H H L 2 - -
Phenyl-butazone 308.4 3.2 -2.6 98.5 150 7.3 450 600 I I L 1 - -
Phenytoin 252.3 2.5 -4.1 90.0* 5.5 2.2 450 600 H L H 2 - -
Prochlor-perazine 374.0 4.9 -3.6 95.2
* 0.0040 0.0005
1 27.5 40 H L H 1 Y <10(121)
Tenoxicam 337.4 1.9 -2.6 98.5 2.0 0.089 30 40 I I L 1 - -
Tetracycline 444.5 -1.3 -2.4 65.0 9.3 7.3 1125 2000 L I L 3 N >1000
(121)
Thiaben-dazole 201.3 2.5 -3.6 74.6
* 5.0 6.3 3000 3000 H H L 2 N 560(121)
Tolbutamide 270.4 2.3 -3.4 96.0 100 14.8 1125 3000 H H L 2 N >1000
29
Troleando-mycin 814.1 4.2
* -5.7* 61.6* 2.0 0.94 1500 2000 - I L - - -
Group 3: Mixed Cholestasis (n=11)
Azathioprine 277.3 0.1 -1.4 30.0 1.0 2.5 192.5 350 H H L 1 N >1000
(57, 118)
Carbama-zapine 236.3 2.5 -3.0 74.0 12 13 1000 1600 H H L 2 N
>1000 (121)
Chlor-promazine 318.9 5.4 -5.0 97.5 0.30 0.024 400 2000 H I L 1 N.D.
31-91 (121, 153), 148(60)
Chlor-propamide 276.8 1.9 -2.1 92.0 150 43 300 750 L H L 0 N
>1000 (57, 118)
Erythromycin 734.1 3.1 -2.5 60.0 1.3 0.72 1000 1000 L L H 3 N.D.
>983 (121), 4.1-13 (59, 60) Estradiol 272.4 4.0 -3.5 93.5* 0.0000
43
0.0000
1 15.5 30 H H L 1 - -
Flucloxacillin 453.9 2.6 -5.8* 94.0 8.0 1.1 3500 6000 L H L 4 N.D. <10(121), 209(60)
Glyburide 494.1 4.7 -5.1 99.0 0.22 0.0045 10.6 20 H I I 2 Y
5.3-60 (57, 118, 152-154)
Pioglitazone 356.5 2.3 -4.6* 99.0 1.1 0.029 22.5 45 H L H 2 Y 0.3 (56,
57, 118)
Propoxy-phene 339.5 4.2 -4.3 78.0 0.085 0.055 325 390 H L H 2 - -
Terbinafine 291.5 6.0 -6.4* 99.0 1.0 0.034 625 1000 H H L 2 - -
MW, molecular weight; PPB, plasma protein binding; BDDCS, biopharmaceutics drug disposition classification system;
aObtained from Dragon Ver.5.5, measured data if not stated otherwise (*calculated).
bRetrieved from Thompson’s Micromedex DRUGDEX index and Lexicomp database if not stated otherwise.
cCalculated using C
max, MW, and PPB.
dRetrieved from Thompson’s Micromedex DRUGDEX index and Lexicomp database. Administered orally if not stated otherwise.
30
fThe extent of metabolism, renal excretion, and fecal/biliary excretion. H, High (≥70%); I, Intermediate ( ≥30% and <70%); L, Low (<30%). Retrieved from Thompson’s Micromedex DRUGDEX index and Lexicomp database if not stated otherwise.
gClass 1, high solubility/extensive metabolism; class 2, low solubility/extensive metabolism; class 3, high solubility/poor metabolism; class 4, low solubility/poor metabolism.
hDrugs with IC
50 < 133 µM are defined as BSEP inhibitors.(59)
iN.D: Inhibitory effects of chlorpromazine, erythromycin, flucloxacillin, and carmustin were not determined because reported IC
31
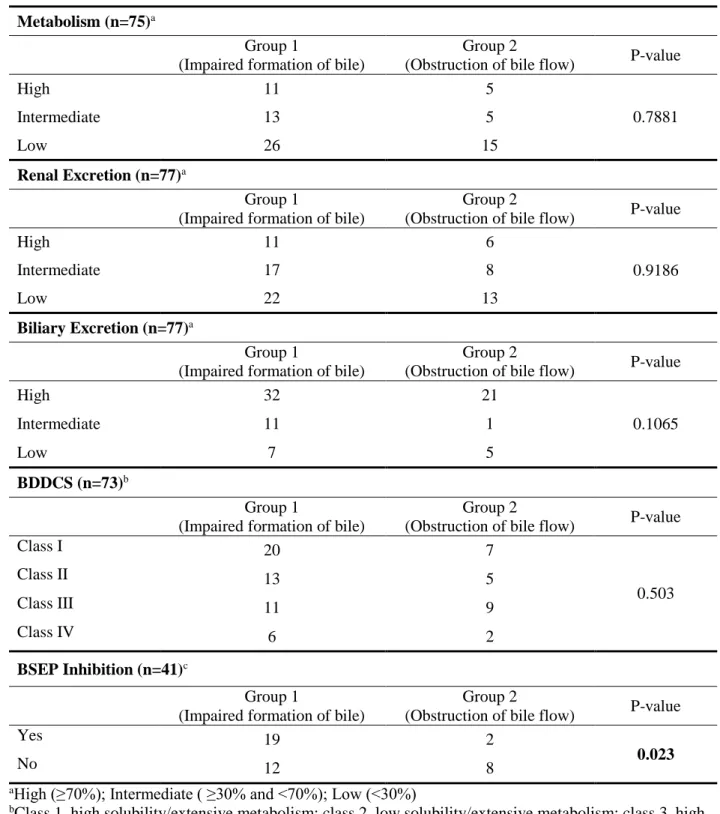
Table 1.2. Relationship between mechanism of cholestasis (impaired formation of bile and
obstruction of bile flow) and the extent of metabolism and excretion, BDDCS, and BSEP inhibition for 77 cholestatic compounds.
Drugs with no information were excluded from the analysis. P-values from chi-square tests are presented.
Metabolism (n=75)a
Group 1
(Impaired formation of bile)
Group 2
(Obstruction of bile flow) P-value
High 11 5
0.7881
Intermediate 13 5
Low 26 15
Renal Excretion (n=77)a
Group 1
(Impaired formation of bile)
Group 2
(Obstruction of bile flow) P-value
High 11 6
0.9186
Intermediate 17 8
Low 22 13
Biliary Excretion (n=77)a
Group 1
(Impaired formation of bile)
Group 2
(Obstruction of bile flow) P-value
High 32 21
0.1065
Intermediate 11 1
Low 7 5
BDDCS (n=73)b
Group 1
(Impaired formation of bile)
Group 2
(Obstruction of bile flow) P-value
Class I 20 7
0.503
Class II 13 5
Class III 11 9
Class IV 6 2
BSEP Inhibition (n=41)c
Group 1
(Impaired formation of bile)
Group 2
(Obstruction of bile flow) P-value
Yes 19 2
0.023
No 12 8
aHigh (≥70%); Intermediate ( ≥30% and <70%); Low (<30%)
bClass 1, high solubility/extensive metabolism; class 2, low solubility/extensive metabolism; class 3, high solubility/poor metabolism; class 4, low solubility/poor metabolism.
cDrugs with IC