EFFECT OF PROTECTIVE HELMETS ON VISUAL AND SENSORY PERFORMANCE
By
Michelle Rebecca Kramer
Senior Honors Thesis Exercise and Sport Science
University of North Carolina at Chapel Hill
April 11, 2016
ABSTRACT
MICHELLE REBECCA KRAMER: Effect of Protective Helmets on Visual and Sensory Performance
(Under the direction of Jason P. Mihalik)
Current helmet testing does not consider implications on ability to see and respond,
which is key to reducing injury risk. The purpose was to determine the effect of athletic headgear
(i.e., football, lacrosse, and ice hockey helmets) on visual and sensory performance, as measured
by scores on the Senaptec Sensory Station. Subjects were assessed on visual clarity, contrast
sensitivity, depth perception, near-far quickness, target capture, perception span, multiple object
tracking, eye-hand coordination, go/no go, and hand reaction time via the computer based system
under helmeted and unhelmeted conditions. Participants performed significantly worse on
eye-hand coordination (p=0.01) and go/no go (p<0.01) assessments when wearing a helmet. Hockey
helmets significantly affected visual clarity (p=0.01) and hand reaction time (p<0.01), but
football and lacrosse helmets did not. Visual training with helmets should be considered to try to
TABLE OF CONTENTS
LIST OF TABLES ... v
LIST OF FIGURES ... vi
CHAPTER 1 ... 1
Research Questions ... 2
Significance of the Study ... 3
CHAPTER 2 ... 4
Visual and Sensory Performance ... 4
Visual Advantage in Sport ... 10
Anticipation in Sport ... 12
Headgear Use ... 14
CHAPTER 3 ... 17
Participants ... 17
Instrumentation and Tests ... 18
Senaptec Sensory Station ... 18
Procedures ... 22
Statistical Analyses ... 23
Methodological Considerations ... 23
CHAPTER IV ... 25
Introduction ... 25
Methods ... 26
Participants ... 26
Procedure ... 28
Data Reduction ... 28
Data Analysis ... 29
Results ... 29
Discussion ... 31
References ... 35
LIST OF TABLES
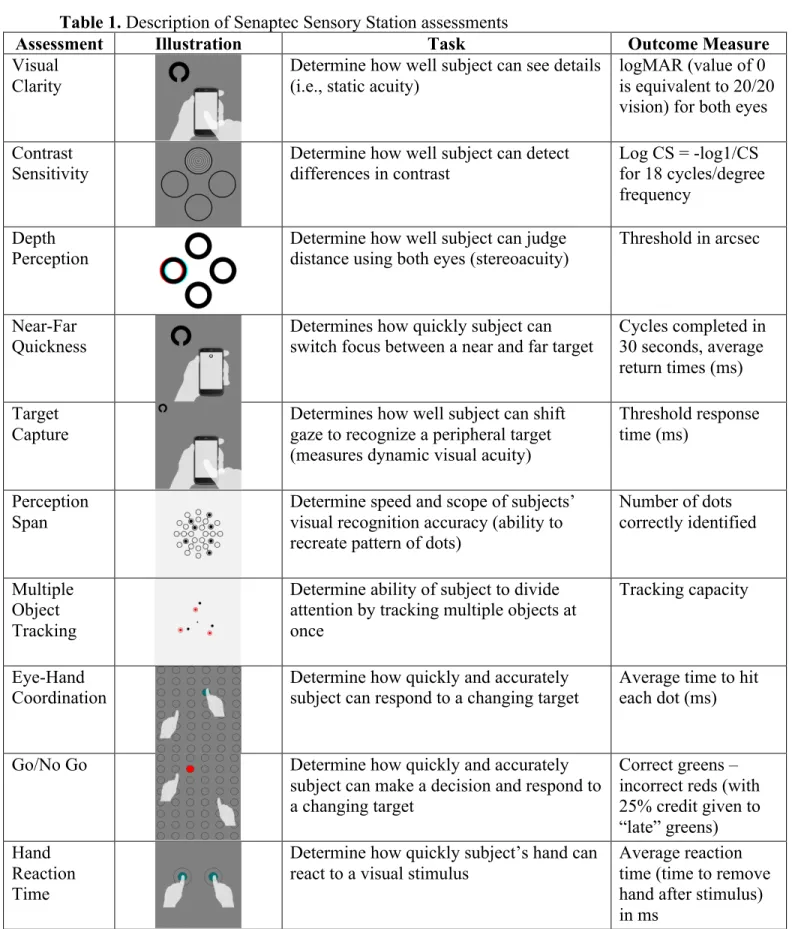
Table 1. Description of Senaptec Sensory Station assessments ... 41
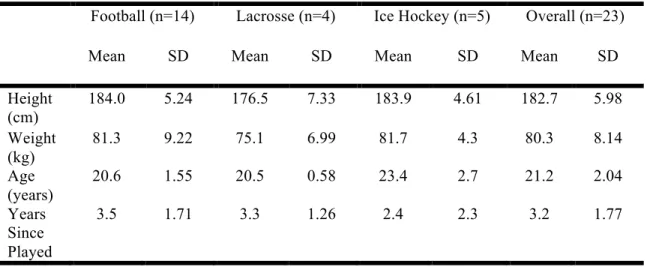
Table 2. Demographic information ... 43
Table 3. Visual performance by helmet condition – unadjusted values ... 44
LIST OF FIGURES
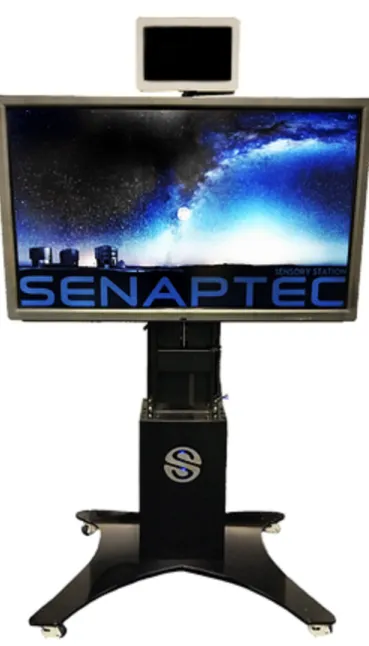
Figure 1. Senaptec Sensory Station ... 42
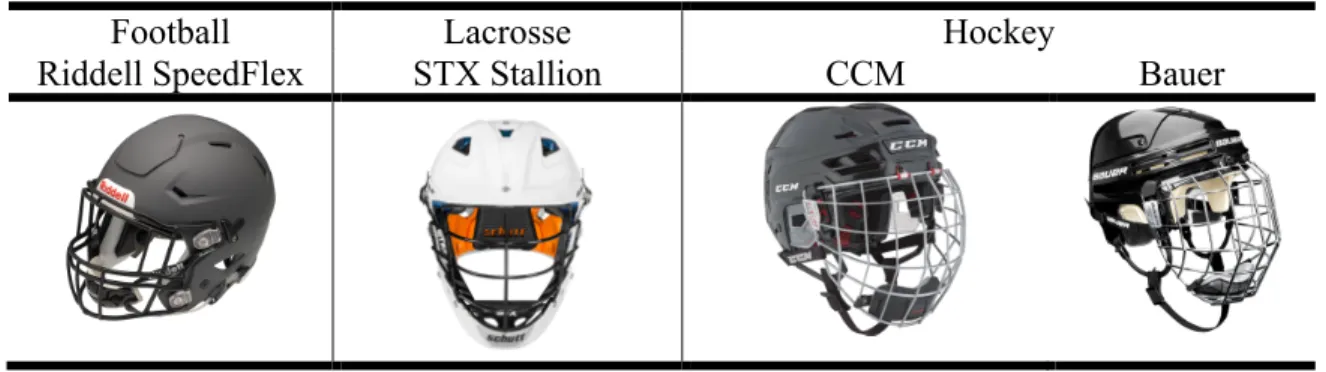
Figure 2. Helmet types employed in this study ... 46
CHAPTER 1
INTRODUCTION
Sport-related concussions are garnering an increased amount of attention, both in
research developments and the public eye. The widespread interest in concussions is not
surprising, as they are an extensive medical concern. It is estimated that 1.6 to 3.8 million sport
and recreation-related traumatic brain injuries are sustained by Americans each year.1 Moreover,
concussions are creating a financial burden, with costs exceeding $60 billion nationally and $118
million in North Carolina alone.2 Concussions are particularly common in direct contact sports,
with the highest incidence rates seen in football, lacrosse, and ice hockey.3–6 While helmets are
instrumental in these sports for preventing skull fractures, facial fractures, and brain bleeds, they
do not play a role in the prevention of concussions.7
Vision is an important factor to consider in relation to sport concussion. Sharp visual
ability, especially heightened periphery, is key to an athlete’s ability to anticipate an impending
collision and capacity to properly position themselves to reduce the force imparted to the head or
move to avoid the collision.8,9 When an athlete does not anticipate a hit, their head tends to be the
first point of contact in the collision and the forces imparted are more severe.10 Visual
performance is also key to sport in general, as advanced ability to identify and react to peripheral
stimuli, quickly shift gaze, and track objects while in motion all contribute to superior athletic
performance. Enhanced skills of visual reaction time, visual memory, and visual discrimination
hockey.11 Elite athletes want to optimize their visual abilities, and even go through training to do
so.12
The focus of helmet safety testing is on reducing forces to the head to minimize injury,13
and thus does not strongly consider how potential barriers to vision may influence ability to
respond to stimuli in sport settings. The design of certain helmets may pose a hindrance to users’
vision,14 which can be a detriment to both sport performance and safety. To date, no known
testing has been performed to determine the implications of football, lacrosse, or ice hockey
helmets on user vision. A more comprehensive analysis of the impact of helmet use on the visual
and sensory performance of athletes is necessary to further the conversations surrounding
optimal helmet designs, improving visual training strategies, and how to ensure athlete safety.
Therefore, the purpose of this thesis was to compare visual and sensory performance of
football, lacrosse, and ice hockey players under helmeted and unhelmeted conditions. Data was
collected utilizing the Senaptec Sensory Station and included assessments of visual clarity,
contrast sensitivity, depth perception, near far quickness, target capture, perception span,
multiple object tracking, eye hand coordination, go/no go, and hand reaction time. Participants
completed the assessment twice, once helmeted and once unhelmeted, and performance between
the two assessments was compared; the order of the helmeted or unhelmeted condition was
counterbalanced. It was hypothesized that visual and sensory performance would be worse in the
helmeted condition compared to the unhelmeted condition.
Research Questions
Research Question 1: Is there an effect of helmet use (helmeted vs. unhelmeted) on vision and
Hypothesis 1: There will be a significant difference between performance on the Senaptec
Sensory Station under helmeted and unhelmeted conditions, in which performance will
be worse when participants are outfitted with a helmet.
Research Question 2: Is there an effect of helmet type by sport (football vs. lacrosse vs. ice
hockey) on visual and sensory performance as measured by the Senaptec Sensory Station?
Hypothesis 2: The effect of helmets on visual and sensory performance as measured by
the Senaptec Sensory Station will be consistent across football, lacrosse, and ice hockey
helmets.
Significance of the Study
Regardless of the outcome, the results of this study will significantly contribute to the
discussion regarding helmet design and safety. If differences in vision are found under the
helmeted condition, it will bring attention to the possible implications of helmet design on athlete
performance and safety. Additionally, it should prompt discussion about the importance of
incorporating vision considerations into helmet safety testing and how to maximize visual
training strategies. If significant differences in vision are not found under the helmeted condition,
it will provide support for the current design of helmets with regards to visual performance. The
study results could be used to augment arguments for the importance of helmet use in contact
CHAPTER 2
LITERATURE REVIEW
This literature review examines the current information regarding visual and sensory
performance. Specifically, the importance of visual and sensory performance within the realm of
sport will be explored. There is growing attention being placed on the importance of peripheral
vision and anticipation with regards to sport performance and sport safety, but other aspects of
vision are relevant as well. Helmet use may also have an impact on visual and sensory
performance, but the current literature is inconclusive.
Visual and Sensory Performance
A large amount of the literature pertaining to visual and sensory performance focuses on
saccades, convergence, and accommodation. Assessments of these visual measures evince
marked deficits in performance in the presence of neurological abnormalities or head trauma, and
are useful in providing insight to higher cognitive function, such as attention and memory.15
Specifically with regards to saccades, tests of antisaccades have been used to assess executive
function when standard neuropsychological testing is not possible.16 Cognitive control of vision
is largely regulated by the frontoparietal circuits and subcortical nuclei, but there are many other
components involved such as cerebro-brainstem-cerebellar pathways and connections with
vestibular nuclei.15
Saccades are rapid eye movements, and they occur when switching focus between fixed
objects. They are regulated by widely distributed brain pathways in the “frontal eye fields,
structures including the brainstem.”17 The oculomotor thalamus also plays a role in the regulation
of these eye movements.18 It acts like a controller to monitor eye movements and regulate
self-paced saccades.18 Saccades can be evaluated in the horizontal, vertical, or diagonal direction.
Saccades are commonly assessed with the King-Devick test, which involves reading numbers off
of a card as quickly as possible without making errors.19 If no such equipment is available,
self-paced saccades can also be assessed by fixating two target points and having the subject shift
their gaze between the two targets as quickly and accurately as they can.20
Convergence and accommodation are frequently used to assess binocular and monocular
vision, as they work together to produce focused sight.21 These two components are closely
related. Convergence, a binocular cue, assesses one’s ability to move their eyes inward to focus
on a close object.22 Accommodation, a monocular cue, is the ability to focus on a close object
with one eye.23,24 When assessing convergence, an individual’s break point and recovery point
are measured. A target is moved towards the subject’s eyes until they can no longer focus on it
with both eyes. The point at which one of the eyes deviates from the target is the break point, and
the subject begins seeing with double vision. The target is then moved away from the subject
until the double image returns to a single image, which marks the recovery point.25 Normative
values for Near Point Convergence vary, with some reports of a standard Near Point
Convergence break being between 5 and 10 cm15 and others saying the mean break point for an
adult should be around 2.5 cm with a recovery point around 4.4 cm.26 Convergence assessments
utilizing a small pen light may produce lower mean break point values than those utilizing a
small letter as the target, and break point values for children are usually lower (better) than for
adults.26,27 Accommodation is assessed in a similar way, but focuses on each eye individually.
with one eye and indicate when it becomes blurry.24 Though also important as stand-alone
assessments, measures of accommodation and convergence are incorporated into more
applicable visual assessments, as they contribute to abilities such as visual acuity.21
With regards to sport, there is additional attention placed on peripheral vision. Peripheral
vision consists of the content of a visual image outside of the center of gaze. It is a topic of focus
in sport because it is used to scan the surrounding environment, influencing our eye and head
movements, quick actions, and defensive reactions,28 all of which are crucial to athletic
performance and anticipation for safety. While foveal vision is more geared towards resolving
fine detail in a stationary image, peripheral vision is designed to detect changes in the field of
vision.29 The circuits associated with peripheral vision are different from those involved with
foveal vision. For example, an individual reaching for a target in their foveal vision would have
activation in the medial intraparietal sulcus and dorsal premotor cortex, whereas an individual
reaching for a peripheral target would experience more extensive neural activation, including the
parieto-occipital junction.30,31
While many visual domains have traditionally been measured using hands-on techniques,
computer-based systems have also been developed. They measure a variety of sensory abilities to
give a comprehensive evaluation, including visual clarity, contrast sensitivity, depth perception
near-far quickness, target capture, perception span, eye-hand coordination, go/no go, and hand
reaction time.32,33 Newer models of computer-based systems also include an assessment for
multiple object tracking. These computer-based systems assess measures of visual sensitivity
thresholds (i.e., visual clarity, contrast sensitivity, depth perception, and target capture) as well as
visual-attention and visual-motor abilities (i.e., near-far quickness, perception span, multiple
previously described visual skills of saccades, convergence, accommodation, and peripheral
vision, while taking it a step further to provide more functional assessments of vision.33
The first domain that these computer-based systems measure is visual clarity, or how well
an individual can resolve detail in a static image. Traditionally, static visual clarity is measured
with a Snellen chart. Visual clarity is closely related to multiple other visual measures, including
dynamic visual acuity, contrast sensitivity, and target capture.34 To measure static acuity, you
work to determine the smallest non-moving target that an individual can accurately resolve. Tests
often start at the equivalent of 20/50 Snellen acuity and then progress in a stair wise progression
until the smallest target correctly resolved is determined. Both monocular and binocular static
acuity is typically measured. Normal visual acuity is considered 20/20 vision or the equivalent.33
Another domain measured in the computer-based systems, contrast sensitivity, is how
well one can see and process objects and their backgrounds in various lighting conditions. In
clinical settings, contrast sensitivity has traditionally been measured using the Pelli-Robson test.
This test consists of a chart measuring 90 x 60 cm that contains 8 lines of 6 letters. The letters are
consistent in size but decrease in contrast from 1 to 0.006 contrast. Scores are typically reported
as logarithmic contrast sensitivity (1/contrast) Assessments of contrast sensitivity are done
monocularly and binocularly. Average scores range from 1.68 to 1.84 when using one eye and
from 1.73 to 1.99 when using both. These variations are largely due to age, where older groups
have worse contrast sensitivity (higher logarithmic values).35
Depth perception, or stereopsis, consists of determining the distance of an object using
binocular cues.32 While commonly measured in computer-based systems, stereoacuity can also
be measured using the Frisby-Davis (FD2) distance stereotest. Four shapes are placed on rods in
from the box; the subject must identify which shape is closer.36 Stereoacuity may also be
measured with the Distance Randot Stereotest, which is commonly used for testing young
children. The Distance Randot Stereotest consists of a Polaroid vectographic book in which there
are 2 geometric shapes presented at disparities of 400, 200, 100, and 60 arcsec. Subjects
complete the assessment at a distance of 3 meters from the book and while wearing polarizing
glasses. Beginning with the 400 arcsec level, every time a shape is correctly identified, the
disparity decreases until they can no longer correctly identify the shape. In general, performance
improves as children age. Children ages 2-3 have a mean stereoacuity of 200 arcsec, which
improves to a mean stereoacuity of 60 arcsec in 6 to 20 year olds. In adulthood, stereoacuity
worsens with age, with a mean stereoacuity of 100 arcsec seen in those ages 21 to 40.37
Near-far quickness, a measure closely related to depth perception, is also commonly
measured in computer-based systems. Near-far quickness is a measure of a subject’s ability to
quickly shift their focus between a near and far target and is controlled by a rapid
accommodative-vergence response.32 Besides computer based-systems, near-far quickness can
also be assessed with a Haynes distance rock test. The subject performs a discriminatory task
while shifting their focus from a distance target to a near target and back. The response time of
their visual system is measured and scores are reported in cycles per minute.38
The ability to assess target capture, a measure of dynamic visual acuity, is a strong asset
of computer-based assessments. Dynamic visual acuity (DVA) is defined as the ability to resolve
detail in an image when there is movement between the individual and the target.39 It is more
robust than static visual acuity but also requires more sophisticated equipment to measure, so
static visual acuity is often measured instead.32 Dynamic visual acuity provides a way of
motion. The VOR compensates for any linear or angular head movement by generating eye
movements in the opposite direction.40 Issues with balance are often due to failure of the VOR
and mediated by problems with gaze stability and dynamic visual acuity.41 A relationship exists
in which the more subjects struggle with maintaining a fixed eye position, the more difficulty the
subjects have maintaining balance. Thus, those that are able to maintain a fixed eye position are
able to better maintain balance in dynamic conditions.42 A standardized, efficient way to measure
this skill has yet to be established.43
The next visual skill assessed by the computer-based systems is perception span, which is
a measure of central visual recognition accuracy. The goal of the perception span assessment is
to measure the speed and scope of the subjects’ visual recognition.32 Besides computer-based
assessments, perception span is also commonly measured via the Corsi Block Tapping test. In
this assessment, there are 9 blocks scattered on a wooden table and a sequence is presented that
the subject must replicate by tapping the blocks. The assessment begins with a two-block
sequence, and increases by one block upon successful completion. While the goal of the Corsi
Block test is to measure visuo-spatial processing, it seems to measure several other domains
including verbal and non-verbal memory as well as executive function.44
Not traditionally measured in computer-based systems but included in newer models,
Multiple Object Tracking is a concept in which the individual must visually track multiple
objects moving in different directions simultaneously. It is viewed as a good way to assess one’s
ability to divide visual attention.45 A subject’s capacity to track multiple moving objects is
influenced by the speed of the objects and the age of the subject. When speed of the objects is
slower, subjects are able to track more objects at once. This reflects the flexible-resource model,
Additionally, adult and adolescent groups are able to track more objects than school-aged
children, reflecting changes in attentional capacity during development.46 Subjects are typically
able to track up to five moving objects at once in a field of 10 objects.45
Lastly, the computer based systems measure a series of eye-hand reaction and response
times via assessments of eye-hand coordination, go/no go, and hand reaction time. Reaction time
is defined as the amount of time between the onset of a visual stimulus and when the subject
initiates the motor response time, while response time is measured as the time needed to
complete the desired motor response in addition to the reaction time.32 Given the implications of
subjective assessment and examiner error in non-computer based assessments, computerized
assessments of eye-hand coordination and reaction time are largely preferred to traditional
assessments using various objects and timers.47 Before computer-based assessments were
available, eye-hand coordination and reaction time were assessed by the amount of time it took
subjects to match colored marbles in colored holes,48 or the number of pegs a subject could insert
into a pegboard in a given amount of time.49 Go/no go assessments take simple reaction time
assessments a step further by adding in the aspect of decision making. In go/no go assessments
there are two different stimuli, one that subjects should react to and one that subjects should not
react to. When a stimulus is shown, the subject must quickly decide whether or not they should
react to it, and if so execute the appropriate action. Reaction time in a go/no go situation is longer
than simple reaction time, as the response selection phase of information processing is more
complex.50
Visual Advantage in Sport
The literature suggests that athletes have superior visual and sensory performance to
acuity than non-athletes. Differences in dynamic visual acuity are also seen between athlete
classifications, where professional athletes have superior dynamic visual acuity to amateur
athletes.51 Visual acuity is an important skill in sport,52 as it is necessary to focus on moving
targets such as a ball to catch or hit, or to focus on a target while the individual is in motion.
Good depth perception is also advantageous for athletes, who have to identify and track
objects at various distances. Some sports and positions are more demanding of depth perception
than others. For example, a lack of stereopsis is a hindrance to one’s ability to catch a fast
moving ball,53 but the relationship between stereopsis and pitching skill may not be as strong.54
Depth perception is crucial to anticipation by allowing the athlete to judge the distance of a
player or object coming towards them and track how quickly the distance between them is
closing.55 Along with the ability to identify differences in depths, the ability to switch between a
near and far target is an important skill for athletes.11
Most sports, especially those that are fast-paced, require athletes to rapidly assess and
integrate the information from their surroundings. Consequently, athletes tend to be able to do so
and make decisions based on that information more quickly than non-athletes. This is reflected
by improved performance on perception span assessments, which measure the speed and span of
recognition of stimuli.56
The ability to track more than one object at once is another important skill for athletes, as
it provides them with a better awareness of the playing field. Soccer players that underwent a
training program to improve multiple object tracking had a better sense of the playing field and
consequently made better decisions when passing.57 Similarly, a sample of volleyball players,
team, were shown to have superior performance on a multiple object tracking test than matched
individuals who did not play volleyball.58
Lastly, eye-hand coordination, the ability to quickly and accurately hit a target, and go/no
go, which involves one’s ability to quickly make decisions are both logically associated with
athletic performance.32 As expected, many studies have shown that elite athletes have faster
eye-hand reaction times than amateur athletes and non-athletes,59,60 as well as visual reaction times.61
Baseball is a sport that requires players to rapidly make a decision of whether or not to swing at
an incoming pitch, and then respond in time to hit it. This is a great example of go/no go reaction
time. In accordance with the importance of this skill, experienced baseball players have faster
go/no go reaction times than less-experienced baseball players or non-baseball players.62
The superior visual and sensory performance of athletes is reflected in their athletic
performance. Ice hockey players with faster visual reaction time, better visual memory and
discrimination, and a better ability to shift focus between near and far objects scored more goals,
had fewer penalties, and had better athletic performance on the ice overall.11 Similarly, training
programs geared toward improving visual skills are transferable to improved sport performance.
After table tennis players underwent 8 weeks of training to improve eye hand coordination, not
only did their visual performance improve, they also displayed improved motor skills and better
sport specific performance overall.12
Anticipation in Sport
In many sports, anticipation is essential. Many sports operate at high speeds. A tennis
serve may travel at 140 miles per hour and a volleyball can be spiked at 100 miles per hour.63 To
handle and respond to such conditions, anticipation is key. Anticipation involves processing all
When referencing the importance of anticipation, goalkeepers are often provided as the example,
because they must rapidly process sensory cues in order to anticipate an upcoming shot and
properly defend it. European handball goalkeepers completed perceptual training protocols to
help improve anticipation so that they would be better able to predict shot direction.64 While a
large portion of the research on anticipation focuses on the goalkeeper position, athletes in all
positions of fast-paced sports can benefit from good anticipation skills.
When visual and sensory performance is below par, it can influence play that may be
associated with more severe head impacts and an increased risk of concussion. Football players
who were classified as “low performers” on a series of visual and sensory performance tasks
experienced significantly higher linear acceleration and rotational acceleration throughout the
season, as measured by a Head Impact Telemetry (HIT) system, than those characterized as
“high performers” on the visual tasks. Specifically, low performers on assessments of target
capture, perception span, and go/no go experienced significantly more severe rotational
acceleration, and the low performers on assessments of reaction time, target capture, near-far
quickness, depth perception, and go/no go experienced significantly more severe linear
acceleration in the head impacts.8 Those with more acute visual and sensory capabilities are
thought to be able to respond to their surroundings more efficiently, and thus avoid or reduce
more severe head impacts during sport. Low performance on visual and sensory measures could
be indicative of an inability to assess the environment and appropriately assess, anticipate, and
respond to the actions of opponents. Subsequently, these low visual performers may be prone to
sustaining more severe head impacts.
The ability to accurately assess the surroundings enables the athlete to better anticipate a
With anticipated hits, the athlete has time to adjust their body position. Head impacts that result
in injury are most common when the hit is unanticipated and the player’s head is the first point of
contact in the collision.10 Thus, not only is visual performance important for an athlete’s play on
the field, it is also crucial to their safety. In addition to increased risk of head injury, poor
anticipation is associated with increased risk of injury to the lower extremities. Knee stability is
compromised when movements are unplanned, compared to when subjects plan and anticipate a
stop-jump or cutting task.65,66 As a result, lack of anticipation can increase vulnerability to
anterior cruciate ligament injuries.67
Headgear Use
The value of headgear in contact sports, especially football, is a topic at the forefront of
media coverage. Those that are weary fear that helmets are used as a blunt object or weapon to
inflict damage to other players, or that helmets provide players with an invalid sense of
indestructability and increase risk-taking.68 Soccer players wearing headgear were found to
experience greater head accelerations than those without headgear because they had a more
aggressive style of play.69,70 Nonetheless, helmets have protective value. Studies have shown
that, when worn along with mouth guards, helmets can protect against head and facial injuries.71
However, it is essential to note that despite the common misconception, there is no current
evidence indicating that helmets play a role in reducing the incidence of concussions. Evidence
from biomechanical studies suggest that helmets may reduce impact forces to the head, but this
has not been shown to translate to fewer concussions.7,72 Football, lacrosse, and ice hockey, all of
which are helmeted sports, are reported to have the highest rates of concussion per athlete
exposure with football incidence rates ranging from 0.33 to 0.6 per 1000 athlete-exposures,
Given that a large concern in contact sport is facial injury, including injury to the eye,
helmets are designed to protect the face. In addition to shaping the helmets to provide this
protection, features such as visors and cages are worn.74 It is theorized that the enclosure of the
helmet may impede peripheral vision. Decreased peripheral vision would have negative
implications for target capture and overall reaction time to peripheral stimuli.32 Additionally, the
full facial cage worn with some helmets sits in front of the eyes, and thus could be a distractor
within the visual field. Evidence suggests that the presence of a distractor negatively impacts the
accuracy of saccades,75 so deficits in eye tracking abilities are theorized to exist.
In response to controversy about ski helmets and low rates of helmet use for skiing, a
study was done to assess peripheral vision while wearing ski helmets. Reaction time to
peripheral stimuli on a Compensatory Tracking Test, in which the subjects clicked a mouse in
response to the appearance of a yellow dot in one of four corners of a wall screen, was
significantly worse with use of cap and goggle or use of helmet and goggles when compared to
performance while only wearing a cap. However, the researchers did not find that ski helmet use
alone was a hindrance to reaction time to peripheral stimuli.76 Other studies of helmets have had
contrasting results. Motorcycle helmets, which are designed very differently from ski helmets,
have been found to decrease the user’s lateral vision. With restricted lateral vision, those wearing
the helmet must compensate by further rotating their head, but often fail to fully compensate for
the blocked visual field.14 Determined from a qualitative study, surfers, who perceive their risk
of head injury as very low, were against the implementation of headgear, claiming a lack of
necessity, discomfort, and perceived detriments to their senses and balance.77 The results from
previous studies justify a need to consider how helmets may impact vision. The current literature
football, lacrosse, and hockey. Additionally, the domains measured were limited to peripheral
vision and did not provide a comprehensive analysis of functional visual performance. Further
research is warranted to assess how other forms of headgear impact an array of visual and
CHAPTER 3
METHODOLOGY
Participants
23 healthy, males from the University of North Carolina at Chapel Hill aged 18 to 25
participated in the study. Individuals were recruited if they currently play or previously played
football, lacrosse, or ice hockey at a minimum of a high school level, and were recreationally
active, defined as participated in continuous physical activity for 30 minutes or more on 3 or
more days of the week. Participants were excluded if they had been diagnosed with a concussion
within the last year, had a history of known neurocognitive deficits, had a history of previous
skull fracture, brain bleed, or concussion that resulted in loss of activity for 3 or more weeks, had
a history of permanent vision loss, strabismus, or corrective eye surgery, had a history of
diagnosed or self-reported psychological conditions, or had a history of dizziness, abnormal
vestibular function, or abnormalities to the head, neck, shoulder, or back that disturb normal
range of motion. The participants were classified as “healthy,” and the criteria enabled valid
comparisons between sports. Participants were not excluded for requiring corrective eyewear as
long as they wore their corrective lenses for the testing session. Participation in the study was
limited to males; football and ice hockey are male-only sports for competition at the University
of North Carolina at Chapel Hill, and only male lacrosse players wear full helmets. Thus, a
Instrumentation and Tests
Senaptec Sensory Station
The Senaptec Sensory Station is an evaluation and training tool for visual and sensory
skills and has been validated as a vision and sensory performance measure.32
The Senaptec
Sensory Station is an interactive touch screen device consisting of one android touch-screen
tablet and one 50-inch touch screen monitor, displayed in Figure 1. A Motorola touch-screen
phone is used as a remote for some of the assessments. This evaluation assessed the visual
domains of visual clarity, contrast sensitivity, depth perception, near-far quickness, target
capture, perception span, multiple object tracking, eye-hand coordination, go/no go, and hand
reaction time. As there is currently no published data on the Senaptec Sensory Station, some
details for the Nike SPARQ Sensory Station, a very similar platform off which the Senaptec
Sensory Station is based, are included in the descriptions. Assessments are summarized in Table
3.1.
The visual clarity assessment measured static visual acuity. The subject was instructed to
stand 10 feet away from the tablet. A black Landolt ring (a circular ring with a gap at the bottom,
top, left or right) was shown on the screen in a random direction at predetermined sizes. Subjects
were instructed to swipe the screen of the Motorola touch screen phone in the direction of the
gap in the Landolt ring. As the subject answered correctly, the size of the Landolt ring got
smaller until the subject could no longer correctly determine the direction. At this point, the
Landolt ring increased in size until the subject could correctly identify the direction, and this
continued for several reversal points. This was completed with isolation of the right eye, the left
output, where a value of 0 represented normal, 20/20 vision. Negative values denoted vision
superior to 20/20, and positive values denoted worse vision.
For the contrast sensitivity (CS) assessment, there were four circles presented in a
diamond configuration on the tablet and the athlete was instructed to stand 10 feet away. One
circle contained a pattern of concentric rings that varied in brightness. The subject was instructed
to swipe the screen of the Motorola phone in the direction of the circle containing the ring
pattern (i.e., top, bottom, right, or left). When the subject correctly identified the ring with the
pattern, the subsequent patterns were more difficult to discern. Contrast sensitivity was assessed
at 2 spatial frequencies of 6 cycles per degree and 18 cycles per degree. The output measure for
this assessment was a logarithm in which log CS = -log1/CS
The depth perception assessment required the subject to wear a pair of red-blue glasses.
They were instructed to stand 10 feet away from the tablet, on which 4 black rings were
presented in a diamond configuration. Using a system of red-blue coloring, one ring was
randomly designed to appear closer than the rest of the rings, as if it was floating in front of the
screen. The subject was instructed to swipe the Motorola touch screen phone in the direction of
the ring that appeared closer (i.e., top, bottom, right or left). Subjects completed this assessment
looking over their right shoulder, over their left shoulder, and staring straight ahead. The depth
perception score output was the threshold reached in arcsec, where a smaller value indicated
better depth perception.
For the near-far quickness assessment, the subject remained standing 10 feet away from
the tablet. They were instructed to hold the Motorola touch screen phone up near the bottom of
the 14-inch display to allow for quick and easy transition between the two screens. A Landolt
was instructed to swipe in the direction of the gap. Once they accurately identified the direction,
the next ring appeared at the top of the Motorola phone screen. The Landolt ring continually
alternated between the far tablet and handheld screen for 30 seconds, during which the subject
attempted to correctly identify the direction of as many rings as possible. The near far quickness
assessment produced a score of the number of cycles completed in 30 seconds, as well as the
average return times in milliseconds.
For the target capture assessment, subjects stood 10 feet away from the 50-inch monitor,
which was raised so that the center of the display was at the athlete’s eye level. They were
instructed to fixate on a point in the center of the screen until a Landolt ring flashed in one of the
four corners of the screen. Subjects were instructed to find the Landolt ring, identify the gap, and
swipe the Motorola touch screen in the direction of the gap. The Landolt ring quickly flashed and
then disappeared, and the duration that the Landolt ring remained on the screen decreased with
each correct answer. The target capture score was a threshold response time in milliseconds (i.e.,
the shortest time that the Landolt ring appeared and the subject correctly identified the direction).
In the perception span assessment, the subject was instructed to stand an arms length
away from the tablet. The subject focused on a dot in the center of a grid pattern, and then a
pattern of dots (pseudorandomized to prevent “clustering” or recognizable shapes) flashed on the
screen for 100 milliseconds. The subject then touched the screen to recreate the dot pattern that
appeared. The subject went through a series of levels of increasing difficulty, only progressing to
the next difficulty if they achieved 75% accuracy. The first two levels contained 6 circles, with 2
or 3 dots flashing up. Levels 3 through 8 contained 18 circles, and 3 to 7 dots flashed up. The
final four levels contained 30 circles, and 7 to 10 dots appeared. If the subject did not pass a level
output for the perception span assessment was the number of dots they were able to correctly
identify throughout the entire assessment.
For the multiple object tracking assessment, the subject remained an arms-length away
from the tablet. The subject was instructed to follow one of the dots in each pair, for anywhere
between 2 and 8 pairs of dots rotating in individual orbits. One dot in each pair was highlighted
for 1 second at the beginning of each trial. The subject was instructed to focus on a target in the
center of the screen while following the dots rotate for 5 seconds. At the end of the rotation, the
subject was instructed to touch the screen to indicate the previously highlighted dots. 10 trials
were completed with varying numbers of pairs and rotation speeds. The multiple object tracking
task produces a proportional score, which is the cumulative number of correct dots recognized
multiplied times the number of pairs, divided by the highest possible score. To obtain a tracking
score, this score was multiplied by the highest number of dots accurately tracked.
For the eye-hand coordination assessment, subjects stood with their arms at shoulder
height within arm’s reach of the 50-inch display. There was a grid of 10 columns and 8 rows of
evenly spaced circles. A green dot appeared in one of the circles on the grid at the time, and the
athlete was instructed to hit the dot as quickly and accurately as possible. As soon as they hit one
dot, the next one appeared. Subjects went through a sequence of 80 pseudorandomized dots. The
pseudorandomized sequence appeared random to the athlete, but was controlled to avoid clusters
or recognizable sequences that may impact performance. The score was the total time it took the
athlete to hit all 80 dots, and also the average time in milliseconds it took them to hit each dot.
The next assessment, go/no go, was similar but added in the element of decision making.
Again, the subject was instructed to stand at an arm’s length away from the 50-inch display.
the dot that appeared was either green or red. If the dot was green, the athlete was instructed to
hit it as quickly and accurately as possible. If the dot was red, the athlete was instructed not to hit
it. Both green and red dots appeared for only 500 milliseconds. Throughout the assessment, 80
green and red dots appeared in a pseudorandomized order. The sequence for this assessment was
pseudorandomized for the same purpose as the eye-hand coordination assessment. The go/no go
output was a calculation of red dots hit subtracted from the number of green dots hit, with 25%
credit given to green dots that were hit late (within an additional 500 ms).
The final assessment measured hand reaction time. The subject stood at an arms’ length
from the tablet. Two sets of two concentric circles appeared on the screen. The subject was
instructed to place their index finger in the inner circle of each set on the screen and focus on a
dot in the center of the screen. Two, thee, or four seconds later, one concentric circle set turned
red. The subject was instructed to remove his/her index finger from that circle on the screen as
rapidly as possible, while leaving the other hand in place. The subject completed this task
multiple times, pseudorandomly alternating between the right and left sides to avoid anticipation.
Seven trials were completed, but up to two trials could be repeated if they performed slower than
two standard deviations lower than the mean of their performance. Subjects were given a score
for their dominant hand and non-dominant hand of the amount of time in milliseconds it took the
athlete to remove their hand following the visual stimulus.
Procedures
Before participating in any portion of the study, each subject provided informed consent
by signing documents approved by the university’s Institutional Review Board.
Prior to the commencement of any assessments, the subject was fit for a helmet
all 10 assessments on the Senaptec Sensory Station two times in succession; the assessments on
the station always followed the same pre-determined order: 1) visual clarity, 2) contrast
sensitivity, 3) depth perception, 4) near-far quickness, 5) target capture, 6) perception span, 7)
multiple object tracking, 8), eye-hand coordination, 9) go/no go, and 10) hand reaction time. For
one trial, they completed the assessment under normal conditions with no helmet on. For the
other trial, they completed all assessments with the helmet on. Assignment order of helmeted or
unhelmeted conditions was counterbalanced to minimize learning or fatigue effects. All testing
was completed in one 90-minute testing session.
Statistical Analyses
The Senaptec Sensory Station provided raw data for each of the 10 assessments, as
previously described. A 2 (helmeted vs. unhelmeted condition) by 3 (football vs. lacrosse vs. ice
hockey) mixed-model ANOVA was performed for each of the visual and sensory performance
measures. This determined the main effect of helmet condition and sport, as well as any
interaction between the two variables. Kramer-Tukey post-hoc assessments were used to further
explore any significant effects.
Although small, a sample size of 23 was expected to sufficiently power the analyses. For
an a priori alpha of 0.05 and a sample size of 20, an effect size ranging from 0.5 to 0.6 would be
associated with a power between 0.775 and 0.902 when using a 2 by 3 mixed-model ANOVA.
Thus, assuming a moderate effect size, the data analyses were expected to be adequately
powered.
Methodological Considerations
Participants were instructed to provide their own helmet for testing if possible. If not,
experience) at the time of testing. The make, model and condition of the helmets used by
subjects were recorded. This methodology was deemed appropriate to improve the accuracy and
generalizability of the study. There are many different makes and models used by the average
athlete. Also, if you put a subject in a helmet that they are not used to (i.e., a lacrosse player in a
football helmet), it could adversely affect visual and sensory performance. Although the use of
different helmets introduces variability as different helmet designs within a sport type may have
diverse features that uniquely affect vision, it was determined that it is important to consider this
CHAPTER IV
MANUSCRIPT
Introduction
It is estimated that up to 3.8 million sport and recreation-related concussions are
sustained by Americans each year.1 Moreover, concussions are creating a financial burden, with
costs exceeding $60 billion nationally.2 Concussions are particularly common in direct contact
sports, with the highest incidence rates seen in football, lacrosse, and ice hockey.3–6 While
helmets are instrumental in these sports for preventing skull fractures, facial fractures, and brain
bleeds, they do not play a role in concussion prevention.7
Vision is an important factor to consider in relation to sport concussion. Sharp visual
ability, especially heightened periphery, is key to an athlete’s ability to anticipate an impending
collision.8 Sufficient anticipation allows an athlete to properly position themselves to reduce the
force imparted to the head or move to avoid the collision.8,9 When an athlete does not anticipate a
hit, their head tends to be the first point of contact in the collision and the forces imparted are
more severe.10 Visual performance is also important for sports more generally, as advanced
ability to identify and react to peripheral stimuli, quickly shift gaze, and track objects while in
motion all contribute to superior athletic performance.11 Enhanced visual reaction time, visual
memory, and visual discrimination have been shown to directly translate to improved sport
performance, specifically in ice hockey.11 Elite athletes want to optimize their visual abilities,
The focus of helmet safety testing is on reducing forces to the head to minimize injury
risk,13 and thus does not strongly consider how potential barriers to vision may influence ability
to respond to stimuli in sport settings. The design of certain helmets may pose a hindrance to
users’ vision,14 which can be a detriment to both sport performance and safety. There are only
two previous studies that have investigated the effect of helmets on visual performance,
specifically motorcycle helmets and ski helmets, and the results are inconclusive; the motorcycle
study suggested that helmets were detrimental to peripheral vision while the ski helmet study did
not.14,75 To date, no known testing has been performed to determine the implications of football,
lacrosse, or ice hockey helmets on visual and sensory performance. A more comprehensive
analysis of the impact of helmet use on the visual and sensory performance of athletes is
necessary to further the conversations surrounding optimizing athlete visual performance and
ensuring athlete safety.
Therefore, the purpose of this study was to compare visual and sensory performance of
individuals under helmeted and unhelmeted conditions, assessing the effect of football, lacrosse,
and ice hockey helmets. It was hypothesized that visual and sensory performance would be
worse in the helmeted condition compared to the unhelmeted condition. Additionally, this study
aimed to determine if there was an effect of helmet type by sport (football, lacrosse, and ice
hockey) on visual and sensory performance. It was hypothesized that performance would be
consistent across helmet types.
Methods
Participants
We studied a convenience sample of 23 healthy, recreationally active males (age = 21.2 ±
are male-only sports for competition at the University of North Carolina at Chapel Hill, and only
male lacrosse players wear full helmets; thus, a completely male sample appropriately
represented the population studied.
All participants had played football, lacrosse, or ice hockey at a minimum of a high
school level. Participants were excluded if they had been diagnosed with a concussion within the
last year, had a history of known neurocognitive deficits, had a history of previous skull fracture,
brain bleed, or concussion that resulted in loss of activity for 3 or more weeks, had a history of
permanent vision loss, strabismus, or corrective eye surgery, had a history of diagnosed or
self-reported psychological conditions, or had a history of dizziness, abnormal vestibular function, or
abnormalities to the head, neck, shoulder, or back that disturb normal range of motion.
Recreationally active was defined as engaging in 30 minutes or more of physical activity on 3 or
more days of the week. The participants were classified as “healthy,” and the criteria enabled
valid comparisons between sports. All participants provided written informed consent. The study
was approved by the University of North Carolina at Chapel Hill Institutional Review Board.
Instrumentation
Visual and sensory performance was assessed with the Senaptec Sensory Station (Figure
1). This is a computerized evaluation and training tool powered by Android technology. It
consists of a 50-inch touch screen monitor, a 14-inch touch screen tablet, and a Motorola
touch-screen phone that is used as a remote to interact with the technology. The Senaptec Sensory
Station assesses the visual domains of visual clarity, contrast sensitivity, depth perception,
near-far quickness, target capture, perception span, multiple object tracking, eye-hand coordination,
go/no go, and hand reaction time. Participants completed visual clarity, contrast sensitivity, depth
touch-screen phone, and completed the remaining five assessments of perception span, multiple
object tracking, eye-hand coordination, go/no go, and hand reaction time at 2 feet or arm’s length
away from the displays. Assessments are summarized in Table 1.
The effect of football, lacrosse, and ice hockey helmets was assessed. All football
helmets worn during the study were Riddell SpeedFlex models, with standard football
facemasks. The lacrosse helmets were STX Stallion models, and had a full facemask. The
hockey helmets varied (Bauer and CCM models), but all included a full facemask.
Representative images of the helmet types are provided in Figure 2 for reference.
Procedure
Testing was completed in a single, 90-minute session. Participants completed all
assessments with best-corrected vision. Before completing the assessments, participants filled
out a questionnaire to confirm that inclusion criteria were met and to collect demographic
information, sport history, and level of comfort in a helmet. Participants provided their own
helmet if available or were fitted and provided an appropriate helmet by the researchers at time
of testing. The make and model of the helmet used was recorded for each subject. The helmet
type (i.e., football, hockey, or lacrosse) always matched the sport history of the participant.
Participants completed all of the Senaptec Sensory Station assessments twice. They completed
all ten assessments in succession 2 times: once without a helmet and another time while wearing
a helmet. The order of the helmeted and unhelmeted conditions was counterbalanced to account
for possible effects of learning or fatigue.
Data Reduction
The following Senaptec Sensory Station outcome measures were used: visual clarity
a logarithm of contrast sensitivity), depth perception (threshold in arcsec), near-far quickness
(number of cycles completed in 30 seconds), target capture (threshold response time in
milliseconds), perception span (total number of dots correctly identified), multiple object
tracking (tracking capacity), eye-hand coordination (average response time in milliseconds),
go-no go (correct greens minus incorrect reds hit, with 25% credit given to near-miss greens hit
within the next 500 ms), and hand reaction time (average response time in milliseconds).
Data Analysis
General descriptive statistics were used for subject demographics and each of the
Senaptec Sensory Station outcomes. To determine if there was an effect of helmet condition, as
well as to assess differences between sport helmet types, a 2 (helmet condition) x3 (sport)
mixed-model ANOVA was computed for each Senaptec Sensory Station outcome. Kramer-Tukey
post-hoc assessments were used to further explore any significant effects). Data were analyzed using
SAS 9.3 and an a-priori alpha level of 0.05 was used.
Results
Demographic information for the participants are reported in Table 2. All 23 participants
completed the full Senaptec Sensory Station battery for both conditions. The unadjusted means
for each outcome are reported in Table 3 and the adjusted means are reported in Table 4.
Adjusted means and p-values are reported throughout this section.
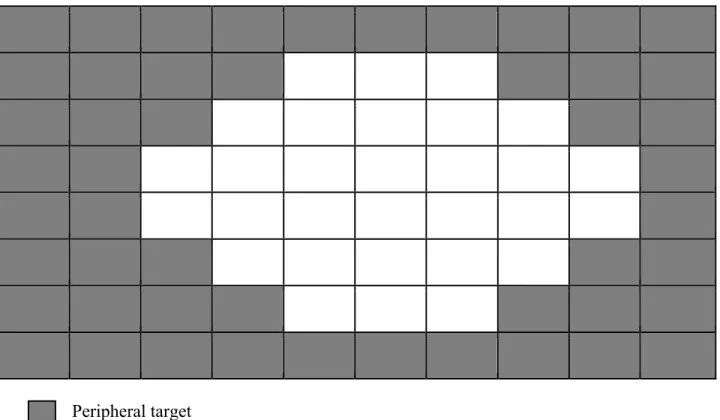
Participants performed significantly worse on the assessments of eye-hand coordination
(p=0.01) and go/no-go (p<0.01) during the helmeted condition compared to the unhelmeted
condition. For eye-hand coordination, participants responded to each target an average of 37.6
milliseconds slower when they were wearing a helmet (95% CI: -65.20, -9.99). Performance on
peripheral targets (distribution of central versus peripheral targets shown in Figure 3). It was
determined that there was no significant difference in reaction time to central targets when
participants were wearing the helmet compared to when they were not wearing the helmet
(p=0.079; mean difference: -21.42; CI: -45.57, 2.72). There was, however, a significant
difference in reaction time to peripheral targets in which participants responded 44.53
milliseconds slower to peripheral targets when wearing a helmet (p<0.01; 95% CI: 76.15,
-12.91). For the go/no-go assessment, participants scored 3.2 points lower when wearing a helmet
(95% CI: 1.22, 5.25). This assessment did provide a breakdown of peripheral and central scores.
There were no significant differences in performance when wearing a helmet for the following
assessments: visual clarity (p=0.23), contrast sensitivity (p=0.55), depth perception (p=0.77),
near far quickness (p=0.36), target capture (p=0.88), perception span (p=0.57), multiple object
tracking (p=0.71), or hand reaction time (p=0.22).
In addition to the main effects of helmet condition, interaction effects were found for the
assessments of visual clarity (p=0.01) and hand reaction time (p<0.01). For visual clarity,
performance was lower by 0.2292 LogMAR units when wearing a hockey helmet (p=0.04, 95%
CI: -0.3734, -0.0850) compared to not wearing a helmet, but no effect for football or lacrosse
helmets was found. For hand reaction time, performance was 24.2 milliseconds (p=0.02; 95%
CI: -38.06, -10.34) worse for hockey players wearing a helmet compared to the unhelmeted
condition. Additionally, when comparing helmeted conditions across the different sports, hand
reaction time was 36.6 milliseconds worse with hockey helmets than with football helmets
(p=0.046; 95% CI: -60.51, -12.63). No helmet by sport interactions were found for the remaining
(p=0.54), target capture (p=0.64), perception span (p=0.89), multiple object tracking (p=0.26),
eye-hand coordination (p=0.58), or go/no go (p=0.92).
Discussion
This study explores the possible ways in which different sport helmets may impact visual
and sensory performance. We found that visual clarity, eye-hand coordination, go/no go, and
hand reaction time were impacted by one or more helmet types. For eye-hand coordination and
go/no go, wearing a helmet, regardless of what sport it was for, impeded performance. For visual
and clarity and hand reaction time, wearing a hockey helmet negatively affected performance,
but wearing a football or lacrosse helmet did not.
Upon further evaluation of the eye-hand coordination assessment, it was determined that
response time to central stimuli was not affected by the helmet, but the response time to
peripheral stimuli was significantly slower when wearing a helmet. Thus, it was likely a decrease
in ability to respond to peripheral stimuli that drove this effect. This is in agreement with
participant’s self-reported assessment of the task, stating that they had difficulty seeing the dots
in the corners of the screen. Our methods of data reduction did not allow us to perform the same
analyses of central and peripheral stimuli for the go/no go assessment. However, given the very
similar design to the eye-hand coordination, it is likely that the limited peripheral vision with a
helmet contributed to the effect seen. This is consistent with previous helmet studies, such as the
evaluation of motorcycle helmets in which the researchers found that lateral vision was
decreased and the user was unable to fully compensate for the deficit.14 The present study takes
this a step further by showing not only that peripheral vision is limited by wearing a helmet, but
There were also deficits specific to hockey helmets. For visual clarity, we found that
hockey helmets negatively impacted performance, but the same effect was not seen for football
or lacrosse helmets. A similar effect was found for hand reaction time; performance was
significantly worse when wearing a hockey helmet compared to no hockey helmet, and when
wearing a hockey helmet compared to wearing a football helmet. This evidence suggests that
hockey helmets are affecting visual performance in different way than football and lacrosse
helmets. The literature suggests that having a distractor before one’s eyes can negatively impact
visual saccades.75 As seen in Figure 3, the cage of a hockey helmet has more protective bars
covering the face and eyes than does the cage of a lacrosse helmet or facemask of a football
helmet. While neither of these tasks are assessments of saccades, it is possible that the bars of the
hockey cage acted as distractors and affected other aspects of visual performance. Nonetheless,
conclusions drawn from these observations are limited, as the sample of hockey players tested
was very small (n=5).
Despite the literature indicating that distractors in front of the eyes can negatively impact
saccadic control,75 we did not see this effect manifested in assessments that involve eye-tracking
such as multiple object tracking or target capture. A possible explanation for this is that our
participants had simply adapted to the presence of the cage or facemask. The literature strongly
suggests that the visual-attention system is very plastic, and that with practice and habituation an
individual can learn to ignore a distractor.78 Given that our sample was limited to those who had
relevant sport experience at a minimum of a high school level, it is quite possible that they had
acclimated to the bars of the cage or facemask so that they were no longer a distractor. Had a less
experienced sample been tested, they might not have yet adapted in this way, and thus might
important safety implications for those learning to play sports, such as youth athletes, and would
be a valuable group to study further.
In general, there were some overarching limitations to the study. The most prominent
limitation is the small sample size. With only 23 participants total, and just 4 in the lacrosse
group and 5 in the hockey group, the comparisons were very limited. Had there been a larger
sample size, particularly with a more even distribution across groups, the comparisons would
have been more powered and it is possible that we may have seen an effect of helmets for more
visual assessments. Additionally, there was a limitation with respect to the fit of the helmets. For
the four participants that were able to provide their own helmet, it was assumed that it fit
properly. For the remaining 19 participants, every attempt was made to put them in the best
fitting helmet possible. However, we were limited to three sizes of each helmet and were not able
to adjust certain aspects such as padding thickness or facemask position. An improperly fitting
helmet could affect visual performance differently than would a properly fitted helmet. Further
studies on the effect of helmets on visual performance should include a larger sample size and
have the appropriate equipment to ensure well-fitted helmets for all participants.
Beyond these limitations, the real world implications of these findings are significant.
The apparent detriments to visual performance caused by helmets are alarming and should be
considered moving forward; not only could they affect athlete performance, but also safety if the
athletes are unable to properly anticipate incoming hits. Clinically measured reaction times can
predict the speed of a functional head-protective response.79 In other words, the additional 44.53
milliseconds it takes an individual to respond to a peripheral target when wearing a helmet
translates to a slower response to protect themselves from an incoming threat such as a ball
deficits of 31 milliseconds80 and 26 milliseconds81 as being clinically significant. With a deficit
of 37.6 milliseconds globally and 44.5 milliseconds to peripheral stimuli, the deficits recognized
in our study also likely have clinical and sport significance. The translation between reaction
time and anticipation is direct, as they are regulated by one continuous neural system.82
Additionally, there is strong evidence that poor anticipation is linked with an increased risk of
injury, both with respect to concussion and lower-extremities.9,10,67 Helmets are producing
significant visual deficits that can affect athlete safety and performance, and we must work to
References
1. Abernethy B, Schorer J, Jackson RC, Hagemann N. Perceptual training methods compared: the relative efficacy of different approaches to enhancing sport-specific anticipation. J Exp Psychol Appl. 2012;18(2):143–53.
2. Abraham N, Srinivasan K, Thomas J. Normative data for near point of convergence, accommodation, and phoria. Oman J Ophthalmol. 2015;8(1):14–8.
3. Al-Awar Smither J, Kennedy RS. A portable device for the assessment of dynamic visual acuity. Appl Ergon. 2010;41(2):266–73.
4. Alvarez TL, Vicci VR, Alkan Y, et al. Vision Therapy in Adults with Convergence
Insufficiency: Clinical and Functional Magnetic Resonance Imaging Measures. Optom Vis Sci Off Publ Am Acad Optom. 2010;87(12):E985–1002.
5. Atchison DA, Capper EJ, Mccabe KL. Critical Subjective Measurement of Amplitude of Accommodation. Optom Vis Sci. 1994;71(11):699–706.
6. Bonfield CM, Shin SS, Kanter AS. Helmets, head injury and concussion in sport. Phys Sportsmed. 2015;43(3):236–46.
7. Borotikar B, Newcomer R, Koppes R, McLean SG. COMBINED EFFECTS OF FATIGUE AND ANTICIPATION ON LANDING MECHANICS: CENTRAL AND PERIPHERAL CONTRIBUTIONS TO ACL INJURY RISK. J Biomech. 2007;40, Supplement 2:S253.
8. Broglio SP, Ju Y-Y, Broglio MD, Sell TC. The Efficacy of Soccer Headgear. J Athl Train. 2003;38(3):220–4.
9. BURG A. VISUAL ACUITY AS MEASURED BY DYNAMIC AND STATIC TESTS: A COMPARATIVE EVALUATION. J Appl Psychol. 1966;50(6):460–6.
10. Cavallini E, FASTAME MC, Palladino P, Rossi S, Vecchi T. Visuo-Spatial Span and Cognitive Functions: A Theoretical Analysis of the “Corsi” Task. Imagin Cogn Personal. 2003;23(2):217–24.
11. Christenson GN, Winkelstein AM. Visual skills of athletes versus nonathletes: development of a sports vision testing battery. J Am Optom Assoc. 1988;59(9):666–75.
12. Clavagnier S, Prado J, Kennedy H, Perenin M-T. How Humans Reach: Distinct Cortical Systems for Central and Peripheral Vision. The Neuroscientist. 2007;13(1):22–7.
13. Donders FC. On the speed of mental processes. Acta Psychol (Amst). 1969;30:412–31.
15. Duane A. Studies in Monocular and Binocular Accommodation, with Their Clinical Application. Trans Am Ophthalmol Soc. 1922;20:132–57.
16. Eckner JT, Kutcher JS, Broglio SP, Richardson JK. Effect of sport-related concussion on clinically measured simple reaction time. Br J Sports Med. 2014;48(2):112–8.
17. Eckner JT, Kutcher JS, Richardson JK. Effect of Concussion on Clinically Measured Reaction Time in 9 NCAA Division I Collegiate Athletes: A Preliminary Study. PM&R. 2011;3(3):212–8.
18. ECKNER JT, LIPPS DB, KIM H, RICHARDSON JK, ASHTON-MILLER JA. Can a Clinical Test of Reaction Time Predict a Functional Head-Protective Response? Med Sci Sports Exerc. 2011;43(3):382–7.
19. Engström DA, Kelso JAS, Holroyd T. Reaction-anticipation transitions in human perception-action patterns. Hum Mov Sci. 1996;15(6):809–32.
20. Erickson GB, Citek K, Cove M, et al. Reliability of a computer-based system for measuring visual performance skills. Optom - J Am Optom Assoc. 2011;82(9):528–42.
21. Fong DT-P, Lam M-H, Lai P-K, Yung PS-H, Fung K-Y, Chan K-M. Effect of anticipation on knee kinematics during a stop-jump task. Gait Posture. 2014;39(1):75–9.
22. Galetta KM, Morganroth J, Moehringer N, et al. Adding Vision to Concussion Testing: A Prospective Study of Sideline Testing in Youth and Collegiate Athletes. J
Neuroophthalmol. 2015;35(3):235–41.
23. Gardner RA, Broman M. The Purdue pegboard: Normative data on 1334 school children. J Clin Child Psychol. 1979;8(3):156–62.
24. Gessel LM, Fields SK, Collins CL, Dick RW, Comstock RD. Concussions Among United States High School and Collegiate Athletes. J Athl Train. 2007;42(4):495–503.
25. Griffiths G. Sports vision - prescribing and dispensing. Optometry Today. 2014;54(10):44.
26. Harmon KG, Drezner JA, Gammons M, et al. American Medical Society for Sports Medicine position statement: concussion in sport. Br J Sports Med. 2013;47(1):15–26.
27. Harpham JA. A Study of Visual and Sensory Performance, Collision Anticipation, and Head Impact Biomechanics in College Football Players [Internet]. 2013; [cited 2015 Oct 12 ] Available from: http://search.proquest.com/docview/1370240675/abstract
28. Hayes GJO, Cohen BEO, Rouse MWO, De Land PN. Normative Values for the Nearpoint of Convergence of Elementary Schoolchildren. Optom Vis Sci. 1998;75(7):506–12.
30. Heitger MH, Anderson TJ, Jones RD, Dalrymple-Alford JC, Frampton CM, Ardagh MW. Eye movement and visuomotor arm movement deficits following mild closed head injury. Brain. 2004;127(3):575–90.
31. Hernandez F, Shull PB, Camarillo DB. Evaluation of a laboratory model of human head impact biomechanics. J Biomech. 2015;48(12):3469–77.
32. Hitzeman SA, Beckerman SA. What the literature says about sports vision. Optom Clin Off Publ Prentice Soc. 1993;3(1):145–69.
33. Holmes JM, Fawcett SL. Testing distance stereoacuity with the Frisby-Davis 2 (FD2) test. Am J Ophthalmol. 2005;139(1):193–5.
34. Hootman JM, Dick R, Agel J. Epidemiology of Collegiate Injuries for 15 Sports: Summary and Recommendations for Injury Prevention Initiatives. J Athl Train. 2007;42(2):311–9.
35. Hughes PK, Bhundell NL, Waken JM. Visual and psychomotor performance of elite, intermediate and novice table tennis competitors. Clin Exp Optom. 1993;76(2):51–60.
36. Kida N, Oda S, Matsumura M. Intensive baseball practice improves the Go/Nogo reaction time, but not the simple reaction time. Cogn Brain Res. 2005;22(2):257–64.
37. Kim JH, Lee K-K, Kong SJ, An KO, Jeong JH, Lee YS. Effect of Anticipation on Lower Extremity Biomechanics During Side- and Cross-Cutting Maneuvers in Young Soccer Players. Am J Sports Med. 2014;42(8):1985–92.
38. Langlois JA, Rutland-Brown W, Wald MM. The epidemiology and impact of traumatic brain injury: a brief overview. J Head Trauma Rehabil. 2006;21(5):375–8.
39. Lee K, Junghans BM, Ryan M, Khuu S, Suttle CM. Development of a novel approach to the assessment of eye–hand coordination. J Neurosci Methods. 2014;228:50–6.
40. Lewis P, Baskaran K, Rosén R, Lundström L, Unsbo P, Gustafsson J. Objectively
determined refraction improves peripheral vision. Optom Vis Sci Off Publ Am Acad Optom. 2014;91(7):740–6.
41. Li C, Beaumont JL, Rine RM, Slotkin J, Schubert MC. Normative Scores for the NIH Toolbox Dynamic Visual Acuity Test from 3 to 85 Years [Internet]. Front Neurol. 2014;5 [cited 2015 Nov 6 ] Available from:
http://www.ncbi.nlm.nih.gov/pmc/articles/PMC4214219/
42. Lincoln AE, Caswell SV, Almquist JL, Dunn RE, Hinton RY. Video Incident Analysis of Concussions in Boys’ High School Lacrosse. Am J Sports Med. 2013;41(4):756–61.