EFFECTS OF FORMATIVE ASSESSMENT ON MIDDLE SCHOOL STUDENT ACHIEVEMENT IN MATHEMATICS AND READING
Abram J. Kline
A thesis submitted to the faculty of the University of North Carolina at Chapel Hill in partial fulfillment of the requirements for the degree of Master of Arts in the School of Education (Educational Psychology, Measurement & Evaluation).
Chapel Hill 2013
Approved by:
ABSTRACT
ABRAM J. KLINE: Effects of Formative Assessment on Middle School Student Achievement in Mathematics and Reading
(Under the direction of Dr. Gregory Cizek)
Working with a dataset from middle school students’ mathematics and reading assessments, this study was conducted to gather evidence regarding effects of formative assessment on student achievement. The study used student usage statistics from an online formative assessment program to examine the effect of formative assessment on student growth scores from end-of-grade summative assessments. The major findings of this study suggest that formative assessments are positively related to student achievement in reading and mathematics. Results suggest that short-cycle reading formative assessments result in positive gains for students in reading. Both student and school-level short-cycle reading formative assessment frequency were observed to have a positive effect on student achievement in reading.
ACKNOWLEDGEMENTS
TABLE OF CONTENTS
LIST OF TABLES……….………..vii
LIST OF FIGURES………..ix
LIST OF EQUATIONS……….x
Chapter I. INTRODUCTION…….………...……….……..1
Definitions……..…………....………..……3
Background..…..…………....………..……4
II. THEORETICAL FRAMEWORK & LITERATURE REVIEW………….……...9
Theoretical Framework....…….………..……….9
Literature Review...………....………..…..18
Research Questions…………..…..…………....………29
III. METHODS & PROCEDURES……….30
Method………….…….………..………...30
Statistical Methods…….…….………..……….36
IV. RESULTS..………48
Results……….………….…….………..………...48
Random Coefficients Models.…..…………..………...………59
Full Contextual Models……….………..………...………70
Model Comparisons……….………..………….………...………80
Summary of Results……….………..………….………...………87
V. SUMMARY, DISCUSSION, CONCLUSIONS & RECOMMENDATIONS….91 Summary of Study.…….…….………..………91
Findings………….…….………..……….94
Conclusions.………….…….………..……….104
Implications.………….…….………..……….106
Recommendations………...………..….107
APPENDIX A………111
LIST OF TABLES
Table
2.1 Focus and Cycle Lengths for Types of Formative Assessment...………16
2.2 Distance from Instruction Classifications.……….17
3.1 Training Types Offered by the OFAP Provider…………..………...31
3.2 Academic Change Score Calculation……….33
3.3 Unconditional Model……….37
3.4 Random Coefficient – Mixed-Effects Model (Total Assessments)………...39
3.5 Random Coefficient – Mixed-Effects Model (Cycle-Length Specific)……….…40
3.6 Random Coefficient – Total Assessments Model with Interactions….……….…41
3.7 Random Coefficient – Cycle-Length Specific Model with Interactions….…..…42
3.8 Full Contextual – Mixed-Effects Model (Total Assessments)..………....43
3.9 Full Contextual – Mixed-Effects Model (Cycle-Length Specific)………44
3.10 Full Contextual – Total Assessments Model with Interactions….……….……...45
3.11 Full Contextual – Cycle-Length Specific Model with Interactions….………..…46
4.1 Descriptive Statistics for Continuous Level-1 Variables………...………50
4.2 Demographics of Participants………51
4.3 Descriptive Statistics for Continuous Level-2 Variables………...52
4.4 School Demographics………53
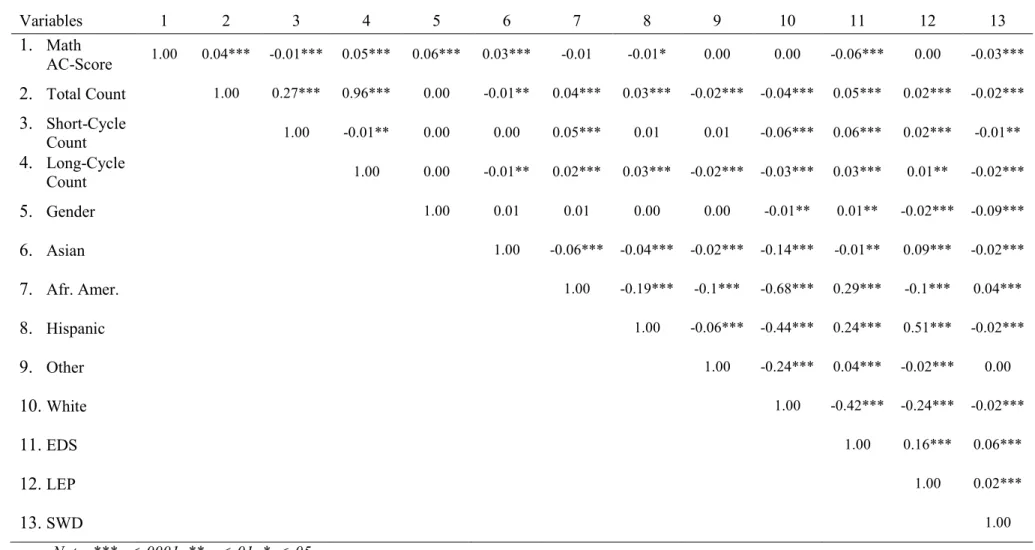
4.5 Bivariate Correlations for Level-1 Variables for Mathematics…………...….….54
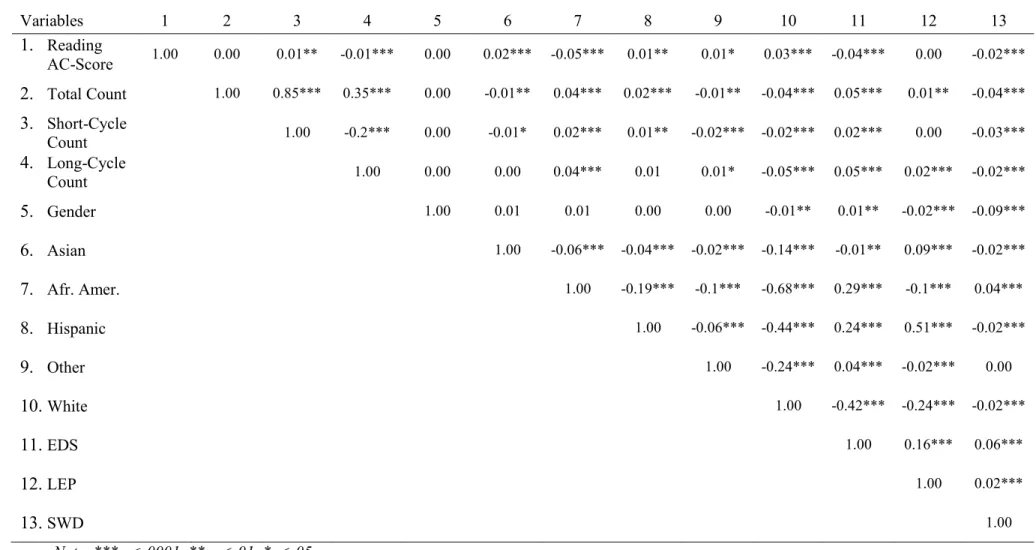
4.6 Bivariate Correlations for Level-1 Variables for Reading……….55
4.7 Bivariate Correlations for Level-2 Variables for Mathematics……….56
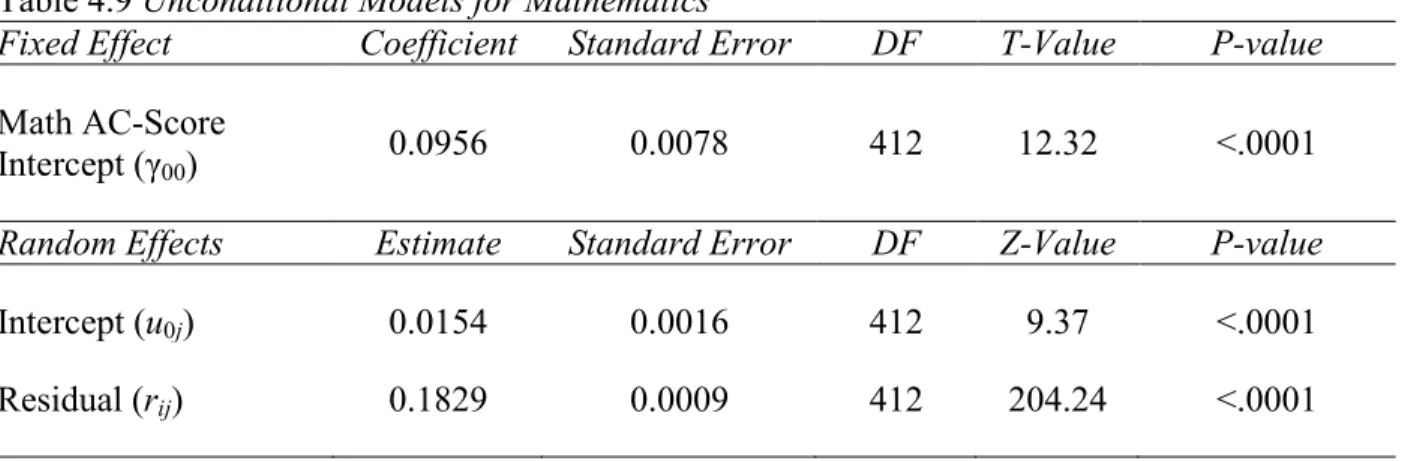
4.9 Unconditional Model Results for Mathematics………...…..56
4.10 Unconditional Model Results for Reading………...……...………..57
4.11 Random Coefficients Model Results for Mathematics………..63
4.12 Random Coefficients Model Results for Reading………...……..68
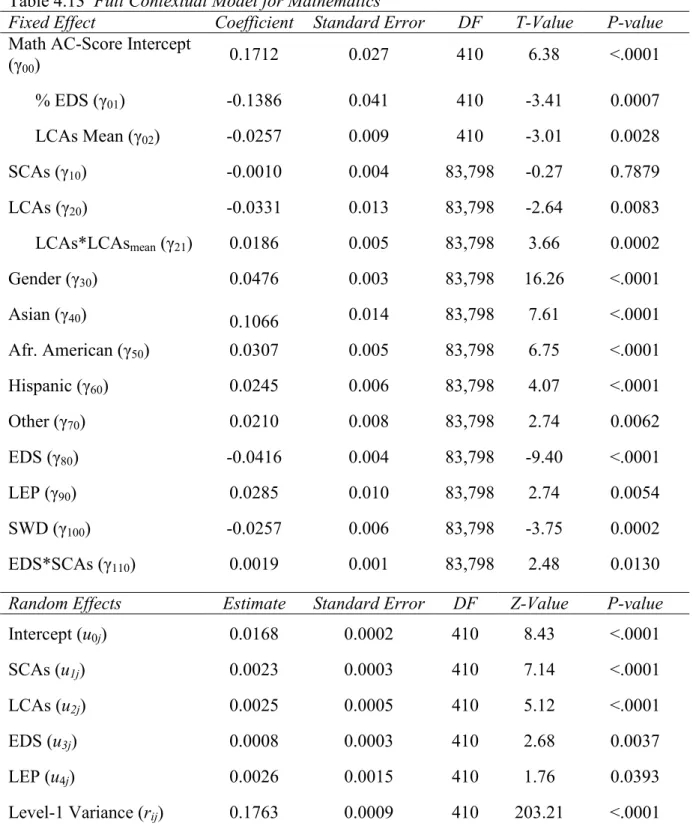
4.13 Full Contextual Model Results for Mathematics………...73
4.14 Full Contextual Model Results for Reading…...………...78
4.15 Three Model Fixed-Effects Comparison for Mathematics………..…..…82
4.16 Three Model Fixed-Effects Comparison for Reading…...…………..………..…83
4.17 Three Model Random-Effects Comparison for Mathematics…………..……..…84
4.18 Three Model Random-Effects Comparison for Reading…………...………84
LIST OF FIGURES
Figure
2.1 Focus and Cycle Lengths for Types of Formative Assessment...………16
2.2 Distance from Instruction Classifications.……….17
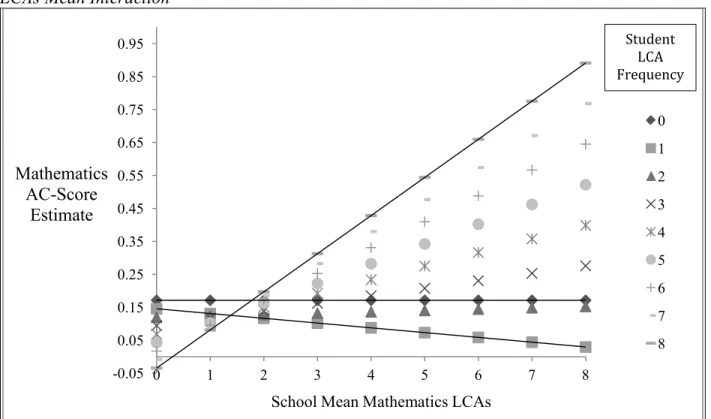
4.1 Mathematics AC-Score Estimates for Baseline Student – Based on LCA x School LCA Mean Interaction………...………76
4.2 Reading AC-Score Estimates for Baseline Student – Based on SCA x School SCA Mean Interaction……..………..………81
A1. Mathematics OFAP Item Sample………....115
A2. Reading OFAP Item Sample………116
LIST OF EQUATIONS Equation
1 Intraclass Correlation Coefficient (ICC).………..38
2 Design Effect……….38
3 Level-1 Proportional Reduction in Prediction Error……….47
CHAPTER ONE: INTRODUCTION
Introduction
The passage of No Child Left Behind (NCLB, 2001) legislation in the United States made summative assessments mandatory for public school students in an attempt to shrink national achievement gaps and increase student academic success. However, a report issued by the OECD in 2009 indicated that the United States has fallen to 21st of the top 26 OECD countries in terms of graduation rates (OECD, 2009). In addition, American students have shown little growth over the last decade in primary subjects such as mathematics and reading (U.S. Department of Education, 2011). These outcomes have left educators, administrators, and policymakers searching for more effective methods of improving student achievement. Race to the Top (RTTT), authorized under the American Recovery and Reinvestment Act (ARRA) of 2009, came with the same goals of closing national achievement gaps and increasing graduation rates (U.S. Department of Education, 2009). RTTT encouraged states to innovate their measures of student learning and achievement (Bill & Melinda Gates
Foundation, 2010). Since the arrival of RTTT, the topic of formative assessment has garnered a great deal of interest among the national and international education community.
time-intensive endeavor. However, the recent interest in formative assessment has spurred the development of many online formative assessment programs (OFAP) designed to take some of the burden off the shoulders of instructors, allowing students to benefit from formative assessment without adding another time-intensive task to the instructor’s already busy schedule.
Whereas it is exciting to see these types of educational innovations, it is also
important to monitor how these tools function in terms of student outcomes. Research at the Gates’ Foundation has suggested that an ideal scenario is one in which, “formative
assessments are embedded in the curriculum and actually guide the design of the summative assessments; the two forms of assessment should be intertwined” (2010, p. 6). A logical next step then would be to ask the question: Does the practice of formative assessment in the classroom affect student performance on summative assessments?
Definitions
The following set of definitions will be used throughout this paper.
Academic Change Score (AC-Score): student achievement measure based on state summative assessment performance. This was the primary dependent variable in this study. A detailed calculation of this score is provided in a subsequent section.
Online Formative Assessment Program (OFAP): a formative assessment tool which is available online, includes test items which have been aligned to state standards, and provides detailed, student-level feedback to the instructor.
OFAP Assessment Count: the total number of OFAP assessments taken in the given school year. This study included student-level counts and school-level means for both Mathematics and Reading OFAP assessments.
Background
Formative assessment can be defined as “frequent, interactive assessments of student progress and understanding to identify learning needs and adjust teaching appropriately” (OECD, 2005, p. 21). Properly administered formative assessment can provide useful data for educators so that they can understand in which areas their students are obtaining solid understanding and in which areas their students may need remediation.
Whereas formative assessment can occur organically within a classroom setting in the form of discussion, observed group work, or simple student-teacher interaction, these forms of formative assessment are, for obvious reasons, more difficult to quantify. In addition, information gathered from these types of formative assessments would need to be recalled by the instructor at a later time, which can easily lead to some students’ remediation needs being forgotten. Furthermore, students who are struggling but do not vocalize their needs may not be apparent to the teacher until summative tests are administered. In situations such as these, a formative assessment system, such as the OFAP used for this study, could prove to be a very useful tool for the instructor, assuring that data is collected and stored for all students in the class regardless of how much they speak up. Although the purpose of this study is not to contrast computerized and non-computerized formative assessments, the fact that an OFAP is used as the formative assessment tool facilitates the collection of data that can be used to investigate the potential effects of formative assessment. Not only does the OFAP provide useful data for the teacher, but it also provides quantitative data on formative assessment which is otherwise more difficult to obtain.
curve, and any potentially positive or negative effects may take time to become evident. With this in mind, it is important to understand how systems such as the OFAP are being used in the classroom and what types of student outcomes result from their use. Again, whereas this study does not focus directly on the technological aspect of formative assessment, it may provide some insight as to how formative assessment functions within that context. In addition to investigating the effects of formative assessment, it is also important to address any potential differences between different subgroups of students such as economically disadvantaged students (EDS), students with disabilities (SWD), and limited English proficiency (LEP) students. These issues and the related literature are discussed further to provide support and justification for the study.
Assessment Types
When discussing student assessment it is important to differentiate between three different forms of assessment: formative assessment, summative assessment, and interim assessment. Each form of assessment carries its own strengths and weaknesses and is designed to serve different purposes. In addition, although each form of assessment tests students’ knowledge, results from each type of assessment carry specific implications and therefore can only be effective to the extent that they are used as intended.
self-evaluation skills; and 4) to foster increased autonomy and responsibility for learning on the part of the student.
This is consistent with the largely agreed upon definition of formative assessment within the educational community. The keys to the definition of formative assessment that set it apart from interim and summative assessment are its timing and purposes. As formative assessment is intended to evaluate student understanding in order to adjust the instructional-learning model, it is only appropriate that it occurs throughout the course and not at the end. It is important to note, however, that assessments administered throughout the course of study are only truly formative if the results are used for the purpose of adjusting learning and instruction. This is an area which is often misconstrued and, as a result, often leads to the ineffective implementation of what is mistakenly thought of as formative assessment.
Summative assessment. A second type of assessment is summative assessment. Summative assessment is set apart from formative and interim assessment in that it typically occurs upon completion of coursework and is used primarily for measuring and evaluating student achievement levels (Cizek, 2010). Although results from summative assessments can be used to inform instruction, due to the timing of the administration, the results can only be used in making educational decisions that will impact future students. These types of
assessments are often administered on a large-scale, usually at the state or national level. Summative assessments can carry important consequences for students such as grade retention, grade promotion, or graduation. Based on the current legislation, teachers and administrators also have a great deal at stake in regards to summative assessments as schools can lose funding or even be shut down if repeated failure to meet federally-mandated
Interim Assessment. Interim assessment is somewhat of a mix between the two forms of assessment that have already been discussed. According to Perie et al. (2009), the two key components of interim assessments are that they “evaluate students’ knowledge and skills relative to a specific set of academic goals, typically within a limited time frame, and are designed to inform decisions both at the classroom and beyond the classroom level, such as the school or district level” (pp. 6-7). Based on this definition, interim is similar to
formative assessment in that it has an informative component and is intended to have instructional implications for the current students. The main difference between the two is that interim assessment occurs less frequently than formative assessment (typically marking the middle or end of a semester) and is also meant to inform administrative and policy decisions, by reporting outcomes of assessment so that comparisons can be made across the school or district. Perie et al. (2009) claim that many of the assessment tools currently being marketed as formative assessment systems are truly interim assessment systems because many of them focus on such things as predicting student scores and benchmarking.
The Future of Testing
summative assessments (Monfils et al, 2004). However, because summative assessments are much easier to administer on a large-scale, such as at the state-level, these currently remain the most realistic mechanisms to evidence student gains for accountability purposes.
Whereas it would not be prudent (or, currently, legal) to eschew large-scale
summative assessment, it seems logical that utilizing formative assessments throughout the school year that have been aligned with the state curriculum would benefit students by ensuring that the necessary objectives and goals are mastered prior to taking the end-of-year summative assessment. Recent studies support this notion, calling for further exploration of the relationship between formative and summative assessment, research which could hold implications for a comprehensive assessment system that would incorporate both form, and would better serve the informational needs and educational interests of students, instructors, administrators, and policy-makers (Perie et al, 2009).
CHAPTER 2: THEORETICAL FRAMEWORK & LITERATURE REVIEW
Theoretical Framework
According to Dylan Wiliam, “increased use of formative assessment is one of the most educationally effective and most cost effective ways of increasing student achievement” (2010, p. 36). His chapter in the Handbook of Formative Assessment (2010) provides
implications for a new theory of formative assessment, building on some of the already existing literature and theory. This chapter covers several key aspects of formative assessment, explaining how it can optimize learning and instruction in the classroom.
Moments of Contingency
Formative assessment focuses on moments of contingency in instruction in which agents of formative assessment (teachers, peers, and/or students) gather evidence from which to base decisions on how to best regulate the learning process (Furtak, 2005; Stiggins & DuFour, 2009; Wiliam, 2010). Whereas these moments are only a narrow slice of the educational process, they are a vital part which links directly to other important aspects of learning.
asynchronous moment of contingency failing to form instruction for the current students would be a teacher using test results from one class to adjust the instructional practices used in a different classroom. In a case such as this, even though the students from which the evidence was collected did not benefit, the assessment could technically be considered to be formative under the broader definition of formative assessment in that the evidence elicited ultimately resulted in the regulation of instruction. Although this is not to say that
assessments which create asynchronous moments of contingency cannot be formative, it is fair to say that assessments which create synchronous moments of contingency fit more consistently with the more comprehensive definition of formative assessment in which evidence is elicited and used to make decisions about the next steps to take in the learning process for the current students.
Types of Formative Assessment
The second type of formative assessment proposed by Wiliam (2010) is diagnostic assessment. Diagnostic assessments serve not only to indicate that a problem has occurred in the instructional process, but also to locate the specific area in which the student or students are experiencing trouble. An example of this would be an assessment which the instructor has access to information regarding the test items, thereby allowing for identification of the particular constructs (e.g. goals, objectives, etc) which were not fully comprehended by the student(s).
Whereas diagnostic assessments provide more detailed evidence of learning as compared to monitoring assessments, there still is room to expand. The shortcoming of the diagnostic assessment is its lack of ability to provide insight on how to go about overcoming the student’s lack of understanding. This is where the third type of formative assessment comes in: assessments providing instructionally tractable insights. Wiliam explains that these type of assessments “situate the problem within a theory of action that can suggest measures that could be taken to improve learning” (2010, p. 27). An assessment that provides instructionally tractable insight elicits evidence of 1) which students are struggling, 2) in which areas they are struggling, 3) as well as the specific miscomprehensions that are causing these struggles. The third component provides traction for the instructor by indicating the next steps to take in attempts to overcome the problem.
It is important to note that the differentiation of the different types of assessment is not necessarily to suggest that all assessments need to be those that provide instructionally tractable insights. While it is true that, in comparison with monitoring or diagnostic
grasp of the material included in the lesson, a monitoring assessment may suffice, serving to provide evidence affirming that the instruction was successful and therefore no additional assessment is required. This illustrates one of Wiliam’s (2010) key points in regard to formative assessment; that the evidence elicited through formative assessment does not necessarily need to lead to change in instructional practice. Whereas one of the primary purposes of formative assessment is to provide evidence to inform future instruction, affirmation of success in the current practice, although perhaps not leading to a change in instruction, still qualifies as formative in that the decision to continue forward with the current instructional practice is based on evidence gathered through assessment of the students’ understanding.
Informative Questioning Cycle
Furtak (2005) proposed a three-step informative questioning cycle which involves a continuous elicitation of student understanding while moving towards specific learning goals. The first step in this cycle is 1) eliciting responses from students in order to understand where they stand in their learning. In a continuous context, this could occur in classroom discussion or question and answer sessions. Furtak suggests 12 types of questions for teachers to use in the process of eliciting evidence of understanding from students. A few examples of Furtak’s types of questions for eliciting evidence of understanding are questions that formulate
explanations, interpret data or patterns, compare/contrast others’ ideas, elaborate, take votes on ideas, share predictions, and define concepts. Furtak suggests that teachers “use the list as a source of suggestions, tailoring the questions to fit their own activities” (2005, p. 23).
classroom discussion. If a student’s response provides evidence that a misunderstanding has occurred, the teacher should then return to the first step and elicit more information in order to understand where the misconception may be grounded in order to help move the student towards the learning goal.
The third part of the informative questioning cycle is to take action based on the evidence collected in the first two steps of the cycle. In this step, the teacher encourages students to discuss their conceptions in an attempt to reach a common understanding based on the facts and evidence that was involved in the discussion. Furtak provides four guiding question types for teachers to help initiate the action part of the cycle. Types of acting questions are those which promote argumentation, help relate evidence to explanations, provide descriptive or helpful feedback, or promote making sense (2005, p. 24).
Decisions for Future Action
Closely in line with the informative questioning cycle proposed by Furtak, Wiliam (2010), Ramaprasad (1983) indicates three keys to the instructional process based on the systems approach to formative assessment:
1) establishing where the learners are going;
2) establishing where the learners are in their learning; and 3) establishing what needs to be done to get them there.
well-constructed formative assessment theoretically provide the instructor with the evidence necessary to make an informed decision as to what the next course of action should be in the learning process. Based on this, formative assessment can account for a great deal of the instructional process by providing evidence on where the students are in their learning and, if constructed in a manner which measures achievement on specific learning goals or
objectives, what needs to be done to get them to the goal established at the beginning of the lesson. Formative assessment, therefore, can serve a major role in the instructional process, helping to increase the efficiency and efficacy of instruction.
Levels of Assessment
Stiggins and DuFour (2009) provide implications for assessment to be used formatively at three different levels – classroom, school/program, and
institutional/accountability level. The type of evidence elicited and future action varies by level, but they all work together to drive success of students, instructors, and schools.
Stiggins and DuFour also suggest that the development of common assessments to be used across classrooms may be helpful in identifying struggling students among different classrooms within the same school. This notion leads into the next level of assessments.
School-level assessments. While Stiggins and DuFour (2009) suggest that cross-classroom common assessments may be helpful for individual students, they are an
absolutely imperative part of evaluating strengths and weaknesses in the current curriculum and instruction being practiced at the school. Results from school-level common assessments help to “identify components of an instructional program that are working effectively and those that are not” (p. 641). The authors indicate that teachers within the school should collaborate to form common assessments which address three formative purposes: 1) to identify curricular areas in which many students are struggling, 2) clarify each instructor’s individual strengths and weaknesses, and 3) identify students who are in need of systematic interventions.
Institutional-level assessments. The last level described by Stiggins and DuFour draws attention to the need for accountability tests in order to provide evidence of
Cycle Length
Building on the previous section, while interim or summative assessments can function formatively if the information gathered from them is used to inform future
instruction, it is important to recognize that differences in cycle length exist for each of these types of assessments (Wiliam, 2010). The three formative assessment cycle lengths indicated by Wiliam and Thompson (2007) are 1) Long-Cycle, 2) Medium-Cycle, and 3) Short-Cycle. Descriptions of each of these can be found in Table 2.1. These categorical designations are intended to describe the length of the feedback loop – the time from assessment until the results are actionable. Furthermore, the current literature supports the popular assumption that shorter assessment cycle lengths are more likely to increase learning in students, while assessments with longer cycles are not likely to have much of an impact on learning (Cowie & Bell, 1999; Looney, 2005; Shephard 2007; Wiliam, 2010).
Table 2.1 Focus and Cycle Lengths for Types of Formative Assessment
Type Focus Length
Long-Cycle Across marking periods,
semesters, quarters, years 4 weeks to 1 year Medium-Cycle Within and between
instructional units 1 to 4 weeks
Short-Cycle Within and between lessons Day by day; 24 to 48 hours Minute by minute: 5 seconds to 2 hours
Sensitivity to Instruction
learning outcome measures used in different studies are likely to differ significantly in their sensitivity to instruction” (p. 21). Furthermore, he identifies the assessment’s distance from the curriculum it is intended to assess as the primary determinant of its sensitivity to
instruction. Ruiz-Primo, Shavelson, Hamilton, and Klein (2002) proposed five categories indicating distance from curriculum as a standard for measuring sensitivity to instruction. The five categories are presented in Table 2.2.
Table 2.2 Distance from Instruction Classifications
Category Example
1. Immediate Science journals, notebooks, and classroom tests 2. Close Formal embedded assessments
3. Proximal Different assessment of the same concept, requiring some transfer 4. Distal A large-scale assessment from a state assessment framework, in which
the assessment task was sampled from a different domain, such as physical science, and where the problem, procedures, materials and measurement methods differed from those used in the original activities
5. Remote Standardized national achievement tests
The results from Ruiz-Primo, et al (2002) illustrate the inverse relationship between distance from curriculum and sensitivity to instruction, suggesting that the closer the assessment is to the enactment of curriculum, the greater the sensitivity to instruction. In comparing the average effect size of a proximal intervention (.26) with the average effect size of a close intervention (1.26) their study illustrated the impact that distance from instruction can have on student outcomes.
As shown in the theoretical framework section, the current theories and literature are intertwined, all involving different aspects of the assessment process. From the setting to the intended purpose, comparisons between Wiliam’s types of assessment, Furtak’s assessment cycle, and Stiggins and DuFour’s three levels of assessment illustrate a general
understanding among researchers in the field of formative assessment.
Literature Review
Many studies since the late 1980s have shown the positive effects that formative assessment can have on student achievement (Burns et al, 2010; Bergan et al., 1991; Black & Wiliam, 1998; Foster & Poppers, 2009; Fuchs & Fuchs, 1986; Martinez & Martinez, 1992; Miesels et al, 2003; Peterson & Vali Siadat, 2009; Sadler, 1989; White & Frederiksen, 1998). However, federally-mandated summative assessments have remained the primary mechanism for measuring student knowledge. Studies have been conducted at all levels, from
kindergarten through college, and have shown that formative assessment has the potential to close achievement gaps while raising student achievement overall (Fuchs & Fuchs, 1986). Furthermore, it has been shown that formative assessment is capable of compensating for differences in instructor ability (Martinez & Martinez, 1992). This is an area in which formative assessment could potentially help by providing relief to schools which have historically had trouble attracting the nation’s best educators.
Closing Achievement Gaps
Of particular concern in education are the achievement gaps that currently exist among different subgroups in the United States including gender, racial and ethnic minorities, English language learners, students with disabilities, and students from low-income families (National Education Association, 2012). Many studies have addressed gaps in achievement between subgroups by exploring the effects of formative assessment when applied to these at-risk populations.
Meisels et al (2003) investigated the effects of a curriculum-embedded performance system – Work Sample System (WSS) – on the change in student summative scores from third to fourth grade. The focus of their study was on a sample of students from a
low-income, urban school district in Pittsburgh, Pennsylvania. The sample matched 96 students in WSS classrooms with 116 students in non-WSS classrooms by demographic characteristics. Classrooms were matched as closely as possible on race, income, mobility, school size, and number of parents in the home. The two comparison groups were also compared to the 2,922 third and fourth grade students in the Pittsburgh Public school district from 1996-98.
The study compared student’s change in score on the Iowa Test of Basic Skills (ITBS) from third to fourth grade. The researchers utilized longitudinal data based on the presumption that the students’ raw scores would be comparatively low due to the negative effects typically seen in low-income school districts. Using longitudinal data, therefore, would allow student gains to be evidenced regardless of score.
The WSS was a “curriculum-embedded performance assessment” designed for
perceptions of students, as well as involving students and parents in the learning and assessment process.
The results from a three-step hierarchical regression, controlling for previous score, indicated that students in WSS classrooms displayed greater gains (27 and 20 points for reading and math, respectively) than their demographically matched comparison group (0 and 6 points for reading and math), as well as all other public school students at the same grade level (15 and 17 for reading and math). Furthermore, gains were shown for students who started with high skills as well as students who started with lower skills (Meisels et al, 2003). This evidence supports the notion that formative assessment may provide benefits for students coming from economically disadvantaged backgrounds.
Also addressing an at-risk population, Fuchs and Fuchs (1986) conducted a meta-analysis of educational research designed to measure the effects of formative assessment in the classroom on children with disabilities. The age levels ranged from preschool to grade twelve. Each of the studies included in the meta-analysis, which included comparisons between experimental and control groups, produced relatively large effect sizes of .70 or higher. These results suggest the potential effectiveness of classroom formative assessment on student achievement. In addition, the research design indicates that using student gains may be helpful when measuring effectiveness of an intervention on student populations that may historically perform lower than their peers in order to place emphasis on growth as opposed to overall achievement.
collaborated with colleagues following collection of formative assessment information, and the group who collected formative assessment information but without the collaboration element--a stark difference was noted between those groups. Classrooms in which
collaboration occurred displayed a much larger effect size compared to classrooms in which collaboration did not occur (effect sizes =.92 and .42, respectively). This difference displays the importance of collaboration between teachers in evaluating student understanding and planning towards future instruction. The authors also found that although all students benefited from the implementation of formative assessment, students with mild mental disabilities displayed greater gains.
Addressing another at-risk population, Bergan et al (1991) studied a sample of 838 kindergarten children who came from economically disadvantaged domestic homes. The sample was taken from six states, seven different districts, and 21 different schools. This study looked at the effects of a measurement and planning system (MAPS) on the promotion of students into traditional or special education tracks. The study was implemented over the course of eight weeks and produced results in support of formative assessment. Following the eight week evaluation period, the experimental group showed significantly higher gains in reading, math, and science as compared to the control group. In the control group one in every five students was placed in special education as compared to one in every 71 students in the experimental group. This finding is startling given the ramifications of placing a child in special education at the beginning of his or her schooling (Byrnes & Yamamoto, 1984; Niklason, 1984; Peterson, DeGracie, & Ayabe, 1987).
The current literature provides evidence regarding the effects of assessment frequency on student achievement (Martinez & Martinez, 1992; Peterson & Siadat, 2009).
In a study investigating the effects of formative assessment on student achievement in a college-level elementary algebra class, Peterson and Siadat (2009) used a pre-post test design in order to measure student achievement over time. Data for this study was collected over three years from multiple iterations of the same course taught by 25 different
instructors, but with the same materials, academic objectives, textbook, content, and
homework. In addition, all students took the common midterms, finals, and COMPASS test. The only other difference between classes was the presence of frequent formative assessment with immediate feedback.
The sample was representative, consisting of 1,574 students of mixed gender, race, ethnicity, ability, and economic background. Students self-assigned to instructional groups upon enrollment. This self-assignment resulted in a disproportionally smaller test group of 222, students placed in ten sections taught by two instructors, whereas the control group consisted of 1,352 students, placed in 50 sections, taught by 23 different instructors. The instructors of the sections in the test group received specific training on how to formatively assess the students throughout the course.
next level math course. On the other hand, the majority of the students in the control groups did not pass the COMPASS exam.
The findings of Peterson and Siadat (2009) support the common claim that formative assessment can increase student achievement. Particularly, “formative assessment in the form of frequent, cumulative, time-restricted, multiple-choice quizzes with the immediate
constructive feedback reveals the levels of conceptual understanding in a timely manner and improves student academic performance on the summative assessment instruments” (p. 100). Although the results of this study suggest that frequent formative assessment increases student achievement, the authors found that an increased frequency of formative assessment failed to produce a significant improvement in students’ learning outcomes. This discovery was unexpected and contrary to other literature regarding frequency of formative assessment (Martinez & Martinez, 1992). The results of this study indicate that additional research in the area of frequency of assessment would be beneficial to the discourse on formative
assessment.
the other two classes were taught by an instructor with extensive teaching experience, and a history of outstanding ratings from past courses.
Results from this study showed that frequency of assessment has a positive effect on achievement, although the gains were much smaller for the experienced teacher in
comparison to the average instructor. The authors speculated that the higher achievement but lower overall gain observed for students in courses taught by the experienced instructor was due to the instructor’s ability to formatively assess his students without administering a formal assessment. That is, he was able to gauge student understanding through other means such as discussion, and therefore, account for the difference in frequency of assessment. The authors (Martinez & Martinez, 1992) presented implications for the previously mentioned under-funded and under-staffed schools, suggesting that the implementation of formative assessment in the classroom could compensate for the lack of highly experienced, expert teachers.
Formative Assessment and Instructional Technology
Over the past few decades, technology has been taking over the world of education. The recent interest in formative assessment has spurred testing companies have been turning out new technology-enhanced assessment tools meant to improve student performance and streamline the data collection process. In response to the release of these products, many researchers have begun to address the effectiveness of technology-enhanced formative assessments on student achievement (Burns et al, 2010; Kingston & Nash, 2011).
were deemed acceptable based on a five-point criteria: 1) intervention had to be described as formative or assessment for learning, 2) participants had to be from a K-12 setting, 3) a control or comparison group design must have been used, 4) the appropriate statistics
required for effect size must have been provided, and 5) the study had to have been published in 1988 or later. Of the 42 effect sizes selected for the meta-analysis, 19 were based on math formative assessment, 12 on reading, language arts, or writing, 10 on science, and one on music.
Kingston and Nash (2011) categorized each of the 42 effect sizes into five different treatment type categories based on common themes found throughout the literature review. The five categories were: 1) professional development, 2) curriculum-embedded assessment systems, 3) use of a computer-based formative assessment system, 4) use of student
feedback, or 5) other types of formative assessment. Of the 42 effect sizes, 23 used
professional development as the treatment, seven used curriculum-embedded assessment, six used computer-based formative assessment system, and the student feedback and other types of formative assessment categories accounted for three effect sizes each.
The results from this study, utilizing a random effects meta-analytic approach, produced a weighted mean effect size of .20 and a median effect size of .25. Although Kingston and Nash point out that these effect size estimates are markedly lower than the effect-sizes claimed by the oft-cited study by Black and Wiliam (1998b), their results still suggest that formative assessment has a significantly positive effect on student learning (Kingston & Nash, 2011).
Reading produced the largest mean effect size (.32) with math and science producing mean effect sizes of .17 and .09, respectively. Studies involving professional development activities as the treatment produced the largest mean effect among treatment types (.30). However, the authors note that all of the effect sizes for this treatment type came from the same study, in which the authors point out that the findings were difficult to interpret due to methodological issues (Wiliam et al, 2004). Computer-based formative assessments were also shown to have a moderately large mean effect size (.28). This implication is quite relevant in that technology continues to pervade the educational process. These findings may indicate that technology and formative assessment can be a formidable team of tools for teachers to utilize in the classroom.
Burns et al. (2010) conducted a study that examined the effects of technology-enhanced formative evaluation (TEFE) on student achievement. The authors hypothesized that computer-based formative assessment would increase student achievement as it would allow instructors to implement effective formative assessment programs in their classrooms without requiring a great deal of additional time and effort. The study included 360 non-charter elementary schools from across four geographically distinct states in the U.S. (Florida, Minnesota, New York, and Texas) which were randomly selected from a list of schools who had previously ordered the TEFE program from the publisher. The mean
enrollment across schools was 522.62. The study examined if a higher percentage of students at schools using a TEFE system scored at the proficient level or higher on state-wide
summative assessments.
relevant instructional tasks” (Burns et al., 2010, p. 586). The program provides students with tasks and provides feedback as they complete them. The program allows the student to work relatively independently while sending data and monitoring reports to the teacher.
The study design addressed the duration of program implementation at each school. The schools in the study were classified as having used a TEFE system for 1) one year to four years and eleven months, 2) five years or more, or 3) not at all. In addition, relevant school-level variables were collected including: percent proficient in reading and math, student enrollment, average student/teacher ratio, percent free or reduced lunch (FRL), as well as ethnic variables.
Results showed that, in schools with TEFE programs, a higher percentage of students scored at or above the proficient level on the end-of-year state summative assessments as compared to students in schools that did not have a TEFE program at all. In particular, the schools that had been using a TEFE program for five or more years produced a rather large effect size of .78. Schools that had the TEFE program in place for one year to 4 years and 11 months produced an effect size of .51. This evidence suggests that not only are students at schools with TEFE programs more likely to achieve proficient or higher score-levels on state summative assessments, but students at schools that have had a TEFE program in place for a longer time show greater achievement. In addition, Burns et al found no significant
This study provides traction for additional research on the effects of technology-enhanced formative assessment on student summative assessment performance. In addition, additional investigation towards the ability of formative assessment to close the achievement gap would be beneficial to the literature.
Expanding the Literature
The existing literature provides a sufficient base knowledge from which further exploration on the effects of formative assessment in the classroom can build upon. Evidence from past research has shown that formative assessment has the potential to result in positive gains for all students, and possibly even more so for disadvantaged individuals (Black & Wiliam, 1998; Burns et al, 2010; Fuchs & Fuchs, 1986; Martinez & Martinez, 1992; Meisel et al, 2003; Peterson & Siadat, 2009; Sadler, 1998). However, there is certainly room for expansion in the research. Perie et al. (2009) called for future researchers to examine the ability of formative assessments to improve achievement on summative assessments. The study described in this thesis addresses these issues. Student achievement on the North Carolina end-of-grade (EOG) reading and mathematics assessments, specifically the change in scale score from 2009-2010 to 2010-2011, were compared with frequency of OFAP assessments taken throughout the 2010-11 school year.
Research Questions
This study was designed to examine student formative and summative assessment data for potential differences in student achievement based on number of formative
assessments taken. In addition, assessments cycle-length categories were used to determine if results are consistent based on assessment cycle-length. The cycle-length variable was
determined based on the timing and intention of the assessments (classroom quiz – short-cycle vs. district-wide benchmark assessment – long-short-cycle). Controls were included for gender, race, economically disadvantaged student (EDS), students with limited English proficiency (LEP), and students with disability (SWD). This thesis attempted to address these issues through the following research questions:
1. What are the effects of formative assessment frequency on student performance on reading and mathematics summative assessments for middle school students (grades six through eight)?
2. Do the effects of the formative assessment frequency differ based on assessment cycle-length?
CHAPTER THREE: METHODS & PROCEDURES
Method
This study was conducted to gather evidence regarding the effects of formative assessment on student achievement. Specifically, the relationship between frequency of formative assessment and student gains on state-mandated, end-of-grade assessment were investigated. The study used student usage data from an Online Formative Assessment System (OFAP) and existing end-of-grade (EOG) Math and Reading assessment data. The data and methods are described in this chapter.
Participants
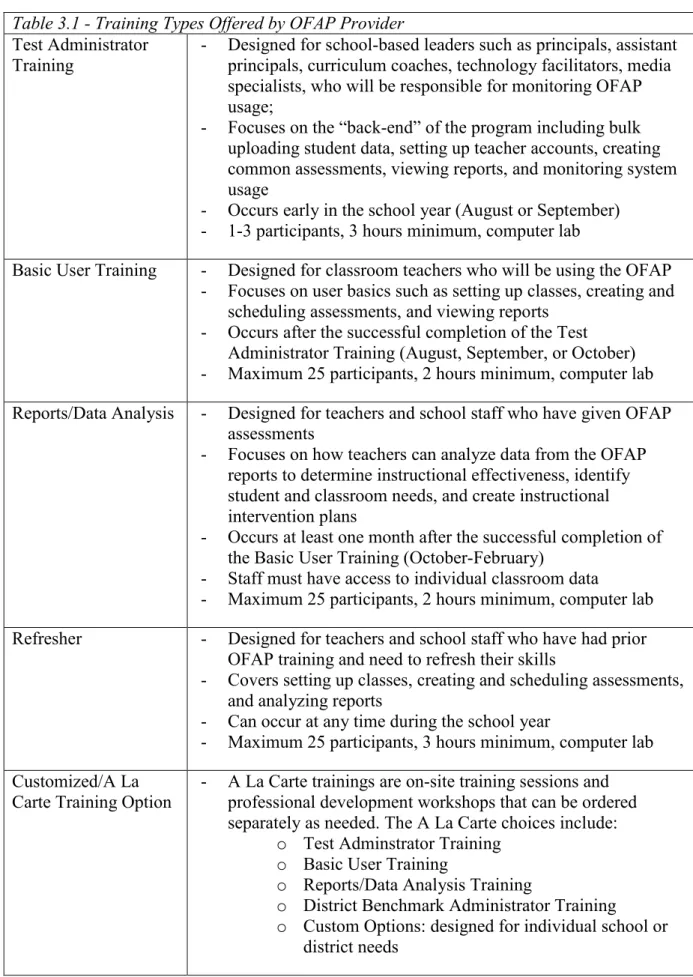
Table 3.1 - Training Types Offered by OFAP Provider Test Administrator
Training - Designed for school-based leaders such as principals, assistant principals, curriculum coaches, technology facilitators, media specialists, who will be responsible for monitoring OFAP usage;
- Focuses on the “back-end” of the program including bulk uploading student data, setting up teacher accounts, creating common assessments, viewing reports, and monitoring system usage
- Occurs early in the school year (August or September) - 1-3 participants, 3 hours minimum, computer lab
Basic User Training - Designed for classroom teachers who will be using the OFAP - Focuses on user basics such as setting up classes, creating and
scheduling assessments, and viewing reports - Occurs after the successful completion of the Test
Administrator Training (August, September, or October) - Maximum 25 participants, 2 hours minimum, computer lab Reports/Data Analysis - Designed for teachers and school staff who have given OFAP
assessments
- Focuses on how teachers can analyze data from the OFAP reports to determine instructional effectiveness, identify student and classroom needs, and create instructional intervention plans
- Occurs at least one month after the successful completion of the Basic User Training (October-February)
- Staff must have access to individual classroom data
- Maximum 25 participants, 2 hours minimum, computer lab Refresher - Designed for teachers and school staff who have had prior
OFAP training and need to refresh their skills
- Covers setting up classes, creating and scheduling assessments, and analyzing reports
- Can occur at any time during the school year
- Maximum 25 participants, 3 hours minimum, computer lab Customized/A La
Carte Training Option - A La Carte trainings are on-site training sessions and professional development workshops that can be ordered separately as needed. The A La Carte choices include:
o Test Adminstrator Training
o Basic User Training
o Reports/Data Analysis Training
o District Benchmark Administrator Training
Student-level achievement data were provided by the North Carolina Department of Public Instruction (NCDPI) through the Division of Accountability Services. Student-level formative assessment data were obtained from a North Carolina-based OFAP provider. These two datasets were merged using unique student identification numbers. The final dataset included one observation for every sixth-, seventh-, and eighth-grade student who
participated in the EOG Reading and Mathematics assessments in 2010-2011 and who was administered at least one Reading or Mathematics assessment using the OFAP. The total sample included 83,799 students at 413 schools. (Descriptive statistics for the demographic variables are included in Table 4.2 of the next chapter.)
Student Achievement Data
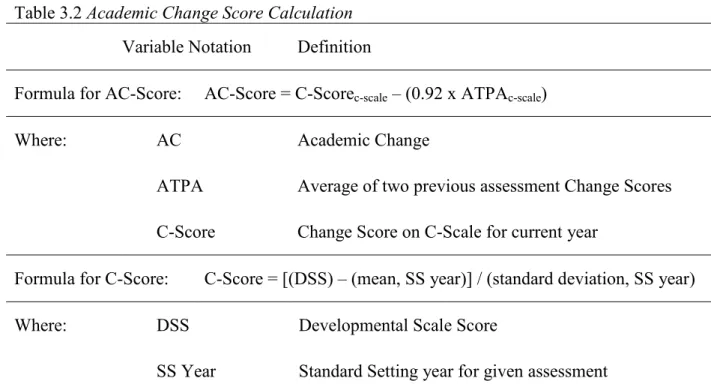
Table 3.2 Academic Change Score Calculation Variable Notation Definition
Formula for AC-Score: AC-Score = C-Scorec-scale – (0.92 x ATPAc-scale)
Where: AC Academic Change
ATPA Average of two previous assessment Change Scores
C-Score Change Score on C-Scale for current year
Formula for C-Score: C-Score = [(DSS) – (mean, SS year)] / (standard deviation, SS year)
Where: DSS Developmental Scale Score
SS Year Standard Setting year for given assessment
Note. 0.92 in the AC-Score formula accounts for regression to the mean.
At-risk student control variables. The NCDPI dataset also included several student-level indicators for students with disadvantaged backgrounds. These included the following:
1) students with an economic disadvantage (EDS); 2) students with limited English proficiency (LEP); and 3) students with a learning disability (SWD).
Additional information on these subgroups can be found in the Guide to Career and Technical Education’s Special Populations – Challenge Handbook on the NCDPI website (North Carolina Department of Public Instruction, 2011). The demographics for these indicators are shown in Table 4.2 of the next chapter. Based on the at-risk subgroups
identified by the NEA (2012), gender and race were also included as control variables for this study.
were the reference group (coded 0) and females were coded 1. Caucasians served as the reference group for race (coded 0) and dummy variables were created for each of the other racial groups (Asian, African American, Hispanic, and Other) where 1 indicates that the individual belongs to that category.
Formative Assessment Data
Independent variables. The data provided by the OFAP included one observation for every North Carolina student in sixth, seventh, or eighth grade, who took at least one math or reading assessment using the OFAP in the 2010-2011 school year. Each student record included the total number of formative assessment administrations by subject.
Examples of the formative assessment items as well as an objective-based report sample are provided in Figures A1 through A3 of Appendix A. In addition, assessments administered using the OFAP were classified into two categories to indicate differing cycle length. The two categories – short-cycle and long-cycle – were designated based on the assessment cycle categories developed by Wiliam and Thompson (2007) and illustrated in Table 2.2 of the previous chapter. A detailed description of the difference between the two assessment classifications is provided in the next section of this chapter. The total number of
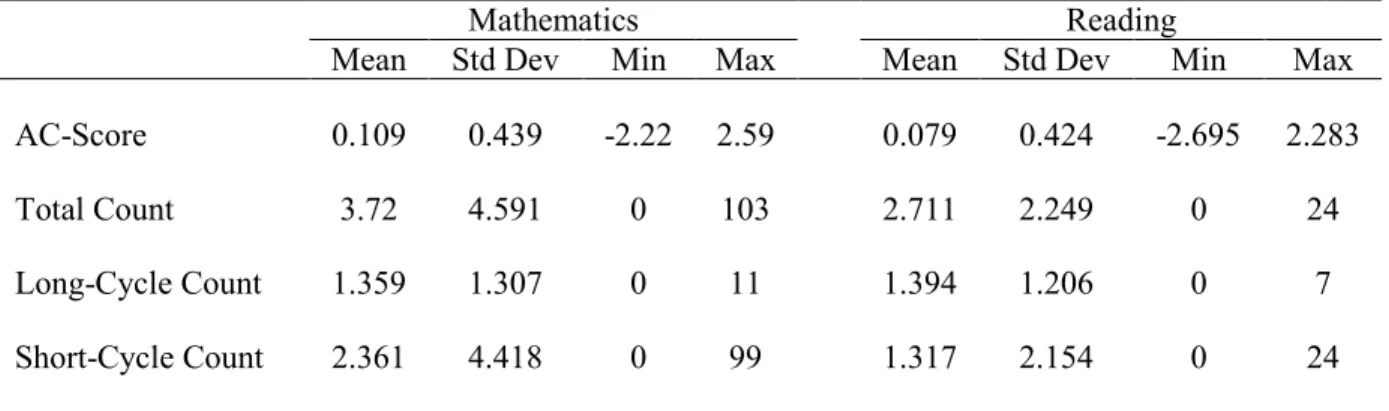
mathematics and reading assessments given for each of the cycle-length categories was also included in order to investigate whether assessment cycle-length has a significant effect on the relationship between formative assessment frequency and student achievement. Basic descriptive statics for the OFAP assessment data are shown in Table 4.1.
Carolina Standard Course of Study which can be found on the NCDPI website. The short cycle-length designation was ascribed based on the nature of the assessment (i.e. assessment administered by the instructor in the classroom) and the feedback loop. SCAs are available as pre-packaged quizzes and also as customizable quizzes. Pre-packaged quizzes are
10-question quizzes constructed by the OFAP contractor and made available to all instructors at OFAP enrolled schools, for classroom use. Instructors also have the ability to construct their own objectives-based quizzes, using items from the OFAP item bank. Each question in the OFAP item bank is designated by objective and difficulty-level, which have been ascribed by item writers, contracted by the OFAP provider. Before items can be added to the OFAP item pool, they are vetted by multiple educational professionals (also contracted by the OFAP) in order to ensure that the appropriate difficulty level and objective has been designated. The provision of these designations allows teachers to design assessments specifically to suit the needs of individual students.
In summary, the primary differences between SCAs and LCAs are 1) the length of the assessment (10-15 items vs. 30-50 items), 2) the breadth of material included (single
objective vs. multiple objectives, and 3) the ability to tailor assessments to particular
students’ needs. By distinguishing SCAs from LCAs, any differences in student mathematics and reading achievement based on the cycle-length that was used to assess the student should be evidenced.
Statistical Methods
Given the nested nature of educational data, a multi-level model approach was employed to address the following specific research questions:
1. What are the effects of formative assessment frequency on student AC-Scorefor each subject?
2. Do the effects of the formative assessment frequency differ based on assessment cycle-length?
3. Do the effects of the formative assessment frequency differ for at-risk student subgroups (gender, race, EDS, LEP, and SWD)?
4. Do the effects of the formative assessment frequency differ based on school-level at-risk characteristics (%EDS, %Minority)?
5. Do the effects of the formative assessment frequency differ based on school-level assessment cycle length characteristics (Mean SCAs, Mean LCAs)?
AC-Unconditional Means Model
Each model was built from the bottom up. The first step was fitting an unconditional model for each content area. The unconditional model estimates the dependent variable without consideration of level 1 or level 2 predictors. These estimates provide a reference point for comparison to more parameterized models. Table 3.2 presents the model in two common forms. The Multi-Level model presents equations for each level whereas the Mixed-Effects model presents one single level-1 equation in which γ00 represents the grand mean AC-Score for the given subject across all students, u0j represents the variability in AC-Score between schools, and rij represents the variability in AC-Score between students (i.e. the random error associated with ith student in the jth school). The term Yij represents the estimated student AC-Score for the given content area in both models and the term β0j represents the sum of an intercept for the student’s school in the Multi-Level Model. Both forms of the model formula were provided in this initial presentation to provide a reference point for readers who may only be familiar with one form or the other. From here on the formulas will be presented in the mixed-effects model format only.
Table 3.3 Unconditional Model
Multi-Level Model Mixed-Effects Model Level 1: Yij = β0j + rij
Level 2: β0j = γ00 + u0j
Yij = γ00 + u0j + rij
Intraclass Correlation Coefficient. The unconditional model, in addition to providing a reference point from which to compare more complex models, also provides the information necessary to calculate the intraclass correlation coefficient (ICC) and design effect.
effect is defined by McCoach (2010, p. 134) as, “the degree to which the parameter
estimates’ standard errors are underestimated when assuming independence.” The equation for design effect utilizes the ICC and average cluster size, and is illustrated in Equation 2.
𝜌
=
σ𝑢02(σ𝑢02 +σ𝑟2) (1)
where:
ρ
= intraclass correlation coefficientσ
𝑢02 = between-school varianceσ
𝑟2 = variance between students within schools𝑑𝑒𝑠𝑖𝑔𝑛
𝑒𝑓𝑓𝑒𝑐𝑡
=
�
1 +
𝜌
(
𝑛�
𝑗– 1)
(2)
where:
ρ
=intraclass correlation coefficient
𝑛�
𝑗 =mean school sizeRandom Coefficients Model
The second step of the model building process was to estimate a random coefficients model in which only level-1 predictors were included. In order to address Research Question 1, each random coefficients model was fit with a variable representing the total number of formative assessments taken along with control variables for gender, race, and at-risk
students (EDS, LEP, and SWD). The formative assessment frequency, EDS, LEP, and SWD variables were all initially estimated as randomly varying by school. Any variance
components determined to be statistically non-significantly different from 0 were then fixed. The control variables for race and gender were estimated as fixed across schools. All
and one for long-cycle assessments (LCAs). The model used going forward (total
assessment count model vs. assessment count by cycle-length model) was the model with the better fit to the data. The equation for the total number of assessments (regardless of cycle-length) is presented in Table 3.3. The equation for the cycle-length specific model is
presented in Table 3.4. It is important to note that, whereas all of these variables were present in the initial iteration of the analysis, any variables that were determined to be
non-statistically significant were subsequently eliminated from the model. Therefore, the
formulas presented below are the starting point and are subject to change based on statistical evidence.
Table 3.4 Random Coefficient – Mixed-Effects Model (Total Assessments)
Yij = [γ00 + γ10(TotalAssmts)ij + γ20(Gender)ij + γ30(Asian)ij + γ40(AfrAm)ij + γ50(Hisp)ij + γ60(Other)ij + γ70(EDS)ij + γ80(LEP)ij + γ90(SWD)ij] +
(fixed effects)
[u0j + u1j(TotalAssmts)ij + u2j(EDS)ij + u3j(LEP)ij + u4j(SWD)ij + rij]
(random effects)
Where:
γ00 school mean AC-Score (intercept) when all other predictors are 0 γ10(TotalAssmts)ij slope for total number of formative assessments predictor
γ20(Gender)ij slope for gender
γ30(Asian)ij slope for Asian students
γ40(AfrAm)ij slope for African American students γ50(Hisp)ij slope for Hispanic students
γ60(Other)ij slope for students of Other race/ethnicity γ70(EDS)ij slope for EDS students
γ80(LEP)ij slope for LEP students γ90(SWD)ij slope for SWD students
u1j(TotalAssmts)ij variability in slope for total number of formative assessments u2j(EDS)ij variability in slope for EDS students
u3j(LEP)ij variability in slope for LEP students u4j(SWD)ij variability in slope for SWD students
Table 3.5 Random Coefficient – Mixed-Effects Model (Cycle-Length Specific)
Yij = [γ00 + γ10(SCAs)ij + γ20(LCAs)ij + γ30(Gender)ij + γ40(Asian)ij + γ50(AfrAm)ij + γ60(Hisp)ij + γ70(Other)ij + γ80(EDS)ij + γ90(LEP)ij + γ100(SWD)ij] +
(fixed effects)
[u0j + u1j(SCAs)ij + u1j(LCAs)ij + u3j(EDS)ij + u4j(LEP)ij + u5j(SWD)ij + rij]
(random effects)
Where:
γ10(SCAs)ij slope for total number of short-cycle assessments predictor γ20(LCAs)ij slope for total number of long-cycle assessments predictor u1j(SCAs)ij variability in slope for short-cycle assessments predictor u2j(LCAs)ij variability in slope for long-cycle assessments predictor
Note: The terms Yij, u0j, andrij were defined previously in this chapter; all other terms are defined in Table 3.3;
Once both models have been fit, deviance statistics were calculated for each model in order to determine which model (total assessment count model vs. assessment count by cycle-length model) provided a better fit for the data. Once this decision was made, and in order to address Research Question 3, the better fit model was tested for interaction effects between the at-risk student variables and the variable(s) chosen to represent formative assessment frequency (either total assessment count or SCAs and LCAs). This step served to determine if the effect of formative assessment frequency on student achievement varies for different at-risk student sub-groups (EDS, LEP, SWD). These interaction terms were initially allowed to randomly vary across schools. Any variance components determined to be
statistically non-significantly different from 0 were then fixed. Any statistically significant interactions were retained in the model as long as the addition resulted in an improved model fit. The equation for the total number of assessments (regardless of cycle-length) with
Table 3.6 Random Coefficient – Total Assessments Model with Interactions
Yij = [γ00 + γ10(TotalAssmts)ij + γ20(Gender)ij + γ30(Asian)ij + γ40(AfrAm)ij + γ50(Hisp)ij + γ60(Other)ij + γ70(EDS)ij + γ80(LEP)ij + γ90(SWD)ij + γ100(TotalAssmts)ij*(EDS)ij +
γ110(TotalAssmts)ij*(LEP)ij + γ120(TotalAssmts)ij*(SWD)ij] + (fixed effects)
[u0j + u1j(TotalAssmts)ij + u2j(EDS)ij + u3j(LEP)ij + u4j(SWD)ij + u5j(TotalAssmts)ij*(EDS)ij + u6j(TotalAssmts)ij*(LEP)ij +
u7j(TotalAssmts)ij*(SWD)ij + rij]
(random effects)
Where:
γ100(TotalAssmts)ij*(EDS)ij slope for interaction between total number of formative assessments predictor and EDS γ110(TotalAssmts)ij*(LEP)ij slope for interaction between total number of
formative assessments predictor and LEP γ120(TotalAssmts)ij*(SWD)ij slope for interaction between total number of
formative assessments predictor and SWD u5j(TotalAssmts)ij*(EDS)ij variability in slope for interaction between total
number of formative assessments predictor and EDS
u6j(TotalAssmts)ij*(LEP)ij variability in slope for interaction between total number of formative assessments predictor and LEP
u7j(TotalAssmts)ij*(SWD)ij variability in slope for interaction between total number of formative assessments predictor and SWD
Note: The terms Yij, u0j, andrij were defined previously in this chapter; all other terms not defined in this table are
Table 3.7 Random Coefficient – Cycle-Length Specific Model with Interactions
Yij = [γ00 + γ10(SCAs)ij + γ20(LCAs)ij + γ30(Gender)ij + γ40(Asian)ij + γ50(AfrAm)ij + γ60(Hisp)ij + γ70(Other)ij + γ80(EDS)ij + γ90(LEP)ij + γ100(SWD)ij + γ110(SCAs)ij*(EDS)ij + γ120(SCAs)ij*(LEP)ij + γ130(SCAs)ij*(SWD)ij + γ140(LCAs)ij*(EDS)ij + γ150(LCAs)ij*(LEP)ij + γ160(LCAs)ij*(SWD)ij] +
(fixed effects)
[u0j + u1j(SCAs)ij + u1j(LCAs)ij + u3j(EDS)ij + u4j(LEP)ij + u5j(SWD)ij + u6j(SCAs)ij*(EDS)ij + u7j(SCAs)ij*(LEP)ij + u8j(SCAs)ij*(SWD)ij + u9j(LCAs)ij*(LEP)ij + u10j(LCAs)ij*(SWD)ij + u11j(LCAs)ij*(LEP)ij + rij]
(random effects)
Where:
γ110(SCAs)ij*(EDS)ij slope for interaction between total number of short-cycle assessments predictor and EDS
γ120(SCAs)ij*(LEP)ij slope for interaction between total number of short-cycle assessments predictor and LEP
γ130(SCAs)ij*(SWD)ij slope for interaction between total number of short-cycle assessments predictor and SWD
γ140(LCAs)ij*(EDS)ij slope for interaction between total number of long-cycle assessments predictor and EDS
γ150(LCAs)ij*(LEP)ij slope for interaction between total number of long-cycle assessments predictor and LEP
γ160(LCAs)ij*(SWD)ij slope for interaction between total number of long-cycle assessments predictor and SWD
u6j(SCAs)ij*(EDS)ij variability in slope for interaction between total number of short-cycle assessments predictor and EDS
u7j(SCAs)ij*(LEP)ij variability in slope for interaction between total number of short-cycle assessments predictor and LEP
u8j(SCAs)ij*(SWD)ij variability in slope for interaction between total number of short-cycle assessments predictor and SWD
u9j(LCAs)ij*(EDS)ij variability in slope for interaction between total number of long-cycle assessments predictor and EDS
u10j(LCAs)ij*(LEP)ij variability in slope for interaction between total number of long-cycle assessments predictor and LEP
u11j(LCAs)ij*(SWD)ij variability in slope for interaction between total number of long-cycle assessments predictor and SWD
Note: The terms Yij, u0j, andrij were defined previously in this chapter; all other terms are defined in Table 3.3;
Full Contextual Model
as well as percentage of minority students (%Minority) for the given school were added to the model. In order to address Research Question 5, variables representing assessment frequency average for the given school were added to the model. If the total assessments count model was determined to be the best fit model, the school total number of assessments mean was used. However, if the assessment count by cycle-length model was determined to have the best fit, two school-level means were added – one for mean number of SCAs and one for mean number of LCAs. In the full contextual model formulas illustrated in Tables 3.7 (total assessment count model) and 3.8 (assessment count by cycle-length model) the level-2 variables predicted variance in the intercept. As was done with the random coefficients model, any statistically non-significant variables were eliminated in an effort to retain the most parsimonious model possible.
Table 3.8 Full Contextual – Mixed-Effects Model (Total Assessments)
Yij = [γ00 + γ01(%EDS)j + γ02(%Minority)j + γ03(MeanAssmts)j + γ10(TotalAssmts)ij + γ20(Gender)ij + γ30(Asian)ij + γ40(AfrAm)ij + γ50(Hisp)ij + γ60(Other)ij + γ70(EDS)ij + γ80(LEP)ij + γ90(SWD)ij + γ100(TotalAssmts)ij*(EDS)ij + γ110(TotalAssmts)ij*(LEP)ij +
γ120(TotalAssmts)ij*(SWD)ij] + (fixed effects)
[u0j + u1j(TotalAssmts)ij + u2j(EDS)ij + u3j(LEP)ij + u4j(SWD)ij + u5j(TotalAssmts)ij*(EDS)ij + u6j(TotalAssmts)ij*(LEP)ij +
u7j(TotalAssmts)ij*(SWD)ij + rij]
(random effects)
Where:
γ01(%EDS)j slope for percentage of EDS students at school j γ02(%Minority)j slope for percentage of minority students at school j
γ03 (MeanAssmts)j slope for mean number of formative assessments at school j
Table 3.9 Full Contextual – Mixed-Effects Model (Cycle-Length Specific)
Yij = [γ00 + γ01(%EDS)j + γ02(%Minority)j + γ03(MeanSCAs)j + γ04(MeanLCAs)j + γ10(SCA)ij + γ20(LCA)ij + γ30(Gender)ij + γ40(Asian)ij + γ50(AfrAm)ij + γ60(Hisp)ij +
γ70(Other)ij + γ80(EDS)ij + γ90(LEP)ij + γ100(SWD)ij+ γ110(SCAs)ij*(EDS)ij + γ120(SCAs)ij*(LEP)ij + γ130(SCAs)ij*(SWD)ij + γ140(LCAs)ij*(EDS)ij +
γ150(LCAs)ij*(LEP)ij + γ160(LCAs)ij*(SWD)ij] + (fixed effects)
[u0j + u1j(SCAs)ij + u1j(LCAs)ij + u3j(EDS)ij + u4j(LEP)ij + u5j(SWD)ij + u6j(SCAs)ij*(EDS)ij + u7j(SCAs)ij*(LEP)ij + u8j(SCAs)ij*(SWD)ij + u9j(LCAs)ij*(LEP)ij + u10j(LCAs)ij*(SWD)ij + u11j(LCAs)ij*(LEP)ij + rij]
(random effects)
Where:
γ01(%EDS)j slope for percentage of EDS students at school j γ02(%Minority)j slope for percentage of minority students at school j
γ03(MeanSCAs)j slope for mean number of short-cycle assessments at school j γ04(MeanLCAs)j slope for mean number of long-cycle assessments at school j
Note: The terms Yij, u0j, andrij were defined previously in this chapter; all other terms are defined in Table 3.3;
Once the model was determined to be satisfactory, in order to address Research Questions 4 and 5, interactions between relevant school-level variables and assessment and the variable(s) chosen to represent formative assessment frequency (either total assessment count or SCAs and LCAs) were tested. In the full contextual model formulas illustrated in Tables 3.9 (total assessment count model) and 3.10 (assessment count by cycle-length model) the level-2 variable interaction terms predicted variance in the level-1 slopes. Any
statistically significant interactions were retained for the final model. The full contextual model equation for the total number of assessments (regardless of cycle-length) with