GENERATIONAL DIFFERENCES IN TRAINING, JOB SATISFACTION, AND INTENT TO LEAVE AMONG THE STATE GOVERNMENTAL PUBLIC HEALTH AGENCY
WORKFORCE
Brian Christopher Castrucci
A dissertation submitted to the faculty at the University of North Carolina at Chapel Hill in partial fulfillment of the requirements for the degree of Doctor of Public Health in the Department of
Health Policy and Management in the Gillings School of Global Public Health.
Chapel Hill 2018
© 2018
ABSTRACT
Brian Christopher Castrucci: Generational Differences in Training, Job Satisfaction, and Intent to Leave among the State Governmental Public Health Agency Workforce
(Under the direction of Leah M. Devlin)
“Entitled,” “lazy,” “narcissistic,” “glued to their phones,” “high maintenance in the workplace.” These descriptors of Millennials come from a brief sampling of blogs from trusted publications like Inc. and Entrepreneur. In a 2013 cover of Time Magazine, Millennials were deemed the “Me Me Me Generation” with the subheading “Millennials are lazy, entitled narcissists who still live with their parents.” However, for the state governmental public health agency workforce, no previous studies have examined this negative Millennial narrative. This work tackles three separate, but related research questions to provide the first ever insight on generational differences in the state governmental public health agency workforce.
The analyses completed here yield many findings. The key messages that most directly inform change include:
Millennials working in state governmental public health agencies have
better attitudes toward workplace training compared to other generations Millennials working in state governmental public health agencies have
Millennials working in state governmental public health agencies are just
as satisfied with their jobs as other generations
Millennials working in state governmental public health agencies are
considering other workplaces compared to other generations
Millennials working in state governmental public health agencies have at
least equal, if not better, workplace attitudes and experiences compared to other generations
This discordance between the popular impressions of Millennials and information presented here highlights the presence of a destructive Millennial myth narrative. Persistence of this myth has the potential to alienate Millennial staff and allows for a more aligned effort to skill building in the workforce, which could potentially yield cost and time savings.
ACKNOWLEDGEMENTS
One thing you know when you see a turtle on a fence post, you know it didn’t get there alone. This dissertation is my fence post, and I certainly didn’t get here alone. I thank my advisor, Leah Devlin, for her encouragement. She was the nagging voice in my head that I needed to get this done with competing priorities at work. Ed Baker and Hugh Tilson both encouraged me from before I started the program through completion. I benefited from their wisdom and tough love” throughout this process. Sandra Greene and Asheley Cockrell Skinner were outstanding committee members whose insightful feedback and knowledge of how to traverse this weird journey proved extremely valuable.
None of this would have been possible without the support of the de Beaumont Foundation, where I have worked for the past six years and am currently the chief executive officer (CEO). Particular thanks are owed to James B. Sprague, MD, the Foundation’s founding and current chairman and founding CEO. Dr. Sprague encouraged me to pursue this degree and wrote the policy to provide the financial support that made this degree possible. I wouldn’t be here without Dr. Sprague’s support. The data I used for this dissertation also came from a much larger project approved by the Foundation’s board. This dissertation is just one example of the impact of the Public Health Workforce Interests and Needs Survey has had on the fields of governmental public health and workforce research. Lastly, as we often say after Foundation events, “Thank you, Pete.”
TABLE OF CONTENTS
LIST OF TABLES ... xiii
CHAPTER 1: INTRODUCTION ... 1
Statement of the issue... 1
Significance ... 2
Background ... 3
Approach ... 7
Institutional Review Board and other Ethical Considerations ... 7
Challenges with Generational Research ... 8
How to Read This Dissertation ... 9
CHAPTER 2: GENERATIONAL DIFFERENCES IN ATTITUDES TOWARD TRAINING SUPPORT AND SELF-IDENTIFIED TRAINING NEEDS IN A NATIONAL SAMPLE OF STATE GOVERNMENTAL PUBLIC HEALTH AGENCY EMPLOYEES ... 12
Background ... 12
Millennials and Training ... 14
Research Questions and Implications ... 14
Methods ... 16
Measures ... 18
Generations... 18
Measuring a Learning Culture ... 18
Training Gaps ... 19
Demographic and Workforce Characteristics ... 19
Statistical Analysis ... 20
Results ... 20
Generational Differences in the Perceived Support for Training in State Governmental Public Health Agencies ... 21
Differences in the Training Gaps among the State Governmental Public Health Agency Workforce by Generation ... 21
Discussion ... 23
Tables ... 25
CHAPTER 3: MILLENNIAL SUPPORT & SATISFACTION: GENERATIONAL DIFFERENCES IN ORGANIZATIONAL SUPPORT, SUPERVISORY SUPPORT, AND JOB SATISFACTION AMONG THE STATE PUBLIC HEALTH AGENCY WORKFORCE ... 31
Background ... 31
Generational Theory and Job Satisfaction ... 32
Research Questions and Implications ... 35
Methods ... 36
Measures ... 39
Generations... 39
Organizational and Supervisory Support ... 39
Job Satisfaction ... 40
Demographic and Workforce Characteristics ... 41
Statistical Analysis ... 41
Results ... 42
Discussion ... 43
Tables ... 45
CHAPTER 4: AN EXPLORATION OF MILLENNIALS’ REASONS FOR ENTERING AND INTENT TO LEAVE THE STATE GOVERNMENTAL PUBLIC HEALTH AGENCY WORKFORCE ... 48
Background ... 48
Nonprofits v. Government: The Changing Perceptions of Government ... 50
Research Questions and Implications ... 52
Methods ... 53
Data Sources ... 53
Measures ... 55
Initial Reasons for Entering Public Health ... 55
Satisfaction... 57
Intentions to Leave Organization ... 57
Statistical Analysis ... 58
Results ... 58
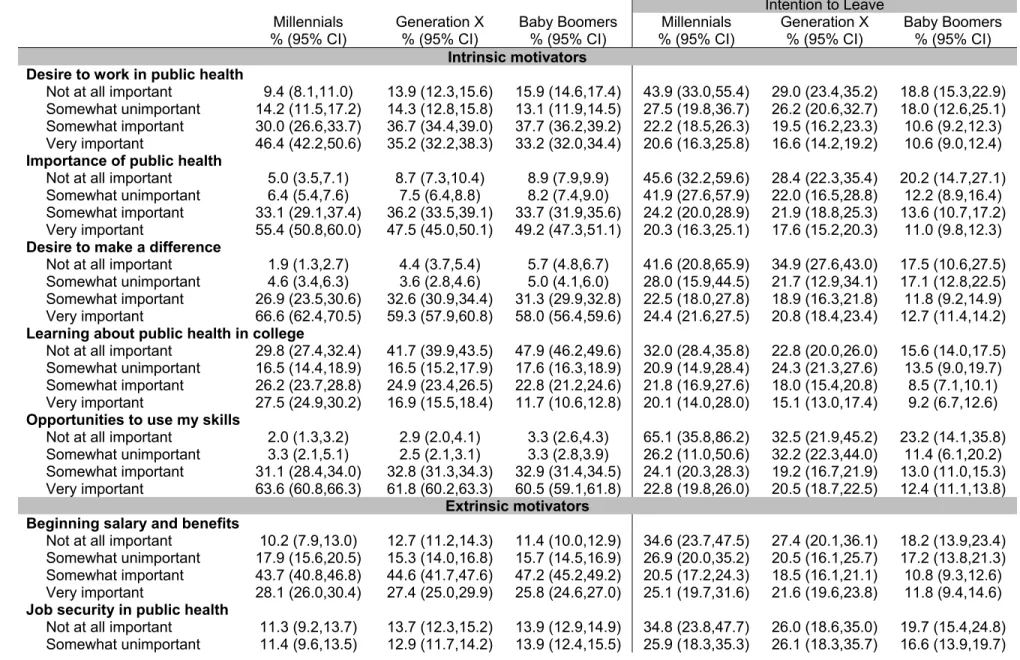
Intrinsic Motivators ... 59
Extrinsic Motivators ... 60
Supervisory Support ... 60
Organizational Support ... 61
Employee Engagement ... 61
Job, Organization, Pay, and Job Security Satisfaction ... 62
Discussion ... 64
Tables ... 67
CHAPTER 5: A PLAN FOR CHANGE ... 75
Destructive millennial myth narrative ... 75
Defining the Audience ... 77
DIssemination of Key Findings ... 78
Generating Practical Guidance and implementing the findings ... 81
LIST OF TABLES
Table
1.1. Four Generations in the Workforce ... 6 1.2. Research Questions by Chapter Title ... 10 2.1. Demographic and Workforce Characteristics of the State
Governmental Public Health Agency Workforce by Generation ... 25 2.2. Attitudes toward Training among the State Governmental
Public Health Agency Workforce by Generation ... 26 2.3. Adjusted Odds Ratios (OR) of Positive Attitudes toward Training* ... 27 2.4. Training Needs among the State Governmental Public
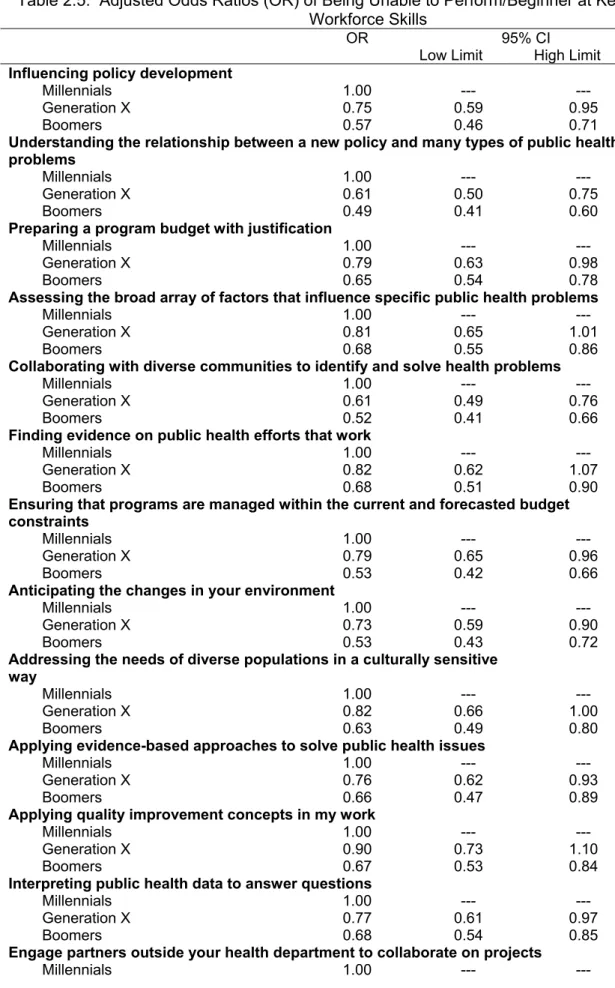
Health Agency Workforce by Generation ... 28 2.5. Adjusted Odds Ratios (OR) of Being Unable to
Perform/Beginner at Key Workforce Skills ... 29 3.1. Association between Supervisory Support and Being
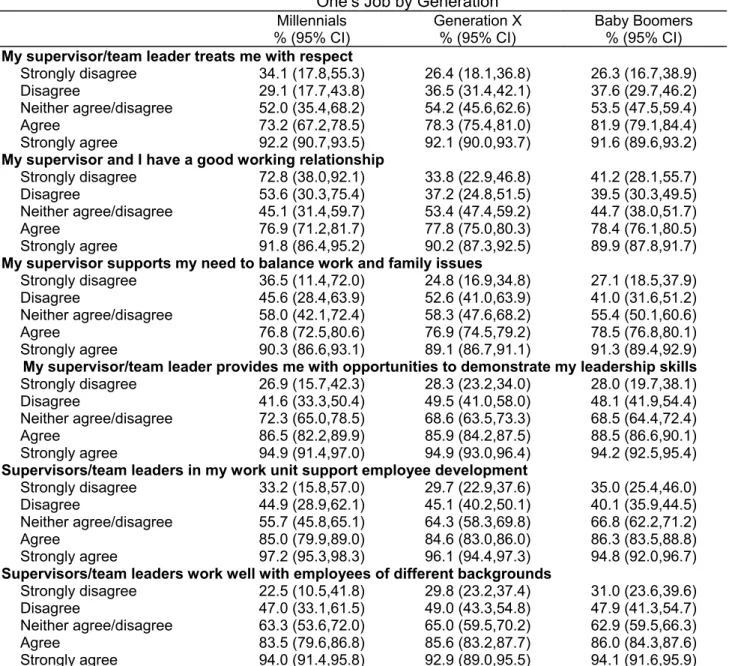
Somewhat or Very Satisfied with One’s Job by Generation ... 45 3.2. Association between Organizational Support and Being
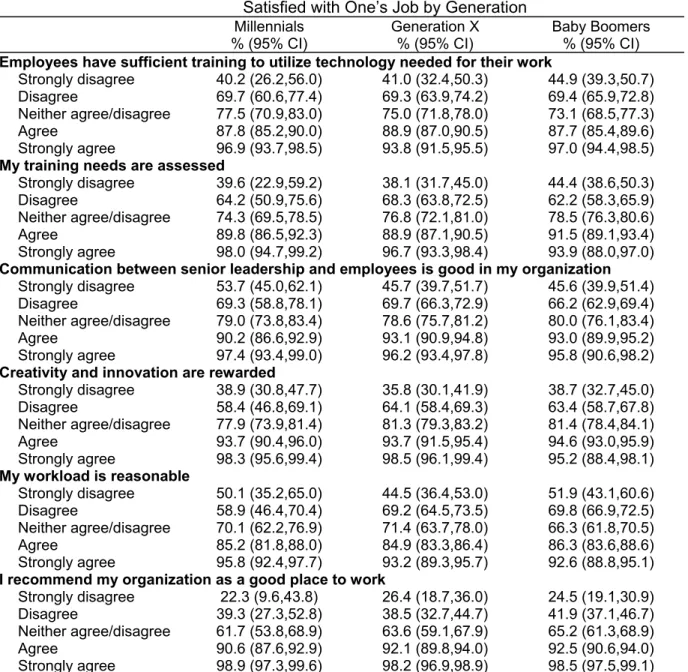
Somewhat or Very Satisfied with One’s Job by Generation ... 46 3.3. Results of Multivariate Logistic Regression on Supervisory
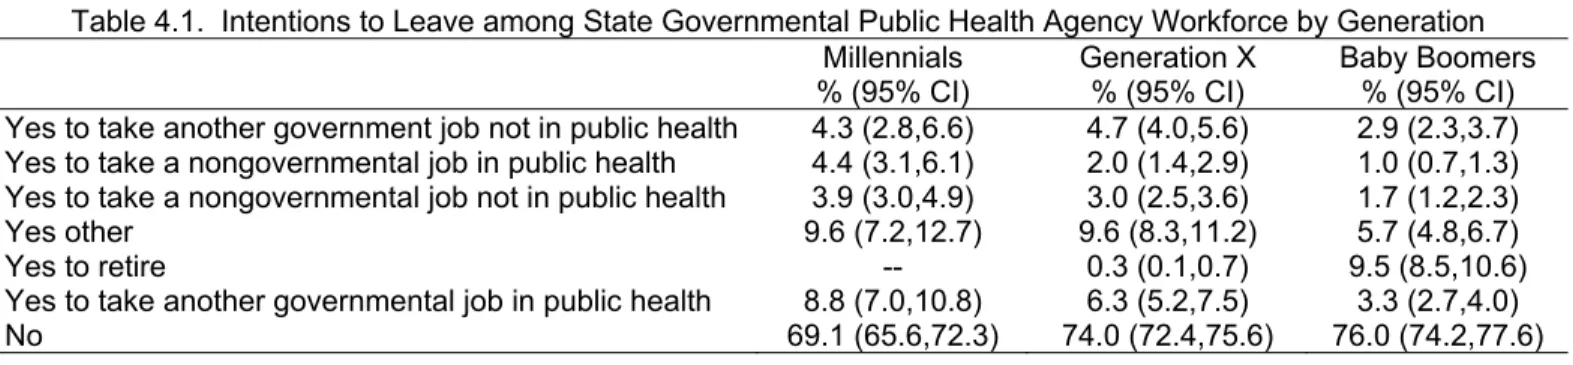
Support and Organizational Support as Correlates of Job Satisfaction ... 47 4.1. Intentions to Leave among State Governmental Public
Health Agency Workforce by Generation ... 67 4.2. Reasons for Entering Public Health among the State
Governmental Public Health Agency Workforce by Generation
and Intention to Leave ... 68 4.3. Supervisory Support among the State Governmental
Public Health Agency Workforce by Generation and Intention to Leave .... 70 4.4. Organizational Support among the State Governmental
Public Health Agency Workforce by Generation and Intention to Leave .... 71 4.5. Employee Engagement among the State Governmental
Public Health Agency Workforce by Generation and Intention to Leave .... 72 4.6. Job, Organization, Pay, Job Security Satisfaction among
Generation and Intent to Leave ... 73 4.7. Adjusted Odds of Intention to Leave by Generation ... 74
CHAPTER 1: INTRODUCTION
STATEMENT OF THE ISSUE
This is a time of unprecedented health transformation. Disparities of all types (rural, age, race, gender) are steady, if not increasing.(Akinboro et al., 2016; Jennings & Gaither, 2015; Owen, Goldstein, Clayton, & Segars, 2013; Plescia & Emmanuel, 2014; Stanbury & Rosenman, 2014) Climate change,(Bowles, Butler, & Morisetti, 2015; Machalaba et al., 2015; Patz, Frumkin, Holloway, Vimont, & Haines, 2014)
opioids,(Dowell, Haegerich, & Chou, 2016; Schmidt, Haddox, Nielsen, Wakeland, & Fitzgerald, 2015; Shei et al., 2015) and mental health (Bernardini-Zambrini, 2014; de Jong et al., 2015; Saraceno & Zullino, 2013; Stewart-Brown, 2015) are new, emerging, and challenging problems. However, new science and technologies bring exciting opportunities to improve health. Tackling these problems and leveraging these technologies requires that the state governmental public health workforce be vibrant, diverse, and competent in the skills necessary to maintain and increase life expectancy. It is against this backdrop that generational analyses can inform workforce recruitment and retention.
For the first time, there are multiple generations existing simultaneously in the US workforce with Baby Boomers, Generation X, and Millennials accounting for
generation in the workforce (53.5 million) followed by Generation X (52.7 million) and the Baby Boomers (44.6 million).(Fry, 2015)
Analysis of the 2014 Public Health Workforce Interests and Needs Survey (PH WINS) confirms an impending exodus from the state governmental public health agency workforce.(Sellers et al., 2015) Nearly 40% of the state governmental public health agency workforce reports an intention to leave by 2020.(Liss-Levinson, Bharthapudi, Leider, & Sellers, 2015) One fifth of the workforce reports an intention to leave in the next year.(Liss-Levinson et al., 2015) The replacement workforce will need to come from the Millennial generation. Failing to understand the generational dynamics in the state governmental public health agency workforce and tailor appropriate workforce policies and strategies to recruit, support, and retain Millennials could exacerbate a serious problem of a weakened public health system that potentially jeopardizes many of the gains in life expectancy achieved through the previous century.(Centers for Disease Control and Prevention, 2011)
Understanding this new generation of workers and predicting how this generation may or may not successfully interact with the state governmental public health
infrastructure is central to crafting effective and impactful public health workforce policy and interventions. However, little is known about Millennials in the state governmental public health agency workforce.
SIGNIFICANCE
governmental public health agency workforce. The national trends are clear, but how these population trends apply to the state governmental public health agency workforce is unknown. Without an understanding of the generational dynamics impacting the state governmental public health agency workforce, critical information is unavailable to
workforce planners. These analyses will provide important information that could be applied to tailor and hone workforce recruitment and retention strategies for Millennials throughout state governmental public health agencies nationwide.
BACKGROUND
The term generation is used in two distinct ways. When used in the context of a family, the term is meant to count the years between the birth of each parent and child. Generations defined in this way are intensely personal to the individual family and have no external generalizability. The term generation is also used in a societal context to describe people born in a particular year or group of years. Elwood D. Carlson in The Lucky Few: Between the Greatest Generation and the Baby Boom identified seven US generations.(Carlson, 2008) These are:
The New Worlders (born from 1871-1889)
The Hard Timers (born from 1890-1908)
The Good Warriors (born from 1909-1928)
The Lucky Few (born from 1929-1945)
The Baby Boomers (born from 1946-1964)
Generation X (born from 1965-1982)
While Carson’s calls the newest generation the New Boomers, they are more often referred to as the Millennial generation.(Howe & Strauss, 2009)
Each generation is shaped differently. Generation members share temporal and age-related events such as starting school, entering the workforce, having children, and retiring. While historical events occur simultaneously for multiple generations, each is experiencing these events at different developmental stages with young adulthood being a particularly impressionable developmental stage.(Baltes, Reese, & Lipsitt, 1980; Duncan & Agronick, 1995; Noble & Schewe, 2003) Different social, cultural, political experiences contribute to this identity.(Delli Carpini, 1989; Drew, 2015; Webb-Morgan, 2012) For example, the Greatest Generation (born prior to 1928), who would be from 88 years to 100 years of age in 2015,(Pew Research, 2014) were shaped by the Great Depression as children and then experienced World War II either as combatants or through experiences within the war’s home front. These experiences had a universal impact on those being born, growing, maturing, and living in this era.
Millennials have been shaped by the proliferation of the World Wide Web and wireless communication/computing increasing their access to unlimited, global-wide information. For example, at the end of 1995, 0.4% of the world’s population used the internet.(Internet World Stats, 2015) This proportion increased to 5.8% by 2000 and to 42.4% by 2014.(Internet World Stats, 2015) Between 2004 and 2008, cellular phone ownership among adolescents increased 58% to near equal proportions to
Each generation has characteristics that it believes make it unique. In 2010, the Pew Research Center found 61% of Millennials, roughly half of all Generation Xers, and approximately 60% of Baby Boomers believed their generation has a unique and
distinctive identity.(Pew Research, 2010) Among this group, respondents were asked about what makes their generation unique. Nearly a quarter of Millennials reported that their use of technology is what makes the generation distinctive.(Pew Research, 2010) It is integral to their academic, social, economic, and personal lives. For example, 75% of Millennials have a profile on a social networking site compared to 50% of Generation X and 30% of Baby Boomers.(Pew Research, 2010)
This engagement with social media has contributed to the “Look at Me” moniker often ascribed to the Millennials. Comparatively, those born before the advent of the Worldwide Web, email, and social networks must adapt to new technologies in order to use them. Given their life long exposure to technology, Millennials excel at multitasking, filtering information, and responding to visual stimulation. However, they may struggle in terms of face-to-face communication and reading non-verbal cues, though this can be learned later in life. While a strong work ethic (Generation Xers: 11%, Baby Boomers: 17%) and being respectful (Generation Xers: 5%, Baby Boomers: 14%) were cited as key characteristics of past generations, these were not determined to be unique characteristics of Millennials while popular culture and clothes were.(Pew Research, 2010)
Boomers are reaching the traditional retirement age, many are continuing to work well into their 60s and 70s, if not longer. This longevity has implications for workforce advancement and entry for younger generations.(Collins, 2003) This means that members of three generations will be in the workforce for a longer duration than in the past. Therefore, the implications of generation on the workforce takes on greater
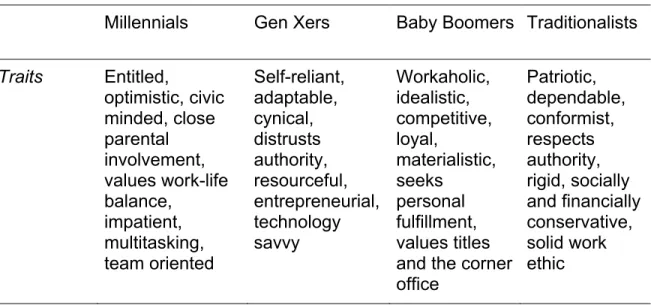
importance. In The Trophy Kids Grow Up: How the Millennial Generation is Shaking Up the Workplace, Alsop identified the following traits for each of the four generations currently in the US workforce.(Alsop, 2008)
Table 1.1. Four Generations in the Workforce
Millennials Gen Xers Baby Boomers Traditionalists
Traits Entitled, optimistic, civic minded, close parental involvement, values work-life balance, impatient, multitasking, team oriented Self-reliant, adaptable, cynical, distrusts authority, resourceful, entrepreneurial, technology savvy Workaholic, idealistic, competitive, loyal, materialistic, seeks personal fulfillment, values titles and the corner office Patriotic, dependable, conformist, respects authority, rigid, socially and financially conservative, solid work ethic
issues in the state governmental public health agency workforce. A brief search of the National Library of Medicine using PubMed found no articles on generational
differences in the state governmental public health agency workforce. A search using the terms “Millennials” and “Public Health” yielded 26 articles. There were several articles that addressed the challenges of educating Millennials with articles focusing on practice primarily addressed either nursing or medicine. There was only one article that addressed the in-place workforce, and it addressed the health professions, generally. To further explore the availability of literature, a second search was performed using the terms “Millennials” and “Workforce.” Sixteen articles were returned as a result of that search. All related to clinical medicine or healthcare. This demonstrates the significant gap in the existing literature and the need for empirical research.
APPROACH
PH WINS is first nationally representative sample of the state governmental public health agency workforce. It was fielded in 37 states in the Fall 2014. The PH WINS data are the only available data that can be applied to generational questions in the state governmental public health agency workforce. This research will capitalize on this novel, innovative dataset to explore generational differences in the state
governmental public health agency workforce for the first time. This work tackles three separate, but related research questions to provide the first ever insight on generational differences in the state governmental public health agency workforce.
Institutional Review Board and other Ethical Considerations
secondary dataset. The analyses pose no threat to the confidentiality of the participants and have no ethical implications.
The de Beaumont Foundation created, funds, and owns the PH WINS data. As a de Beaumont Foundation employee, access is available to variables commonly
redacted in the public use file. These variables, which include the respondent’s state, can potentially lead to confidentiality issues given the limited numbers in some cells. However, to further ensure no potential ethical concerns, the public use research dataset will be used for these analyses.
CHALLENGES WITH GENERATIONAL RESEARCH
There is an inherent limitation when using cross sectional data to explore generational differences that has been previously documented.(Hobcraft, Menken, & Preston, 1985) When using cross sectional data, period, age, and generation are occurring simultaneously and are, therefore, inherently intertwined.(Yang & Land, 2006, 2008) Therefore, the independent effects of each variable are indistinguishable. While cross sectional data controls holds period constant across the sample, the effects of age and generation are still confounded.(Costa & McCrae, 1982) Due to the
age/generation effect, it is unclear as to whether an identified relationship is primarily an age effect – variation due to physiological growth, progression through developmental stages, and accumulation of experience – or a generational effect – variation due to the shared experiences of the same age-group at the same period. Therefore, while a relationship between generation and a specific outcome variable may be identified using cross sectional data, it is not clear if that relationship will persist over time – a
Due to this limitation, caution is required when interpreting findings. However, the impact of this limitation is somewhat moderated in this work for several reasons. First, generational theory provides a framework to understand workforce differences in state governmental public health agencies. As Millennials continue to enter the
workforce through the end of 2020, the results of this research will have immediate implications for workforce policy and strategy. Second, the repeated cross sectional data needed for a hierarchical age-period-cohort model is not currently available in the field of public health.(Fienberg & Mason, 1985)
HOW TO READ THIS DISSERTATION
This dissertation uses the “three manuscripts” option, a first for a DrPH dissertation in this program. Therefore, information for which a reader may be searching may not be in the traditional location. In this option, Chapters 2 through 4 each represent one of the three manuscripts. Chapter 5 will present the Plan for Change. The literature review is included as the Background section in each of the manuscripts, as is typical in the preparation of peer reviewed manuscripts. A separate literature review was prepared for each manuscript that focuses on framing the research questions to be addressed. However, a traditional chapter titled literature review is not included.
Table 1.2.Research Questions by Chapter Title
Chapter Title Research Question(s)
Generational Differences in Attitudes toward Training Support and Self-Identified Training Needs in a National Sample of State Governmental Public Health Agency Employees
Research Question 1. Are there generational differences in the perceived support for training in state governmental public health agencies?
Research Question 2. Are there
differences in the training gaps among the state governmental public health agency
workforce by generation?
Millennial Support & Satisfaction: Generational Differences in Organizational Support, Supervisory Support, and Job Satisfaction among the State Public Health Agency Workforce
Research Question 1. Are there differences in the relationship between supervisory support and organizational support and job satisfaction across the three generational cohorts that account for at least five percent of the state governmental public health agency workforce?
An Exploration of Millennials’ Reasons for Entering and Intent to Leave the State Governmental Public Health Agency Workforce
Research Question 1. Are there differences in the motivations for entering the field of state governmental public health by generation?
Research Question 2. Are there generation differences in the influence of employee motivation for entering public health, workplace perceptions, supervisory
relationships, employment satisfaction, and employee engagement on intentions to leave state governmental public health agency workforce for reasons other than retirement?
This approach (1) was best for the data set proposed, (2) allowed for comprehensive analyses that best supported a thorough Plan for Change with an increased likelihood of implementation, and (3) would facilitate publication
As these are three separate but related manuscripts using the same data set, there are also some natural redundancies that the reader will note between chapters. Each manuscript includes a specific Methods section that includes Data Sources, Measures, and Statistical Analysis. The analyses presented in each chapter employ secondary data analyses of existing quantitative data. As these data are already collected, a thorough description of the data is included in each manuscript in the Data Sources section of the Methods. Each of the three manuscripts explores generational
differences, so the operationalized definition of the generations is presented in each manuscript. The Measures sections located in the Methods in each chapter separately provide the definitions of other key variables used in the analyses. The data analysis plan is included in the Methods section under the heading Statistical Analysis.
CHAPTER 2: GENERATIONAL DIFFERENCES IN ATTITUDES TOWARD TRAINING SUPPORT AND SELF-IDENTIFIED TRAINING NEEDS IN A NATIONAL SAMPLE OF
STATE GOVERNMENTAL PUBLIC HEALTH AGENCY EMPLOYEES
BACKGROUND
For proper and effective function, the governmental public health enterprise requires an adequate supply of well-trained, skilled public health professionals.(Baker et al., 2005) However, this supply is in jeopardy. A recent analysis of the Public Health Workforce Interests and Needs Survey (PH WINS) found that 18% of all state
governmental public health workers plan to leave within the next twelve months and nearly 40% plan to leave by 2020.(Liss-Levinson et al., 2015) These data highlight the recruitment and retention challenge facing the state governmental public health agency workforce. Similar to other disciplines, but possibly even of greater importance given the diversity of the occupations within the broader field of public health, employee training can address skill and knowledge gaps in order to strengthen the technical, scientific, managerial and leadership competence of public health professionals and ensure the optimal operation of state and local health departments.(Goldstein, 1989) Training may also be a way to promote organizational commitment, especially among younger workers.
Generational theory posits that the unique identity of each group influences its values, expectations, and norms both in and out of the workplace.(Howe & Strauss, 2009) Failure to recognize these differences and tailor workplace interactions–both
supervisory and peer-to-peer–appropriately can lead to dissatisfaction and turnover. Entry of Millennials into the state governmental public health agency workforce is necessary for continued operation. Therefore, recruitment and retention of this group should be a priority for those concerned with workforce research and policy.
Millennials’ concern for finding organizations that are socially responsible or provide personal fulfillment over salaries aligns nicely with employment at state
governmental public health agencies.(Macky et al., 2008; Rawlins, Indvik, & Johnson, 2008) However, the bureaucratic structures through which governments accomplish their work may be more off-putting to Millennials.(Gore, 1993; Kristof-Brown,
Zimmerman, & Johnson, 2005; Merton, 1940) For those Millennials who enter to the state governmental public health agency workforce, it will be important to promote
organizational commitment, which is defined as an individual's psychological attachment to an organization.(Lee, Carswell, & Allen, 2000; Meyer & Allen, 1997; Mowday, Steers, & Porter, 1979) Organizational attachment has been shown to be a better predictor of turnover than job satisfaction and employees with strong organizational attachment perform better than employees without lesser attachment.(Mowday, Porter, & Dubin, 1974; Porter, Steers, Mowday, & Boulian, 1974) In developing organizational
commitment, past studies have emphasized the importance of training and
Millennials and Training
Millennials have higher expectations regarding training and development in organizations than previous generations.(Rawlins et al., 2008; Sturges, Guest, Conway, & Davey, 2002) This interest in training may be due to a perceived lack of job security. Millennials may take a more proactive approach toward their own security by
enhancing their employability in the labor market believing that organizational security are rare in today’s workplace.(Macky et al., 2008; Tomlinson, 2007) This may elevate the contribution of training and professional development in the creation of
organizational attachment among Millennials.
It is also important to consider that generations have different preferred learning styles. While classroom style learning may be a preference for Baby Boomers, younger generations prefer on the job learning that maximizes peer-to-peer sharing.(Deal, 2007) This may be especially true for Millennials who draw satisfaction from working with members of a team as an extension of the group-based learning to which they were often exposed during their education.(Alsop, 2008; Howe & Strauss, 2009)
Research Questions and Implications
The literature on training needs among the public health workforce is well developed. Managerial, leadership, and policy development skills are often cited as in need of development.(Honoré, 2014; Lichtveld & Cioffi, 2003) Significant effort has been made to define competencies for public health generally and for specific
generational differences in perceived organizational support for training and training needs is a critical gap in workforce development and may represent a missed opportunity to tailor training more appropriately and support retention efforts.
The present study seeks to contribute to the empirical literature on generational differences in perceptions of support for training and specific training gaps in the context of governmental state public health agencies. Specifically, this study seeks to address two specific research questions:
Research Question 1. Are there generational differences in the perceived
support for training in state governmental public
health agencies?
Research Question 2. Are there differences in the training gaps among the
state governmental public health agency workforce by
generation?
This will be the first study to explore the generational differences in perceived
METHODS
Data Sources
Data used in the analyses for this article were drawn from the 2014 Public Health Workforce Interests and Needs Survey (PH WINS) – specifically, the nationally
representative sample of central office employees of state health agencies (SHAs) in the United States.(Sellers et al., 2015) Developed by the de Beaumont Foundation in partnership with the Association of State and Territorial Health Officials (ASTHO), PH WINS is the largest state governmental public health agency workforce survey of its kind. PH WINS is the only national survey of the state governmental public health agency workforce that collects individual-level data. As such, it is the first and only national data source that allows for investigation of generational differences in the state governmental public health agency.
The methods used in the creation of PH WINS have been described in detail previously.(Leider, Bharthapudi, Pineau, Liu, & Harper, 2015) To summarize, the purpose of PH WINS was to collect individual worker perspectives across all disciplines and geographic regions. The development of PH WINS began in 2013, with a
consensus-building process among 31 public health stakeholders representing an array of disciplines.(Kaufman et al., 2014) A technical expert panel was convened to guide the sampling methodology, instrument creation, and protocols for survey fielding and administration.(Sellers et al., 2015)
Survey,(U. S. Office of Personnel Management, 2008) the US Office of Personnel Management Federal Employee Viewpoint Survey,(U. S. Office of Personnel Management, 2012) the Centers for Disease Control and Prevention Technical
Assistance and Service Improvement Initiative: Project Officer Survey, the Public Health Foundation Public Health Workforce Survey,(Centers for Disease Control and
Prevention, 2013) and the Job in General Scale (abridged).(Balzer et al., 2000) The instrument adapted and used several items from Boulton et al.'s public health workforce taxonomy to ask respondents about occupational classification, program area, degrees and certifications, work setting, and demographics.(Boulton et al., 2014) The research team drafted new questions when appropriate existing items could not be identified. Cognitive interviews were conducted, and the instrument was pretested with three groups of public health practitioners at the state and local levels. The finalized survey was administered online in fall 2014. After pretesting and preliminary psychometric analysis (also explained in depth in previous a previous publication), the instrument was fielded among 37 states from September to December 2014.(Leider et al., 2015) The survey was confidential; contact information was retained only to ascertain whether a potential respondent had indeed responded. No contact information is associated with responses in final PH WINS data sets.
participating states; 19,171 responded for a raw response rate of 48%. After adjusting for noncentral office staff, nonpermanent employee status, undeliverable e-mail
addresses, and those who were no longer in their position, the response rate was 46% (n=10,246). A nationally representative data set of central office staff, defined as permanent employees who work in the central office of the SHA as opposed to having been assigned to local or regional offices, was constructed. A set of weights was calculated using balanced repeated replication to account for differential nonresponse and demographic characteristics.
Measures
Generations
There is no one source that defines the generations. Various authors use slightly different cut points to define each generation. The generation definitions developed by the Pew Research Center were used for this study.(Pew Research, 2014) These are also consistent with the definition used in the Federal Employee Viewpoints Survey. Using this framework, the birth year cut points are:
Millennials: 1981 and after
Generation X: 1965-1980
Baby Boomers: 1946-1964
Silent Generation: 1928-1945
Only generations comprising five percent or more of the state public health agency workforce were included in the analysis eliminating the Silent Generation.
Measuring a Learning Culture
agreement on a 5-point Likert scale ranging from strongly disagree to strongly agree. The statements presented were, “Supervisors/team leaders in my work unit support employee development,” “My training needs are assessed,” “Employees have sufficient training to fully utilize technology needs,” and “Employees learn from one another as they do their work.”
Training Gaps
Respondents were asked to assess 18 different skills, which have been
presented previously.(Sellers et al., 2015) For each skill, respondents were asked to rate the importance of the skill on a 5-point Likert scale ranging from very important to not very important. Separately, respondents were asked to assess their ability to perform the same 18 skills on a 5-point Likert scale ranging from unable to perform to expert. Training needs were assessed by examining the reported ability to perform a skill among those who identified the skill as somewhat or very important.
Demographic and Workforce Characteristics
Statistical Analysis
All analyses for this research were conducted in Stata Version 13 (StataCorp. 2013. Stata Statistical Software: Release 13. College Station, TX: StataCorp LP). To account for the complex sampling design, survey commands included in SPSS were used to produce weighted estimates using balanced repeated replication.
Bivariate analyses were conducted to explore generational differences in demographic and other characteristics as well as attitudes toward training needs and assessed training needs. Logistic regression models will be estimated for each training need to determine the association between generation and specific training needs while adjusting for the influence of other variables.
RESULTS
In 2014, Millennials accounted for 13.2% (95% CI 12.3%-14.2%) of the state governmental public health agency workforce, Generation X accounted for 36.5% (95% CI 35.6%-37.3%), and Baby Boomers accounted for 50.3% (95% CI 49.1%-51.5%). There was minimal variation in the demographics of the state governmental public health agency workforce by generation (Table 2.1). Those reporting Hispanic race/ethnicity increased with each subsequent generation. The major difference
Generational Differences in the Perceived Support for Training in State
Governmental Public Health Agencies
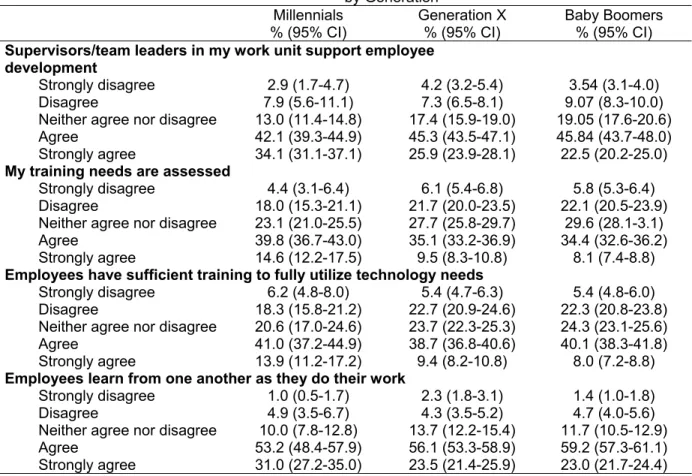
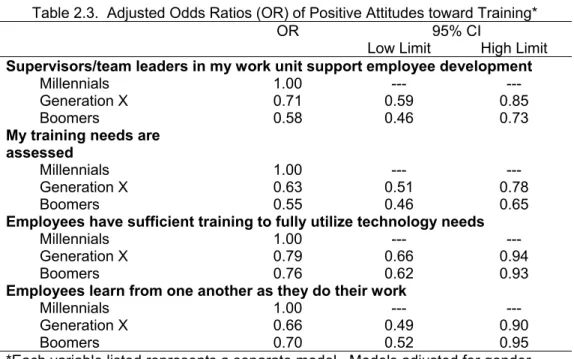
More than half of all respondents, regardless of generation, agreed that “supervisors/team leaders in my work unit support employee development” and “employees learn from one another as they do their work.”(Table 2.2) A greater proportion of Millennials “strongly agreed” with these statements compared to respondents from the other generations. Fewer than half of the respondents from Generation X and Baby Boomers “strongly agreed” or “agreed” that their training needs are assessed and that employees have sufficient training to fully utilize technology needs. However, more than half of Millennials “strongly agreed” or “agreed” to the same statements. After adjusting for other factors, Millennials had more positive
attitudes toward workplace training than did either Generation X or Baby Boomers. The odds of holding positive attitudes did not differ between Generation X and Baby
Boomers.
Differences in the Training Gaps among the State Governmental Public Health
Agency Workforce by Generation
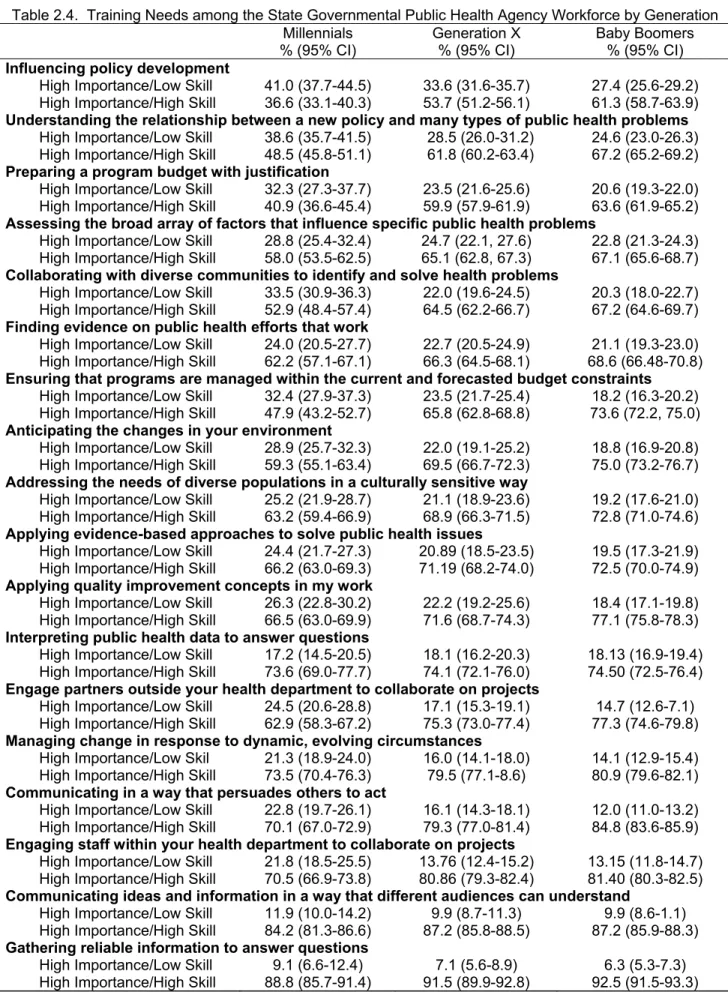
Regardless of generation, “influencing policy development” was the most
commonly cited training gap (respondent indicated high importance but low skill) (Table 2.4). Even among Baby Boomers, more than a quarter of respondents indicated
“influencing policy development” as a training gap. Generally, more than third of Millennial respondents noted training needs for five skills:
“influencing policy development,”
“collaborating with diverse communities to identify and solve health problems,”
“ensuring that programs are managed within the current and forecasted budget
constraints,” and
“preparing a program budget with justification.”
More than a third of Generation X respondents identified “influencing policy
development” as a training gap, but the proportion did not exceed a third of respondents for any other training need. There was no one training gap identified by one third or more of Baby Boomers.
Of the 18 skills assessed, the proportion of Millennials and Generation X identifying the item as a training gap was similar for three:
‘addressing the needs of diverse populations in a culturally sensitive way,’
“applying evidence-based approaches to solve public health issues,” and
“applying quality improvement concepts in my work.”
A greater proportion of Millennials had training gaps compared to Baby Boomers for all skills. There were four items for which there were no differences by generation:
“finding evidence on public health efforts that work,”
“interpreting public health data to answer questions,”
“communicating ideas and information in a way that different audiences can
understand,” and
“gathering reliable information to answer questions.”
assessed, there were no differences in the odds of being unable to perform or being a beginner at a skill between Millennials and Generation X.
DISCUSSION
In the state governmental public health agency workforce, Millennials generally had more positive workplace attitudes toward training than did Generation X or Baby Boomers. This is consistent with previous literature.(Costanza, Badger, Fraser, Severt, & Gade, 2012; Kowske, Rasch, & Wiley, 2010; Zabel, Biermeier-Hanson, Baltes, Early, & Shepard, 2017) The positive attitudes toward training among Millennials working in state governmental public health agencies could be a leverage point when marketing positions to Millennials. Previous research has found that Millennials value
development more than previous generations.(Gallup, 2016; Sayers, 2007) These data suggest that these opportunities may exist in the governmental public health setting and should be shared when recruiting staff.
Informing policy was the most prominent training gaps regardless of generation. This finding should punctuate the need for increased skill development in this area for the entire workforce. Skills for which there were no differences in the odds of being a beginner or unable to perform between Millennials and Generation X – assessing the broad array of factors that influence specific public health problems, finding evidence on public health efforts that work, addressing the needs of diverse populations in a
culturally sensitive way, applying quality improvement concepts in my work,
Generation X. An even lower proportion of Baby Boomers had degrees in public health, but longer service could explain why a difference persisted between Millennials and Baby Boomers. This finding has implications for public health training. Generally, there will be an increased demand for training among both Millennials and Generation X. This may be especially true for those competencies that are commonly addressed in academic public health training.
Despite broad perceptions, there are no empirical studies that explore Millennials compared to Generation X or Baby Boomers in the state governmental health agency workforce. While this analysis is limited by potential confounding by age and
TABLES
Table 2.1. Demographic and Workforce Characteristics of the State Governmental Public Health Agency Workforce by Generation
Millennials Generation X Baby Boomers
% (95% CI) % (95% CI) % (95% CI)
Gender
Male 25.3 (22.7-28.0) 26.2 (8.97-10.26) 29.76 (13.70-16.20)
Female 74.7 (72.0-77.3) 73.8 (26.32-27.80) 70.24 (33.71-36.68)
Race/Ethnicity
American Indian or Alaskan Native 0.4 (0.2-0.7) 0.4 (0.2-0.8) 0.6 (0.0-0.8)
Asian 5.5 (3.9-7.8) 5.7 (5.0-6.5) 3.6 (3.0-4.4)
Black or African American 11.3 (9.7-13.2) 16.3 (14.9-17.7) 11.8 (10.2-13.6)
Hispanic or Latino 10.6 (8.7-13.0) 8.1 (7.4-8.9) 4.8 (4.2-5.5)
Native Hawaiian or other Pacific Islander 0.3 (0.1-0.5) 0.5 (0.1-1.6) 0.1 (0.00-0.3)
White 65.1 (61.1-69.0) 63.5 (62.2-64.7) 75.53 (73.5-77.5)
Two or more races 6.76 (5.2-8.8) 5.5 (4.8-6.4) 3.5 (2.9-4.2)
Educational attainment
No College Degree 9.8 (8.1-11.7) 13.3 (12.2-14.5) 17.5 (16.1-19.0)
Associates 4.5 (3.6-5.5) 9.5 (8.5-10.5) 11.1 (9.4-13.0)
Bachelors 36.4 (32.6-40.3) 28.0 (25.1-30.8) 32.9 (31.3-34.7)
Masters 45.6 (42.8-48.5) 34.7 (32.7-36.7) 28.3 (26.7-30.1)
Doctoral 3.8 (2.6-5.6) 9.6 (8.3-11.1) 10.1 (8.9-11.5)
Any degree in public health 30.9 (27.5-34.6) 19.5 (18.0-21.0) 11.4 (10.3-12.6)
Job Classification
Administrative 22.3 (18.9-26.1) 28.6 (25.4-32.1) 29.3 (27.5-31.2)
Clinical and lab 13.5 (11.2-16.1) 12.5 (11.0-14.2) 16.2 (15.0-17.4)
Public health science 44.5 (39.4-49.7) 43.9 (41.7-46.1) 38.9 (36.4-41.5)
Social service and all other 19.8 (16.4-23.7) 14.9 (13.4-16.6) 15.6 (14.5-16.8)
Program area
Chronic disease and injury 6.4 (5.1-8.0) 6.1 (5.3-7.1) 4.2 (3.6-4.9)
Communicable disease 14.6 (11.5-18.3) 8.3 (7.0-9.7) 8.0 (7.1-8.9)
Environmental health 10.2 (8.5-12.1) 10.1 (8.9-11.3) 10.7 (9.8-11.8)
Maternal and child health 10.4 (8.5-12.6) 8.8 (7.6-10.3) 9.7 (8.2-11.3)
All hazards 3.5 (2.3-5.3) 4.1 (3.3-5.0) 3.6 (3.1-4.2)
Table 2.2. Attitudes toward Training among the State Governmental Public Health Agency Workforce by Generation
Millennials Generation X Baby Boomers
% (95% CI) % (95% CI) % (95% CI)
Supervisors/team leaders in my work unit support employee development
Strongly disagree 2.9 (1.7-4.7) 4.2 (3.2-5.4) 3.54 (3.1-4.0)
Disagree 7.9 (5.6-11.1) 7.3 (6.5-8.1) 9.07 (8.3-10.0)
Neither agree nor disagree 13.0 (11.4-14.8) 17.4 (15.9-19.0) 19.05 (17.6-20.6)
Agree 42.1 (39.3-44.9) 45.3 (43.5-47.1) 45.84 (43.7-48.0)
Strongly agree 34.1 (31.1-37.1) 25.9 (23.9-28.1) 22.5 (20.2-25.0)
My training needs are assessed
Strongly disagree 4.4 (3.1-6.4) 6.1 (5.4-6.8) 5.8 (5.3-6.4)
Disagree 18.0 (15.3-21.1) 21.7 (20.0-23.5) 22.1 (20.5-23.9)
Neither agree nor disagree 23.1 (21.0-25.5) 27.7 (25.8-29.7) 29.6 (28.1-3.1)
Agree 39.8 (36.7-43.0) 35.1 (33.2-36.9) 34.4 (32.6-36.2)
Strongly agree 14.6 (12.2-17.5) 9.5 (8.3-10.8) 8.1 (7.4-8.8)
Employees have sufficient training to fully utilize technology needs
Strongly disagree 6.2 (4.8-8.0) 5.4 (4.7-6.3) 5.4 (4.8-6.0)
Disagree 18.3 (15.8-21.2) 22.7 (20.9-24.6) 22.3 (20.8-23.8)
Neither agree nor disagree 20.6 (17.0-24.6) 23.7 (22.3-25.3) 24.3 (23.1-25.6)
Agree 41.0 (37.2-44.9) 38.7 (36.8-40.6) 40.1 (38.3-41.8)
Strongly agree 13.9 (11.2-17.2) 9.4 (8.2-10.8) 8.0 (7.2-8.8)
Employees learn from one another as they do their work
Strongly disagree 1.0 (0.5-1.7) 2.3 (1.8-3.1) 1.4 (1.0-1.8)
Disagree 4.9 (3.5-6.7) 4.3 (3.5-5.2) 4.7 (4.0-5.6)
Neither agree nor disagree 10.0 (7.8-12.8) 13.7 (12.2-15.4) 11.7 (10.5-12.9)
Agree 53.2 (48.4-57.9) 56.1 (53.3-58.9) 59.2 (57.3-61.1)
Table 2.3. Adjusted Odds Ratios (OR) of Positive Attitudes toward Training*
OR 95% CI
Low Limit High Limit
Supervisors/team leaders in my work unit support employee development
Millennials 1.00 --- ---
Generation X 0.71 0.59 0.85
Boomers 0.58 0.46 0.73
My training needs are assessed
Millennials 1.00 --- ---
Generation X 0.63 0.51 0.78
Boomers 0.55 0.46 0.65
Employees have sufficient training to fully utilize technology needs
Millennials 1.00 --- ---
Generation X 0.79 0.66 0.94
Boomers 0.76 0.62 0.93
Employees learn from one another as they do their work
Millennials 1.00 --- ---
Generation X 0.66 0.49 0.90
Boomers 0.70 0.52 0.95
Table 2.4. Training Needs among the State Governmental Public Health Agency Workforce by Generation
Millennials Generation X Baby Boomers
% (95% CI) % (95% CI) % (95% CI)
Influencing policy development
High Importance/Low Skill 41.0 (37.7-44.5) 33.6 (31.6-35.7) 27.4 (25.6-29.2)
High Importance/High Skill 36.6 (33.1-40.3) 53.7 (51.2-56.1) 61.3 (58.7-63.9)
Understanding the relationship between a new policy and many types of public health problems
High Importance/Low Skill 38.6 (35.7-41.5) 28.5 (26.0-31.2) 24.6 (23.0-26.3)
High Importance/High Skill 48.5 (45.8-51.1) 61.8 (60.2-63.4) 67.2 (65.2-69.2)
Preparing a program budget with justification
High Importance/Low Skill 32.3 (27.3-37.7) 23.5 (21.6-25.6) 20.6 (19.3-22.0)
High Importance/High Skill 40.9 (36.6-45.4) 59.9 (57.9-61.9) 63.6 (61.9-65.2)
Assessing the broad array of factors that influence specific public health problems
High Importance/Low Skill 28.8 (25.4-32.4) 24.7 (22.1, 27.6) 22.8 (21.3-24.3)
High Importance/High Skill 58.0 (53.5-62.5) 65.1 (62.8, 67.3) 67.1 (65.6-68.7)
Collaborating with diverse communities to identify and solve health problems
High Importance/Low Skill 33.5 (30.9-36.3) 22.0 (19.6-24.5) 20.3 (18.0-22.7)
High Importance/High Skill 52.9 (48.4-57.4) 64.5 (62.2-66.7) 67.2 (64.6-69.7)
Finding evidence on public health efforts that work
High Importance/Low Skill 24.0 (20.5-27.7) 22.7 (20.5-24.9) 21.1 (19.3-23.0)
High Importance/High Skill 62.2 (57.1-67.1) 66.3 (64.5-68.1) 68.6 (66.48-70.8)
Ensuring that programs are managed within the current and forecasted budget constraints
High Importance/Low Skill 32.4 (27.9-37.3) 23.5 (21.7-25.4) 18.2 (16.3-20.2)
High Importance/High Skill 47.9 (43.2-52.7) 65.8 (62.8-68.8) 73.6 (72.2, 75.0)
Anticipating the changes in your environment
High Importance/Low Skill 28.9 (25.7-32.3) 22.0 (19.1-25.2) 18.8 (16.9-20.8)
High Importance/High Skill 59.3 (55.1-63.4) 69.5 (66.7-72.3) 75.0 (73.2-76.7)
Addressing the needs of diverse populations in a culturally sensitive way
High Importance/Low Skill 25.2 (21.9-28.7) 21.1 (18.9-23.6) 19.2 (17.6-21.0)
High Importance/High Skill 63.2 (59.4-66.9) 68.9 (66.3-71.5) 72.8 (71.0-74.6)
Applying evidence-based approaches to solve public health issues
High Importance/Low Skill 24.4 (21.7-27.3) 20.89 (18.5-23.5) 19.5 (17.3-21.9)
High Importance/High Skill 66.2 (63.0-69.3) 71.19 (68.2-74.0) 72.5 (70.0-74.9)
Applying quality improvement concepts in my work
High Importance/Low Skill 26.3 (22.8-30.2) 22.2 (19.2-25.6) 18.4 (17.1-19.8)
High Importance/High Skill 66.5 (63.0-69.9) 71.6 (68.7-74.3) 77.1 (75.8-78.3)
Interpreting public health data to answer questions
High Importance/Low Skill 17.2 (14.5-20.5) 18.1 (16.2-20.3) 18.13 (16.9-19.4)
High Importance/High Skill 73.6 (69.0-77.7) 74.1 (72.1-76.0) 74.50 (72.5-76.4)
Engage partners outside your health department to collaborate on projects
High Importance/Low Skill 24.5 (20.6-28.8) 17.1 (15.3-19.1) 14.7 (12.6-7.1)
High Importance/High Skill 62.9 (58.3-67.2) 75.3 (73.0-77.4) 77.3 (74.6-79.8)
Managing change in response to dynamic, evolving circumstances
High Importance/Low Skil 21.3 (18.9-24.0) 16.0 (14.1-18.0) 14.1 (12.9-15.4)
High Importance/High Skill 73.5 (70.4-76.3) 79.5 (77.1-8.6) 80.9 (79.6-82.1)
Communicating in a way that persuades others to act
High Importance/Low Skill 22.8 (19.7-26.1) 16.1 (14.3-18.1) 12.0 (11.0-13.2)
High Importance/High Skill 70.1 (67.0-72.9) 79.3 (77.0-81.4) 84.8 (83.6-85.9)
Engaging staff within your health department to collaborate on projects
High Importance/Low Skill 21.8 (18.5-25.5) 13.76 (12.4-15.2) 13.15 (11.8-14.7)
High Importance/High Skill 70.5 (66.9-73.8) 80.86 (79.3-82.4) 81.40 (80.3-82.5)
Communicating ideas and information in a way that different audiences can understand
High Importance/Low Skill 11.9 (10.0-14.2) 9.9 (8.7-11.3) 9.9 (8.6-1.1)
High Importance/High Skill 84.2 (81.3-86.6) 87.2 (85.8-88.5) 87.2 (85.9-88.3)
Gathering reliable information to answer questions
High Importance/Low Skill 9.1 (6.6-12.4) 7.1 (5.6-8.9) 6.3 (5.3-7.3)
Table 2.5. Adjusted Odds Ratios (OR) of Being Unable to Perform/Beginner at Key Workforce Skills
OR 95% CI
Low Limit High Limit
Influencing policy development
Millennials 1.00 --- ---
Generation X 0.75 0.59 0.95
Boomers 0.57 0.46 0.71
Understanding the relationship between a new policy and many types of public health problems
Millennials 1.00 --- ---
Generation X 0.61 0.50 0.75
Boomers 0.49 0.41 0.60
Preparing a program budget with justification
Millennials 1.00 --- ---
Generation X 0.79 0.63 0.98
Boomers 0.65 0.54 0.78
Assessing the broad array of factors that influence specific public health problems
Millennials 1.00 --- ---
Generation X 0.81 0.65 1.01
Boomers 0.68 0.55 0.86
Collaborating with diverse communities to identify and solve health problems
Millennials 1.00 --- ---
Generation X 0.61 0.49 0.76
Boomers 0.52 0.41 0.66
Finding evidence on public health efforts that work
Millennials 1.00 --- ---
Generation X 0.82 0.62 1.07
Boomers 0.68 0.51 0.90
Ensuring that programs are managed within the current and forecasted budget constraints
Millennials 1.00 --- ---
Generation X 0.79 0.65 0.96
Boomers 0.53 0.42 0.66
Anticipating the changes in your environment
Millennials 1.00 --- ---
Generation X 0.73 0.59 0.90
Boomers 0.53 0.43 0.72
Addressing the needs of diverse populations in a culturally sensitive way
Millennials 1.00 --- ---
Generation X 0.82 0.66 1.00
Boomers 0.63 0.49 0.80
Applying evidence-based approaches to solve public health issues
Millennials 1.00 --- ---
Generation X 0.76 0.62 0.93
Boomers 0.66 0.47 0.89
Applying quality improvement concepts in my work
Millennials 1.00 --- ---
Generation X 0.90 0.73 1.10
Boomers 0.67 0.53 0.84
Interpreting public health data to answer questions
Millennials 1.00 --- ---
Generation X 0.77 0.61 0.97
Generation X 0.66 0.50 0.87
Boomers 0.50 0.38 0.65
Managing change in response to dynamic, evolving circumstances
Millennials 1.00 --- ---
Generation X 0.78 0.63 0.98
Boomers 0.66 0.54 0.81
Communicating in a way that persuades others to act
Millennials 1.00 --- ---
Generation X 0.72 0.56 0.91
Boomers 0.47 0.38 0.59
Engaging staff within your health department to collaborate on projects
Millennials 1.00 --- ---
Generation X 0.59 0.45 0.76
Boomers 0.50 0.40 0.64
Communicating ideas and information in a way that different audiences can understand
Millennials 1.00 --- ---
Generation X 0.82 0.64 1.05
Boomers 0.71 0.55 0.92
Gathering reliable information to answer questions
Millennials 1.00 --- ---
Generation X 0.71 0.45 1.13
Boomers 0.59 0.39 0.88
Note: Each variable listed represents a separate model. Models are limited to those
CHAPTER 3: MILLENNIAL SUPPORT & SATISFACTION: GENERATIONAL DIFFERENCES IN ORGANIZATIONAL SUPPORT, SUPERVISORY SUPPORT, AND JOB SATISFACTION AMONG THE STATE PUBLIC HEALTH AGENCY WORKFORCE
BACKGROUND
Workers and their workplaces exist in a symbiotic relationship in which the thoughts and behaviors of each influence the other.(Brief & Weiss, 2002; Mathieu & Zajac, 1990) Job satisfaction is one of the most studied aspects of this relationship and has been linked to nearly all important organizational outcomes.(Judge, Thoresen, Bono, & Patton, 2001; Lu, Barriball, Zhang, & While, 2012) Studies have shown that workers with high levels of job satisfaction are more productive and motivated, perform better at their jobs, and have greater organizational commitment and
engagement.(Abelson & Baysinger, 1984; Judge et al., 2001; Lawler Iii & Porter, 1976) Job satisfaction has also been linked to reduced absenteeism.(Hacket, 1989; Hom & Kinicki, 2001) As a key predictor of employee turnover,(Carsten & Spector, 1987; Mossholder, Settoon, & Henagan, 2005; Tett & Meyer, 1993) low job satisfaction can have significant costs to organizations to replace departing and orienting new
employees.(Hellman, 1997; Schlesinger & Heskett, 1991)
public health agency workforce finding an association between organizational and supervisory support and job satisfaction.(Harper, Castrucci, Bharthapudi, & Sellers, 2015) While this work was significant, it neglected to consider the impact of generational identity on job satisfaction.
Generational Theory and Job Satisfaction
This is a time of significant generational transition as, for the first time, there are multiple generations existing simultaneously in the U.S. workforce.(Zemke et al., 2000) The three generations that comprise the majority of the workforce are the Baby
Boomers, Generation X, and the Millennials. By the first quarter of 2015, Millennials became the largest generation in the workforce (53.5 million) followed by Generation X (52.7 million) and the Baby Boomers (44.6 million).(Fry, 2015) However, unlike in
previous generational transitions, people are living longer, healthier lives.(Collins, 2003) Therefore, as Baby Boomers are reaching the traditional retirement age many are
continuing to work well into their 60s and 70s, if not longer.(Collins, 2003) For example, a 2010 American Association of Retired Persons survey of older Baby Boomers found that nearly 40% reported that they plan “to work until they drop.”(Love & Nannis, 2010) This longevity has implications for workforce advancement and entry for younger
generations. For example, more than half of all Millennials interviewed as part of The Hartford’s 2013 Benefits for Tomorrow Study agreed that Baby Boomers who delay retirement prevent young employees from promotional opportunities and deny employment opportunities.(The Hartford, 2013)
2015; Webb-Morgan, 2012) A generational cohort is a group of individuals similar in age who have experienced the same historical events within the same time
period.(Howe & Strauss, 2009; Ryder, 1965) Generation members share temporal and age-related events such as starting school, entering the workforce, having children, and retiring. While historical events occur simultaneously for multiple generations, each is experiencing these events at different developmental stages with young adulthood being a particularly impressionable developmental stage.(Baltes et al., 1980; Duncan & Agronick, 1995; Noble & Schewe, 2003) Each of these three generations come from very different backgrounds that shape their views and motivations and influence their relationship with the workplace, including their perceptions of job satisfaction. These differences can positively contribute to the workforce through creative strengths and opportunities.(Lancaster & Stillman, 2009) For example, 9 in 10 Millennials who participated in The Hartford’s 2013 Benefits for Tomorrow Study agreed that Baby Boomers bring substantial experience and knowledge to the workplace.(The Hartford, 2013) A similar proportion of Baby Boomers agreed that Millennials bring new skills and ideas to workplace.(The Hartford, 2013) However, about three quarters of Generation X from the same study agreed that the “entitlement generation” is an appropriate
nickname for the Millennials.(The Hartford, 2013) This demonstrates the potential for unpleasant conflict, mistrust, and miscommunication that can directly impact job satisfaction.(Hankin, 2005; Lancaster & Stillman, 2009; Ruch, 2005)
coworkers and supervisors – are considered and addressed. This concept can be divided into two separate themes – organizational support (training, communications, workload) and supervisory support (respect, good relationships, working well with individuals of different backgrounds).(Campbell, Fowles, & Weber, 2004; Crose, 1999; Pitts, Marvel, & Fernandez, 2011; Rowden, 2002) The different value systems
(Kupperschmidt, 2000; Zemke et al., 2000) and life experiences of each generation (Hicks & Hicks, 1999; Lancaster & Stillman, 2009; Zemke et al., 2000) can directly influence their perceptions of the workplace including reactions to organizational and supervisory support.(Lancaster & Stillman, 2009; Ruch, 2005)
Baby Boomers believe in paying their dues in an organization and a strong organizational commitment.(Hicks & Hicks, 1999; Howe & Strauss, 2009) They routinely sacrificed on behalf of their workplace with 50 or even 60-plus hour weeks, and they frequently advise young coworkers to work hard, demonstrate their dedication, and patiently wait their turn for promotions.(Chatman & Flynn, 2001; Hicks & Hicks, 1999; Howe & Strauss, 2009) They are the original workaholics who, even as young adults, had little notion of work-life balance.(McGuire, Todnem By, & Hutchings, 2007; Stauffer, 1997)
2009; Lancaster & Stillman, 2009) Instead, more than other generations, Millennials develop commitment to individuals, especially supervisors with whom they develop meaningful relationships.(Lockwood, 2009; Marston, 2010) They also expect a balance between family and careers that previous generations have not.(Carless & Wintle, 2007; Myers & Sadaghiani, 2010; Ng, Schweitzer, & Lyons, 2010; Wey Smola & Sutton, 2002)
In regard to supervisory relationships, Millennials’ interactions with supervisors are a departure from the relationships Baby Boomers and Generation X. Millennials expect open communication from their supervisors and managers, even about matters normally reserved for more senior employees.(Gursoy et al., 2008; Hershatter &
Epstein, 2010) Empirical studies also found Millennials to be more impatient about becoming recognized as valuable contributors.(Gursoy et al., 2008; Pew Research, 2010) Millennials expect communication with supervisors to be more frequent, more positive, and more affirming than has been the case with prior generations. (Gursoy et al., 2008; Hershatter & Epstein, 2010; Hill, 2002)
Research Questions and Implications
retain those who opt to enter this workforce.(K. Gebbie et al., 2002; The Association of Schools of Public Health Council of Public Health Practice Coordinators, 2000)
Job satisfaction has been shown to be a significant predictor of retention.(Irvine & Evans, 1995; Tett & Meyer, 1993) While Harper et al. published the first study to
explore correlates of job satisfaction in the state governmental public health agency workforce, given the generational differences regarding work values and attitudes, job satisfaction may be perceived differently across the multigenerational state
governmental public health agency workforce.(Harper et al., 2015) Consequently, understanding job satisfaction within each generational group may lead to increasing clarity about strategies that could be implemented to promote retention among those currently in the state governmental public health agency workforce, especially
Millennials. To inform the development of retention strategies, the present study seeks to determine if there are differences in the relationship between supervisory support and organizational support and job satisfaction across the three generational cohorts that account for at least five percent of the state governmental public health agency workforce.
METHODS
Data Sources
Data used in the analyses for this article were drawn from the 2014 Public Health Workforce Interests and Needs Survey (PH WINS) – specifically, the nationally
public health workforce survey of its kind.(Sellers et al., 2015) PH WINS is the only national survey of the public health workforce that collects individual-level data. As such, it is the first and only national data source that allows for investigation of generational differences in the public health workforce.
The methods used in the creation of PH WINS have been described in detail previously.(Leider et al., 2015; Sellers et al., 2015) To summarize, the purpose of PH WINS was to collect individual worker perspectives across all disciplines and
geographic regions. The development of PH WINS began in 2013, with a consensus-building process among 31 public health stakeholders representing an array of
disciplines.(Kaufman et al., 2014) A technical expert panel was convened to guide the sampling methodology, instrument creation, and protocols for survey fielding and administration.(Sellers et al., 2015)
used several items from Boulton et al.'s public health workforce taxonomy to ask
respondents about occupational classification, program area, degrees and certifications, work setting, and demographics.(Boulton et al., 2014) The research team drafted new questions when appropriate existing items could not be identified. Cognitive interviews were conducted, and the instrument was pretested with three groups of public health practitioners at the state and local levels. The finalized survey was administered online in fall 2014. After pretesting and preliminary psychometric analysis (also explained in depth in previous a previous publication), the instrument was fielded among 37 states from September to December 2014.(Leider et al., 2015) The survey was confidential; contact information was retained only to ascertain whether a potential respondent had indeed responded. No contact information is associated with responses in final PH WINS data sets.
The national sampling frame of state public health employees was stratified on the basis of 5 geographic (paired HHS) regions using employee lists provided by each participating state and stratified with the state as the lowest stratum variable before selection of a random sample within each state. The complex sampling methodology for PH WINS has been outlined elsewhere.(Leider et al., 2015) A total of 40,091 survey invitations were distributed via electronic mail to health agency employees in 37
participating states; 19,171 responded for a raw response rate of 48%. After adjusting for noncentral office staff, nonpermanent employee status, undeliverable e-mail
been assigned to local or regional offices, was constructed. A set of weights was calculated using balanced repeated replication to account for differential nonresponse and demographic characteristics.
Measures
Generations
There is no one source that defines the generations. Various authors use slightly different cut points to define each generation. The generation definitions developed by the Pew Research Center were used for this study (Pew Research, 2014). These are also consistent with the definition used in the Federal Employee Viewpoints Survey. Using this framework, the birth year cut points are:
Millennials: 1981 and after
Generation X: 1965-1980
Baby Boomers: 1946-1964
Silent Generation: 1928-1945
Only generations comprising five percent or more of the state public health agency workforce were included in the analysis eliminating the Silent Generation.
Organizational and Supervisory Support
my workload is reasonable, and (6) I recommend my organization as a good place to work.
Items included in supervisory support included (1) my supervisor/leader treats me with respect, (2) my supervisor and I have a good working relationship, (3) my supervisor supports my need to balance work and family issues, (4) my supervisor/team leader provides me with opportunities to demonstrate my leadership skills, (5)
supervisors/team leaders in my work unit support employee development, and (6) supervisors/team leaders work well with employees of different backgrounds.
Items were assessed on a 5-point Likert scale ranging from strongly disagree to strongly agree. The mean across all items in each category – organizational support and supervisory support – were included in the regression models.
Job Satisfaction
Previous PH WINS analyses used the Bowling Green State University Job in General (JIG) Scale (abridged) to measure job satisfaction.(Balzer et al., 2000) This validated scale includes 8 descriptive words or phrases such as “makes me content” and “better than most” to determine overall job satisfaction.(Balzer et al., 2000; Russell et al., 2004) Generally, a score above 27 signifies satisfaction with one's job and a score less than 22 signifies dissatisfaction.(Balzer et al., 2000) The JIG Scale
(abridged) is a global measure of job satisfaction that can be used to gauge the overall evaluative or affective judgment about one’s job. Given the complexity of the JIG Scale and the number of items required to compose the survey, analyses were done to
from “very dissatisfied” to “very satisfied” on a 5-point Likert scale. Analyses found that the single question was as effective in capturing job satisfaction as was the JIG Scale. Therefore, unlike in the previous analyses,(Harper et al., 2015) the single question was used to measure job satisfaction.
Demographic and Workforce Characteristics
Other independent variables included in the analysis are the respondent’s (1) supervisory status (nonsupervisory, team leader, supervisor, manager, executive), (2) gender (male, female), (3) race (White, Black or African American, Native Hawaiian or other Pacific Islander, Asian, American Indian or Alaska Native, two or more races), (4) Hispanic origin (yes, no), (5) degree earned (associate’s, bachelor’s, graduate’s
degree), and (6) pairwise region (New England and Atlantic, Mid-Atlantic and Great Lakes, South, Mountain/Midwest, West). Educational attainment, having a public health degree (any level), job classification, and program area were also collected.
Statistical Analysis
All analyses for this research were conducted in Stata Version 13 (StataCorp. 2013. Stata Statistical Software: Release 13. College Station, TX: StataCorp LP). To account for the complex sampling design, survey commands included in SPSS were used to produce weighted estimates using balanced repeated replication.
Bivariate analyses were conducted to determine the association between