i
AN EXPLORATION OF FACTORS INFLUENCING THE PERFORMANCE OF SEPTIC TANKS IN REDUCING EXCRETA HAZARD
Beverly Barrett Medina III
A thesis submitted to the faculty of the University of North Carolina at Chapel Hill in partial fulfillment of the requirements for the degree of Master of Science in the Department of Environmental Sciences and Engineering in the Gillings School of Global Public Health.
Chapel Hill 2019
Approved by: Jill Stewart
ii ©2019
iii
ABSTRACT
Beverly Barrett Medina III: An exploration of factors influencing the performance of septic tanks in reducing excreta hazard
(Under the direction of Jill Stewart)
Despite widespread use of onsite sanitation, little is known about the efficacy of these technologies in reducing pathogen hazards. This work aimed to understand the performance of septic tanks in reducing hazards posed by human excreta. A literature review was conducted to examine how septic tanks vary globally and how these variations may influence tanks’
iv
ACKNOWLEDGMENTS
Thank you to my thesis committee for your kindness, direction, and perpetual support: Dr. Jill Stewart, Dr. Barbara Evans, and Dr. Peter Kolsky.
Special thanks to everyone at the UNC Water Institute, whose patience and guidance made my field work possible, including Dr. Musa Manga, Kaida Liang, Margie Mazzarella, Shannan George, Lisa Fleming, and David Holcomb.
v
TABLE OF CONTENTS
LIST OF TABLES ... viii
LIST OF FIGURES ... ix
LIST OF ABBREVIATIONS ... x
Chapter I: Introduction ... 1
The Pathogen Balance ... 4
Chapter II: Targeted Literature Review ... 12
Introduction ... 12
Search Strategy ... 12
Screening and Exclusion ... 14
Results ... 15
Metadata ... 15
In what ways does septic tank design vary globally? ... 20
What components of design are likely to impact performance? ... 22
How might we begin to model performance based on known design parameters? ... 23
Discussion ... 24
Chapter III: Field Study of Onsite Sanitation Systems in Tamil Nadu, India ... 26
vi
Study Area: Trichy and Coimbatore, Tamil Nadu, India ... 26
Methodology ... 28
Site Identification ... 28
User Surveys ... 28
Observational Surveys ... 28
Microbiological Sampling ... 28
Laboratory Analysis ... 29
Data Analysis ... 29
Results ... 30
Characterization of systems in field ... 30
Microbiological analysis... 33
Chapter IV: Discussion ... 38
Characterization findings ... 38
Microbiological findings ... 41
For planners and engineers ... 41
For homeowners ... 43
Limitations ... 43
Future work ... 45
Conclusions ... 46
vii
viii
LIST OF TABLES
Table 1: Literature review search terms... 13
Table 2: Metrics of effluent quality reported in literature ... 19
Table 3: Fecal pathogen categories reported in septic tank effluent ... 19
Table 4: Dimensions of septic tanks reported in the literature ... 20
Table 5: Number of compartments in septic tanks reported in the literature... 21
Table 6: Design criteria met by each of 22 containment systems... 32
Table 7: Total solids and E. coli in top and bottom samples from twelve septic tanks ... 34
Table 8: Characteristics of twelve fully-lined tanks with overflow ... 35
Table 9: Correlations between tank characteristics and physical and microbiological properties of effluent and sludge ... 36
ix
LIST OF FIGURES
Figure 1: Fecal sludge management (FSM) chain ... 2
Figure 2: Simplified pathogen balance on pit latrine ... 4
Figure 3: Simplified pathogen balance on septic tank ... 6
Figure 4: Functional relationships between variables involved in septic tank pathogen balance .. 9
Figure 5: Literature search returns and results of screening ... 15
Figure 6: Included studies categorized by search term ... 16
Figure 7: Map of geographical distribution of studies included in targeted literature review ... 17
Figure 8: Distribution of publication dates for included studies... 18
Figure 9: Categories of OSS technologies encountered in Tamil Nadu ... 30
Figure 10: Fraction of fully lined tanks meeting each of four septic tank design criteria ... 31
x
LIST OF ABBREVIATIONS
CFU Colony Forming Units
DALY Disability-Adjusted Life Years
FSM Fecal Sludge Management
JMP The WHO/UNICEF Joint Monitoring Programme for Water Supply, Sanitation and Hygiene
IIHS Indian Institute for Human Settlements
OSS Onsite Sanitation PFR Plug Flow Reactor
RTD Residence Time Distribution SFD Shit Flow Diagram
TNUSSP Tamil Nadu Urban Sanitation Sustainability Programme
TS Total Solids
UGD Underground Drainage
WaSH Water, Sanitation and Hygiene WHO World Health Organization
1
CHAPTER I: INTRODUCTION
Water, sanitation, and hygiene (WaSH) are inextricably tied to public health; addressing inadequacies in WaSH coverage, access, and quality is a key challenge facing 21st century engineers. Absent or insufficient WaSH infrastructure contributes to the spread of diarrheal illnesses as well as other cascading health effects, including malnutrition. It is estimated that 280,000 diarrheal deaths per year can be attributed to poor sanitation [1]. In low- and middle-income countries, urban areas are rapidly expanding, with population growth outpacing both the development of sanitation infrastructure and the capacity to operate it. Urban planners and public health engineers need evidence-based tools to make decisions that best protect human and
environmental health.
Safe sanitation has been defined in different ways by different stakeholders. For the purposes of international monitoring, the Joint Monitoring Programme (JMP) sanitation ladder defines “safely managed” sanitation as the “use of improved facilities which are not shared with other households and where excreta are safely disposed in situ or transported and treated off-site” [2]. However, since the JMP is by nature a monitoring agency, this definition is merely a proxy, and outcomes are not monitored. The World Health Organization (WHO) Sanitation Guidelines state that “safe sanitation systems separate human excreta from human contact at all steps of the sanitation service chain carrying excreta from the toilet to its eventual safe use or disposal” [3]. Though neither of these definitions is prescriptive, each acknowledges the importance of
2
6.2, which aims to provide “adequate and equitable sanitation and hygiene for all and end open defecation,” describes our aspiration to separate humans from hazard. The WHO definition describes this objective, while the JMP definition presents a measurable outcome.
The fecal sludge management (FSM) chain, presented in Figure 1, follows the flow of excreta from point of generation to ultimate disposal or reuse. To meet the objectives of the SDGs, sanitation systems must minimize the potential for unsafe waste returns at all stages in the FSM chain. The conventional approach to sanitation development has focused largely on the transport of waste away from the household (as with a sewerage network); this approach appeals to users, whose chief concern is removing human excreta from the household environment as quickly as possible. However, this approach ignores the potential for unsafe returns downstream; in the absence of end-of-pipe treatment, pathogens in sewage may be directly discharged to the environment. Conversely, technologies such as pit latrines, which isolate waste close to the household, are often regarded as more primitive sanitation despite providing a good level of public health protection.
Figure 1: Fecal sludge management (FSM) chain
Onsite sanitation (OSS) technologies such as pit latrines and septic tanks are widely used for municipal wastewater management. These technologies serve different purposes for different
3
stakeholders, but in general, they function by containing human excreta, either in a pit latrine (which holds excreta until it is emptied, limiting the release and exposure opportunities) or in a septic tank (which allows for the management of large amounts of sewage without necessarily spilling directly into the local environment). From a public health perspective, this containment should result in a natural reduction in hazard over time with pathogen die-off. However, from a household perspective, the main service provided by these containment systems is the isolation of excreta away from the household, whether or not an overall hazard reduction occurs. Despite the widespread use of these onsite technologies, not much information exists about how well OSS systems actually reduce the release of pathogen hazard to the environment.
Recognizing the need for a better understanding of the fecal sludge management chain, previous researchers have taken various approaches to modeling hazard. The shit flow diagram (SFD), which estimates the fraction of the population whose excreta are safely managed at each step of the FSM chain, was a key development [4]. The SFD provides a tool that can be tailored to a given location to identify the points in the service chain that presented the greatest potential for unsafe returns.
The chief weakness of the SFD approach is its uniform treatment of waste streams. In reality, waste leaked from the containment stage of the FSM chain is unlikely to have the same hazard profile as waste leaked during transport, emptying, or treatment. It is necessary to
quantify the pathogen hazard that is present at each stage in order to transform the volume-based excreta flows into health-based hazard flows.
4
the existing approaches. To fully understand how all of these effects interact, the pathogen balance concept is useful.
The Pathogen Balance
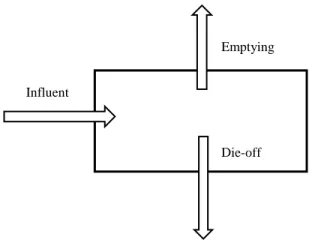
The need to understand pathogen flows gives rise to the pathogen balance concept, which accounts for (a) pathogen flows throughout the system; and (b) pathogen death within the
system. A simple pathogen balance diagram for a pit latrine is presented in Figure 2. Note that this balance is for the containment system only; it does not consider the fate of the emptied pathogens. In addition, this simplified balance neglects some flows, such as leakage through groundwater or overflow of latrines; these flows are assumed to be negligible in well-designed and properly maintained containment systems.
Based on this pathogen balance concept, Lisa Fleming developed a computational model of viable pathogens present in the model pit latrine over time [5]. This work demonstrated that pathogen hazard in pit latrines eventually reached a steady-state equilibrium, in which additional inputs of wastes were offset by natural attenuation within the pit. This finding has clear
implications for pit latrine management: emptying frequency dictates the pathogen hazard posed Emptying
Influent
Die-off
5
by pit latrines, and ensuring proper emptying intervals is an actionable public health intervention. The mathematical model produced by Lisa Fleming’s work is shown in Equation 1.
𝑁𝑡 = ∑ 𝑁0𝑒−𝑘𝑡𝑚 𝑇
𝑚=0
𝑁𝑡= 𝑡𝑜𝑡𝑎𝑙 𝑛𝑢𝑚𝑏𝑒𝑟 𝑜𝑓 𝑣𝑖𝑎𝑏𝑙𝑒 𝑝𝑎𝑡ℎ𝑜𝑔𝑒𝑛𝑠 𝑖𝑛 𝑝𝑖𝑡 𝑎𝑡 𝑡𝑖𝑚𝑒 𝑡 𝑁0 = 𝑛𝑢𝑚𝑏𝑒𝑟 𝑜𝑓 𝑣𝑖𝑎𝑏𝑙𝑒 𝑝𝑎𝑡ℎ𝑜𝑔𝑒𝑛𝑠 𝑖𝑛𝑡𝑟𝑜𝑑𝑢𝑐𝑒𝑑 𝑖𝑛𝑡𝑜 𝑝𝑖𝑡 𝑤𝑖𝑡ℎ 𝑒𝑎𝑐ℎ 𝑙𝑜𝑎𝑑𝑖𝑛𝑔 𝑒𝑣𝑒𝑛𝑡
𝑘 = 𝑟𝑎𝑡𝑒 𝑐𝑜𝑛𝑠𝑡𝑎𝑛𝑡 𝑓𝑜𝑟 𝑝𝑎𝑡ℎ𝑜𝑔𝑒𝑛 𝑑𝑖𝑒 𝑜𝑓𝑓
𝑡𝑚 = 𝑡𝑖𝑚𝑒 𝑒𝑙𝑎𝑝𝑠𝑒𝑑 𝑠𝑖𝑛𝑐𝑒 𝑖𝑛𝑑𝑖𝑣𝑖𝑑𝑢𝑎𝑙 𝑙𝑜𝑎𝑑𝑖𝑛𝑔 𝑒𝑣𝑒𝑛𝑡 𝑇 = 𝑡𝑖𝑚𝑒 𝑎𝑡 𝑤ℎ𝑖𝑐ℎ 𝑐𝑜𝑛𝑐𝑒𝑛𝑡𝑟𝑎𝑡𝑖𝑜𝑛 𝑖𝑠 𝑏𝑒𝑖𝑛𝑔 𝑒𝑣𝑎𝑙𝑢𝑎𝑡𝑒𝑑
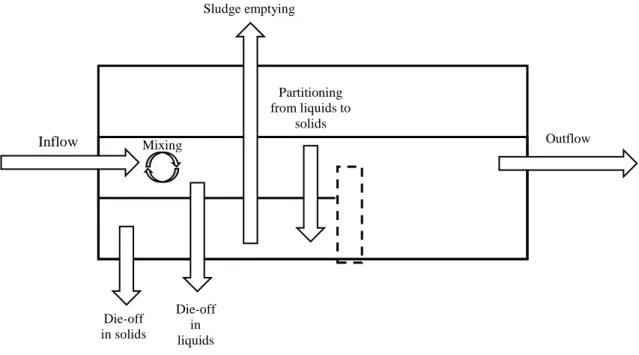
Given the practical applications of these findings, it would be useful to develop an analogous model for septic tanks, which would estimate the effluent pathogen load for any given septic tank configuration. However, Figure 3, which represents the materials flow balance for a septic tank, demonstrates several characteristics of septic tanks which complicate this endeavor. Though pit latrines and septic tanks have many similarities, some key differences make
mathematical modeling difficult. A pathogen balance on a septic tank must include a term accounting for the flow of pathogens out of the tank with the clarified liquid effluent. It is thus necessary to quantify the fraction of pathogens that partition to the liquid phase versus remaining solid-bound. Unfortunately, these kinds of partitioning data are sparse. Further, the operation of the tank must also be considered. The emptying regime (frequency as well as emptying method) will affect the composition of the tank outflow, in particular the balance of solids and liquids.
6
Further, while pit latrines can be approximated as batch reactors, the presence of an outflow mechanism makes septic tanks a flow system, so quantifying pathogen kinetics requires derivation of a hydraulic residence time (HRT). For the purposes of design, septic tanks have been historically treated as plug flow reactors (PFRs), in which residence time distribution (RTD) is uniform and there is no or negligible hydraulic mixing [6]. Plug flow is the ideal condition, as it allows for optimal vertical settling of solids, reducing the risk of short-circuiting [6]. However, it is unlikely that this ideal flow regime exists, even in tanks that are fitted with the proper T-shaped inlet and outlet devices to minimize turbulence. In reality, the septic tank likely exhibits some combination of plug flow and mixed flow. Though prior models [7-9] have attempted to mathematically describe this type of flow regime, they have all been developed in the context of large-scale wastewater treatment processes, such as waste stabilization ponds
Sludge emptying
Outflow
Inflow
Die-off in solids
Die-off in liquids
Partitioning from liquids to
solids Mixing
7
(WSPs) or settling basins at wastewater plants. These systems are in some way analogous to septic tanks, but they receive a much steadier inflow compared to the intermittent inflow to a household septic tank. The intermittency of septic tank inflows complicates the development of a robust hydraulic model, which in turn makes estimating settling time and pathogen kinetics impossible.
A model of a septic tank pathogen balance is represented in Equation 2. Several terms are similar to those described in the pit latrine model, but the additional terms present mathematical challenges.
𝑵𝒕 = ∑ 𝑵𝟎𝜶𝒆−𝒌𝒔𝒕𝒎
𝑻
𝒎=𝟎
+ ∑ 𝑵𝟎(𝟏 − 𝜶) 𝑻
𝒎=𝟎
𝒆−𝒌𝒔𝒕𝒎
− ∑𝑵𝟎(𝟏 − 𝜶) 𝐞𝐱𝐩(−𝒌𝑳𝒕𝒎)∀𝒆𝒇𝒇 ∀𝑳
𝑻
𝒎=𝟎
𝛼 = 𝑓𝑟𝑎𝑐𝑡𝑖𝑜𝑛 𝑜𝑓 𝑝𝑎𝑡ℎ𝑜𝑔𝑒𝑛𝑠 𝑡ℎ𝑎𝑡 𝑝𝑎𝑟𝑡𝑖𝑡𝑖𝑜𝑛 𝑡𝑜 𝑠𝑜𝑙𝑖𝑑𝑠 𝑘𝑠 = 𝑑𝑖𝑒 − 𝑜𝑓𝑓 𝑐𝑜𝑒𝑓𝑓𝑖𝑐𝑖𝑒𝑛𝑡 𝑖𝑛 𝑠𝑜𝑙𝑖𝑑𝑠 − 𝑏𝑜𝑢𝑛𝑑 𝑝ℎ𝑎𝑠𝑒 𝑘𝑙 = 𝑑𝑖𝑒 − 𝑜𝑓𝑓 𝑐𝑜𝑒𝑓𝑓𝑖𝑐𝑖𝑒𝑛𝑡 𝑖𝑛 𝑙𝑖𝑞𝑢𝑖𝑑 𝑝ℎ𝑎𝑠𝑒
∀𝑒𝑓𝑓 ∀𝐿
= 𝑓𝑟𝑎𝑐𝑡𝑖𝑜𝑛 𝑜𝑓 𝑙𝑖𝑞𝑢𝑖𝑑 𝑐𝑜𝑛𝑡𝑒𝑛𝑡 𝑓𝑙𝑜𝑤𝑖𝑛𝑔 𝑜𝑢𝑡 𝑑𝑢𝑟𝑖𝑛𝑔 𝑡𝑖𝑚𝑒 𝑖𝑛𝑡𝑒𝑟𝑣𝑎𝑙 𝑚 𝑡𝑚 = 𝑡𝑖𝑚𝑒 𝑒𝑙𝑎𝑝𝑠𝑒𝑑 𝑠𝑖𝑛𝑐𝑒 𝑙𝑜𝑎𝑑𝑖𝑛𝑔 𝑒𝑣𝑒𝑛𝑡
8
In this way, pit latrines can be viewed mathematically as the limiting case of a generalized containment system. If Equation 2 were evaluated for a system with no outflow (∀𝑒𝑓𝑓= 0) and only one phase (𝛼 = 1) the resulting equation would simplify to Equation 1:
𝑁𝑡 = ∑ 𝑁0(1)𝑒−𝑘𝑠𝑡𝑚
𝑇
𝑚=0
+ ∑ 𝑁0(0) 𝑇
𝑚=0
𝑒−𝑘𝑠𝑡𝐿 − ∑𝑁0(1 − 𝛼) exp(−𝑘𝐿𝑡𝑚)(0)
∀𝐿 𝑇
𝑚=0
𝑁𝑡 = ∑ 𝑁0exp 𝑒−𝑘𝑡𝑚
𝑇
𝑚=0
9
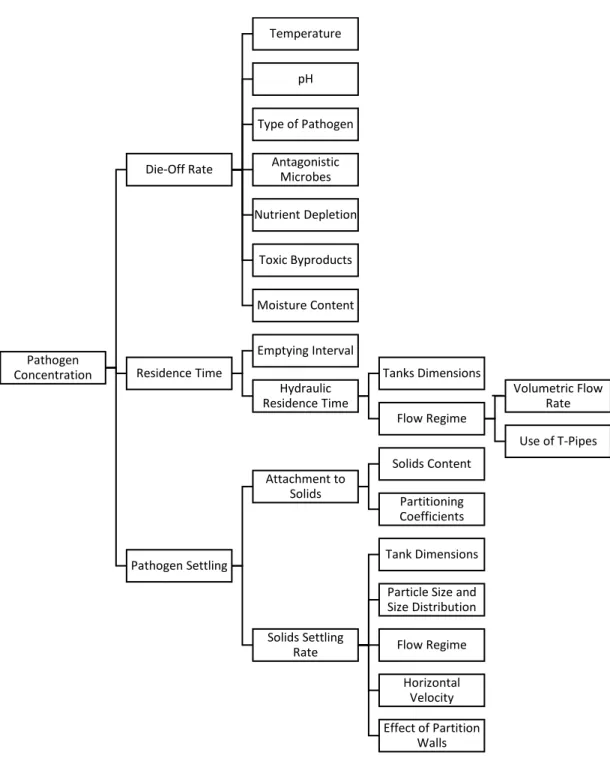
Figure 4: Functional relationships between variables involved in septic tank pathogen
balance
Since this is such a complex system, we are unlikely to be able to model the individual processes and their interactions. Therefore, a more promising approach would be to examine the
Pathogen Concentration
Die-Off Rate
Temperature
pH
Type of Pathogen
Antagonistic Microbes Nutrient Depletion Toxic Byproducts Moisture Content Residence Time Emptying Interval Hydraulic Residence Time Tanks Dimensions Flow Regime Volumetric Flow Rate
Use of T-Pipes
Pathogen Settling Attachment to Solids Solids Content Partitioning Coefficients Solids Settling Rate Tank Dimensions
Particle Size and Size Distribution
Flow Regime
Horizontal Velocity
10
performance of a range of real-life septic tanks to determine which characteristics most impact the level of hazard reduction achieved. The ideal result would be a clustering of performance outcomes based on a family of tank characteristics, which could then be used to inform design guidelines.
For the purposes of this work, “performance” of a sanitation technology refers to the efficacy of the technology in reducing viable pathogen concentrations that are discharged to the natural or built environment. This is founded in the concept of hazard, which is defined as the potential burden of disease (potential disability-adjusted life years lost, or potential DALYs) posed by a given waste stream1. This is distinct from the concept of risk in that it does not consider exposure. For reasons that will become apparent, “septic tank” refers, for the purposes of this work, to a fully lined tank with overflow. The purpose of this work is to address the following questions:
(1) What data exist in the literature quantifying the efficacy of septic tanks at reducing (a) pathogen numbers and (b) pathogen hazard in human waste?
(2) How do the types of septic tanks encountered in the field differ from those described in the literature and in design standards?
(3) What characteristics of septic tanks are most predictive of hazard reduction performance?
1Conventional fecal sludge management (FSM) tends to ignore the liquid fraction of waste, and instead focuses on the
11
12
CHAPTER II: TARGETED LITERATURE REVIEW
Introduction
Despite the widespread use of septic tanks for domestic wastewater treatment, relatively little is known about the pathogen hazard reduction achieved by these systems, or about how
performance is affected by various design differences. A literature review was conducted to gain an understanding of what data do exist on pathogen flow through septic systems, and what is known about the influence of design parameters. The targeted literature review addressed three questions:
1. In what ways does septic tank design vary globally?
2. What components of design are likely to impact performance?
3. How might we begin to model performance based on known design parameters?
Search Strategy
13
Table 1: Literature review search terms
In w ha t wa ys do es se pti
c tank de
sign va ry globa ll y? W ha t compone nts of de sign ar e li ke ly to i mpac t pe rf orma n ce ? How mi ght we b egin t o model pe rf orm an ce b ase d
on known de
sign pa ra mete rs? design construction characteristic specifications shape size definition material case study hydraulic model pathogen perform baffle2 partition3 compartment4
2 Partial walls utilized in the construction of septic tanks to increase effective flow distance.
14
Screening and Exclusion
Search returns were screened first by title, then by abstract to determine relevance to the study. The following criteria were used as basis for exclusion:
• Papers published before 1950
• Papers not relating to the treatment of domestic or municipal wastewater (for example, those focusing on the treatment of industrial or agricultural waste)
• Papers not pertaining to the containment portion of the septic system (such as those targeting effluent receiver design or other downstream treatment)
15
Results
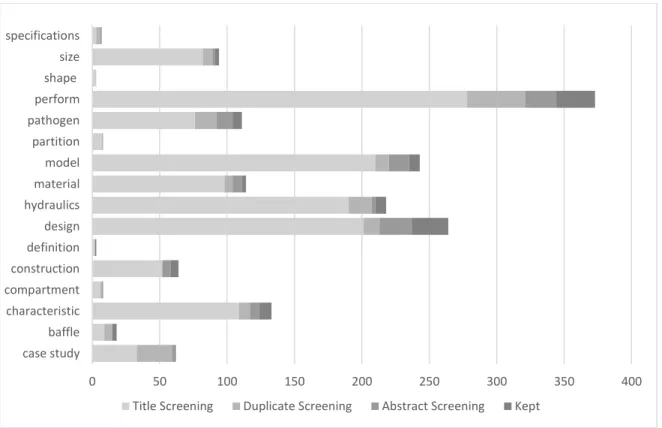
The literature search returned a total of 1,723 papers. Of these, 208 unique papers (after removal of duplicates) were selected for abstract screening, of which 105 were included in the review.
Metadata
Figure 5 illustrates returns by search term and shows the fraction of returned papers that were excluded at each screening step.
Figure 5: Literature search returns and results of screening
0 50 100 150 200 250 300 350 400
case study baffle characteristic compartment construction definition design hydraulics material model partition pathogen perform shape size specifications
16
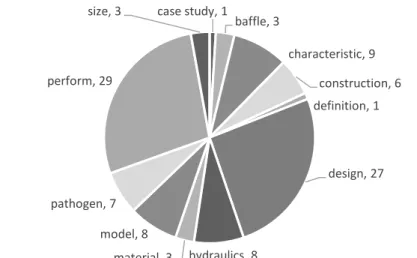
Figure 6 represents the 104 included studies categorized by search term. Over half of the included studies were returned by either design or performance search terms. Four search categories produced no included studies and are not represented in the Figure: shape, partition, compartment, and specification.
Figure 6: Included studies categorized by search term
case study, 1
baffle, 3
characteristic, 9
construction, 6 definition, 1
design, 27
hydraulics, 8 material, 3
model, 8 pathogen, 7 perform, 29
17
Locations of included studies are shown in Figure 7. Studies were included from all continents (except Antarctica); however, the United States (n=20) and United Kingdom/Ireland (n=15) represented a third of the reviewed studies. Other industrialized nations, such as Canada, Australia, and China also comprised substantial fractions of the review.
Figure 7: Map of geographical distribution of studies included in targeted
18
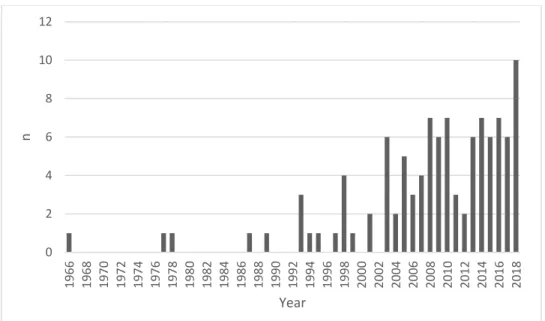
Figure 8 shows the distribution in publication dates of the included studies. The majority of papers (86%) were published after 2002; the most recent year studied, 2018, comprised more of the included papers than any other year. This is not to say that the majority of knowledge about septic tanks has been discovered recently; it merely indicates that more papers were (a) accepted for publication and (b) accessible via the search strategy.
Figure 8: Distribution of publication dates for included studies
0 2 4 6 8 10 12
1966 1968 1970 1972 1974 1976 1978 1980 1982 1984 1986 1988 1990 1992 1994 1996 1998 2000 2002 2004 2006 2008 2010 2012 2014 2016 2018
n
19
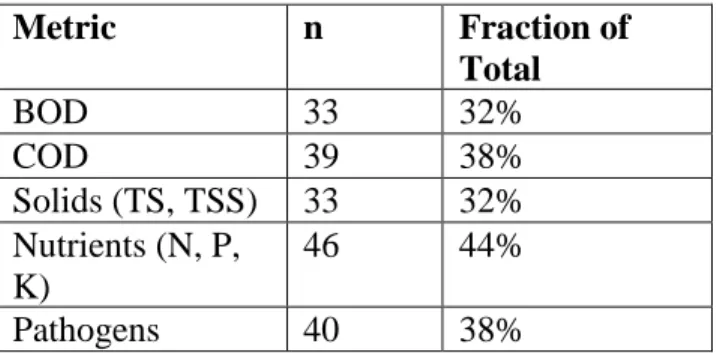
67 of the included studies (64%) reported some measure of effluent quality from septic tanks. The frequency of these measures is shown in Table 2.
Table 2: Metrics of effluent quality reported in literature
Among the 40 studies reporting some pathogen concentration, the majority reported only total coliforms (n=6), only fecal coliforms (n=8), only E. coli (n=9), or some combination thereof. Distribution in reported pathogens is shown in Table 3. Many categories of fecal pathogens were only reported by one or two studies, including protozoa, helminths, and coliphages.
Table 3: Fecal pathogen categories reported in septic tank effluent
Pathogen n Fraction of Total
Total coliform 16 15% Fecal coliform 15 14%
E. coli 14 13%
Salmonella 2 2%
Fecal streptococci 3 3%
Helminth 2 2%
Virus, general 1 1%
Clostridium 1 1%
Norovirus 1 1%
Fecal coliphages 1 1%
Enterococci 1 1%
Bacteria, general 1 1%
Protozoa 1 1%
Metric n Fraction of
Total
BOD 33 32%
COD 39 38%
Solids (TS, TSS) 33 32% Nutrients (N, P,
K)
46 44%
20
In what ways does septic tank design vary globally?
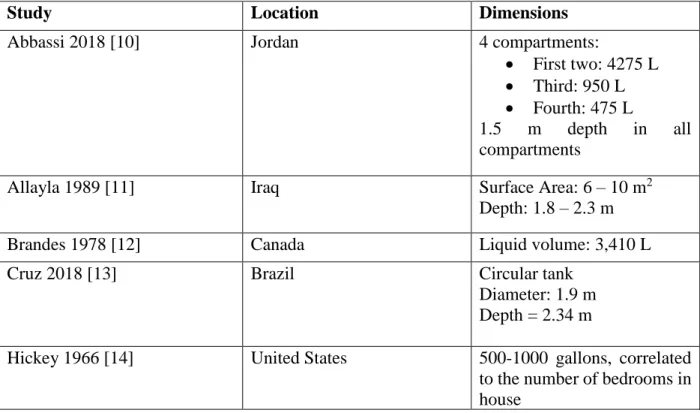
None of the studies included an explicit definition of what a septic tank is, although 40 studies involved some form of in situ case study from which septic tank design could be inferred. Of these, only 5 provided dimensions of the tank; these dimensions, which are each reported with different metrics, are shown in Table 4.
Table 4: Dimensions of septic tanks reported in the literature
Study Location Dimensions
Abbassi 2018 [10] Jordan 4 compartments:
• First two: 4275 L • Third: 950 L • Fourth: 475 L
1.5 m depth in all compartments
Allayla 1989 [11] Iraq Surface Area: 6 – 10 m2
Depth: 1.8 – 2.3 m
Brandes 1978 [12] Canada Liquid volume: 3,410 L
Cruz 2018 [13] Brazil Circular tank
Diameter: 1.9 m Depth = 2.34 m
Hickey 1966 [14] United States 500-1000 gallons, correlated to the number of bedrooms in house
21
Table 5: Number of compartments in septic tanks reported in the literature
Study Location Compartments
Abbassi 2018 [10] Jordan 4
Allayla 1989 Iraq 1
Anil 2016 India 3
Brandes 1978 Canada 3
Butler 1995 United Kingdom 2
Chen 2014 China 3
Cruz 2018 Brazil 1
Dong 2012 China 3
Gray 1993 Ireland 2
Haydar 2018 China 1-3
Lossing 2010 Canada 2
Nasr 2013 Egypt 1-3
Nasr 2015 Egypt 1-3
Wibisono 2016 Indonesia 2
22
What components of design are likely to impact performance?
Although the dimensions of the septic tank are likely to impact performance, dimension data were reported sparsely; only five studies reported the dimensions of the tanks at all, and only three [10, 11, 14] of these also reported pathogen concentrations. Slightly more data exist on the potential effect of the number of compartments in a septic tank. Three of the studies shown in Table 5 compared the performance of tanks with different numbers of compartments, finding that tanks with more compartments performed better in terms of BOD reduction [15] and removal of fecal coliforms [16, 17].
Temperature is also a factor that may influence performance. Viraraghavan [36] demonstrated that reduction in BOD and nutrients was greater in months when soil and air temperatures were higher. Koottatep [37] demonstrated that this trend is true for pathogen removal as well, and outlined a simple concept for a solar septic tank that could be deployed to increase removal efficiency with no active energy input required.
23
How might we begin to model performance based on known design parameters?
Four of the included studies contained some form of modeling approach that may be applicable to this work. Pawlak [53] presented a mathematical model of sedimentation and flotation in a septic tank. This model was not specifically related to pathogen settling; however, if the fraction of pathogens that partition to solids prior to settling could be quantified, Pawlak’s model could be very useful in quantifying pathogen behavior. Similarly, Sharma [54] modeled substrate removal kinetics in a two-phase anaerobic system, finding that the removal rate followed second-order kinetics with a rate constant (k) of 0.36 per day.
Abboud [55] examined the sensitivity of microbial concentration models to various model parameters for flow through porous media. This work found that horizontal flow velocity had a much greater impact on predicted microbial concentration than estimated kinetic constants. However, it is unclear whether this finding extends to flow through containment systems.
24
Discussion
For the purposes of this work, septic tank performance has been defined as the reduction in pathogen hazard achieved by a given system. However, it is evident from the literature review that the evaluation of septic tank performance has generally been based on metrics other than pathogen reduction, such as BOD, COD, and nutrient removal. Even among the papers which reported pathogen concentrations, many focused only on so-called “model pathogens” such as total coliforms, fecal coliforms, or E. coli. These pathogens are frequently chosen as indicator organisms because they are relatively simple and inexpensive to culture and enumerate; they also receive a great deal of regulatory attention since they are an indicator of disinfection capacity. However, the pathogens present in fecal sludge are diverse both in their biology and in their behavior in the environment. In particular, the rate constant k is pathogen-specific, and models of cumulative hazard, such as the one constructed by Lisa Fleming, require the evaluation of rate constants for each individual pathogen. In addition, partitioning behavior of pathogen classes is likely to vary widely based on mass (for example, helminth eggs, which are relatively large, are more likely to settle than smaller organisms such as bacteria) as well as on relative affinity for the liquid versus the solid phase. For these reasons, measurement of indicator organisms is unlikely to be representative of total pathogen hazard, creating a gap in the literature.
25
included studies that were conducted in industrialized countries. Even in more developed nations, there are very few performance management data pertaining to septic tanks; still, more developed nations, which comprised the majority of study locations, are likely to exhibit greater homogeneity in septic tank design than less developed areas. Thus, the design specifications described in the literature are unlikely to be generalizable in a global context. This poses the need for a comprehensive case study in the context of less developed areas.
Many authors acknowledged a need for more comprehensive regulation or septic tank design and maintenance, but few presented actionable suggestions by which regulatory practices could be improved. This demonstrates a need for evidence-based decision-making tools for regulators; without an understanding of the factors most important to protection of public health, it is impossible to make informed recommendations. The lack of performance data suggests that there are very few truly “well-managed” septic tanks in operation, since it is impossible to manage a tank well without knowing how it is performing.
26
CHAPTER III: FIELD STUDY OF ONSITE SANITATION SYSTEMS IN TAMIL NADU, INDIA
Introduction
The targeted literature review in the preceding chapter presented a picture of what septic tank design looks like around the world. It also demonstrated the need for a better understanding of pathogen concentrations and flow in regions with a high density of onsite sanitation systems. A field study was conducted to compare real-life containment systems to those expected from the literature, and to gather data on fecal hazard flow in the study area. This work was conducted as part of a larger study on the FSM chain in Tamil Nadu.
Study Area: Trichy and Coimbatore, Tamil Nadu, India
Tamil Nadu, located in the Southeastern portion of India, is one of the most urbanized of the 29 Indian states. Coimbatore and Tiruchirapalli (Trichy), the second and fourth most
populous cities in Tamil Nadu, were selected as the sites for this case study due to existing work being conducted in the area by the Indian Institute for Human Settlements (IIHS).
In 2016, IIHS conducted a baseline report on sanitation coverage in Coimbatore and in Trichy [57]. This report was conducted as part of the Tamil Nadu Urban Sanitation Support Programme (TNUSSP).
27
despite having access to a toilet; barriers to toilet use include convenience, safety, and
cleanliness. Habits and cultural norms also play a role; in Coimbatore, households without access to private toilets cited “we are fine as we are” as the top reason for not having an individual toilet, outranking cost of construction even in slums.
Underground drainage (UGD) (i.e. sewerage) networks are available in Trichy but not in Coimbatore. In Trichy, 34% of non-slum households and 44% of slum households are connected to the UGD network. The cost of connection to the network is cited as a barrier to adoption of UGD. However, even for households with no option other than connecting to the UGD, frequent clogging and poor maintenance of pipelines – as well as dubious end-of-pipe treatment – may make sewer networks more of a hazard to public health than many realize.
28
Methodology
Site Identification
Locations for sampling and surveys were identified using purposive sampling, which was based on input from local partners during an initial reconnaissance visit in Spring 2018.
Homeowners were contacted to obtain consent to open and sample the tank. In the event that a homeowner later retracted consent, local partners assisted with identifying alternate households.
User Surveys
For each tank that was sampled, the homeowner (or, in the case of community toilets, the community toilet operator) was surveyed about the history, use, and maintenance of the
containment system. A copy of the Sanitation Technology User Survey is included in Annex A. Interviews were conducted by local field staff who were familiar with the language and customs. Responses were recorded and uploaded to the mWater app.
Observational Surveys
In addition to interviews with users, field staff conducted a separate observational survey for each tank, a copy of which is included in Annex B. This survey recorded specifications of the containment system such as dimensions and sludge depth, as well as observations about the condition and maintenance of the containment system and the surrounding area. Observational survey data were uploaded to the mWater app. In addition, sketches were made for each tank, noting the configuration of walls and pipes.
Microbiological Sampling
29
using a fecal sludge deep sampler, which is a capture device capable of collecting an aliquot without creating significant hydraulic disturbance to the tank contents. Each stored sample was the composite of three aliquots, which were aggregated in a clean container prior to storage.
Samples from black pipes (points of direct wastewater discharge) were also collected in order to provide a baseline for raw wastewater composition. These samples were collected by placing a sample bag over the black pipe, securing it with a fitting, and leaving it for 8 hours or until the homeowner called to indicate that the bag was full. Three 1 L samples were collected from the bag and aggregated in a clean container prior to storage. All samples were stored on ice in 1L plastic bottles prior to being transported to the laboratory for analysis.
Laboratory Analysis
Samples collected in Trichy were transported overnight to PSG laboratory in Coimbatore, where they were refrigerated prior to analysis. Those collected in Coimbatore were transported to the laboratory immediately after sampling. E. coli were enumerated using a chromogenic spread plate technique.
Data Analysis
30
Results
Characterization of systems in field
Samples were taken from forty containment systems over the course of the field study. Classifications of technologies encountered are represented in Figure 9. 22 of the systems were classified as fully-lined tanks, which is the category most likely to resemble a conventional septic tank. In Coimbatore, a commonly used technology is a lined tank with impermeable walls and an open bottom; this type of containment system was not encountered at all in Trichy.
Figure 9: Categories of OSS technologies encountered in Tamil Nadu
To determine which of these 22 containment systems might reasonably be considered septic tanks, four criteria were considered. These criteria pertain only to the containment system itself, and do not consider characteristics of the effluent receiver, such as the open drain receiving outflow from the tank. This is an important distinction as this work considers only septic tanks, rather than septic systems; the latter includes an effluent receiver, often a leach field, in which additional pathogen attenuation occurs.
1. Presence of an overflow mechanism, by which clarified effluent may be discharged; 2. Use of T-shaped inlet pipes to minimize hydraulic mixing and reduce the risk of
short-circuiting;
0% 20% 40% 60% 80% 100%
Trichy (n=26) Coimbatore (n=14)
Unlined Pit (UP)
Not Reported
Lined Tank with impermeable walls and open bottom (LT)
Lined pit with Semi-permeable walls and open bottom
31
3. Use of partition walls to separate the tank into two or more compartments; and 4. A length to width (L:B) ratio greater than or equal to 1.5 to provide adequate settling
distance.
The fraction of fully-lined tanks meeting each of these criteria is shown in Figure 10.
Figure 10: Fraction of fully lined tanks meeting each of four septic tank design criteria
The criteria met by each of the 22 fully lined tanks are shown in Table 6. Only one of the systems met all four criteria for the definition of a septic tank; just four tanks met three of the four criteria.
32
Table 6: Design criteria met by each of 22 containment systems
ID Overflow T-Pipes Partitions L:B > 1.5 Criteria Met
TCC-FT-36 No No No No 0
NNP-CT-05 Yes No Yes Yes 2
NNP-FT-08 Yes No Yes Yes 3
TCC-CT-09 Yes No Yes No 1
TCC-CT-16 Yes No Yes Yes 2
TCC-FT-05 No No Yes No 1
TCC-FT-09 Yes No No Yes 2
TCC-FT-12 No No No Yes 1
TCC-FT-13 Yes No No No 1
TCC-FT-15 No No No Yes 1
TCC-FT-17 Yes No No No 1
TCC-FT-22 Yes No No Yes 2
TCC-FT-23 Yes Yes Yes Yes 4
TCC-FT-25 Yes No No Yes 2
TCC-FT-26 No No Yes Yes 2
TCC-FT-31 Yes No Yes Yes 3
TCC-FT-32 Yes No No Yes 2
TCC-FT-34 Yes No Yes Yes 3
TCC-FT-35 Yes No No No 1
TCC-FT-37 No No No Yes 1
TCC-FT-38 Yes No Yes Yes 3
TCC-FT-39 Yes No No Yes 2
With only one exception, inlet and outlet pipes were straight pipes rather than the recommended T-shaped pipes. Further, the configuration of the inlet and outlet pipes was frequently incorrect. In a conventional septic tank, inlet and outlet pipes should be opposite one another in order to provide the maximum horizontal settling distance and minimize the risk of short-circuiting. Instead, many of the tanks encountered in the field had inlet and outlet pipes on adjacent walls or even right next to one another.
33
mechanism, many households opted to empty their tanks shortly after they filled, rather than allowing them to operate at equilibrium.
In addition, when tanks are emptied, the liquid portion of the contents is often all that is pumped; the thicker sludge is left in the tank, until eventually the tank fills completely and requires full desludging. In the case of tanks with multiple chambers, waste is pumped only from the final compartment (due to convenience of manhole access), leaving the other compartment(s) – which have a higher solids content – to continue to accumulate.
Microbiological analysis
The 15 systems found to be fully-lined tanks with overflow were selected for physical and microbiological data analysis5. Three of these systems, (FT-08, TCC-CT-16, and NNP-CT-05) had missing or erroneous laboratory data, and were excluded from the analysis. Total solids and E. coli concentrations for the remaining twelve systems are shown in Table 7.
34
Table 7: Total solids and E. coli in top and bottom samples from twelve septic tanks
Top Sample Bottom Sample
System ID Total Solids (%) E. coli (Log[CFU/L]) Total Solids (%) E. coli (Log[CFU/L]) TCC-FT-09
0.5 5.238046 4.4 4.643453
TCC-FT-13
7.8 5.244277 10.9 4.79588
TCC-FT-17
1.2 3.653213 6.3 3.176091
TCC-FT-22
1.7 3.929419 5.3 6.079181
TCC-FT-23
2.3 2.69897 4.3 3.90309
TCC-FT-25
1.8 4.079181 4.1 3.740363
TCC-FT-31
1.7 4.956649 7.8 3.929419
TCC-FT-32
0.9 3.845098 5.5 3.778151
TCC-FT-34
0.9 3.39794 7.2 3.740363
TCC-FT-35
0.9 4.161368 4.3 3.60206
TCC-FT-38
1.9 4.591065 4.8 5.021189
TCC-FT-39
1.2 4.70757 6.7 4.161368
Table 8: Characteristics of twelve fully-lined tanks with overfl
Pre-assigned System ID
Has the pit or tank ever been
emptied or desludged? Length (m) Width (m) Length to Width- L:B Sludge Depth (m) Total Depth (m) Sludge Volume (m3) Total Tank Volume (m3) Percent Full Last Emptied Age of Tank (years) Time Since Last Emptied (days) Users Available Volume Per User Sludge Accumulation Rate (L/cap-day) TCC-FT-09
No 1.572 0.978 1.607 1.6 2 2.459 3.074 80 2.676 - 2 1.537
TCC-FT-13
No 1.84 1.361 1.351 1.36 1.86 3.405 4.657 73.118 - 8.665 - 30 0.155
TCC-FT-17
Yes 1.202 1.032 1.164 1.43 1.7 1.773 2.108 84.117 5/1/2014 22.676 1582 6 0.351 0.18688
TCC-FT-22
Yes - - - 2/1/2018 10.682 215 16
TCC-FT-23
Yes - - - 9/1/2018 30.695 3 4
TCC-FT-25
Yes 2.663 1.054 2.526 1.425 1.825 3.999 5.122 78.082 5/1/2018 8.665 121 5 1.024 0.661106
TCC-FT-31
Yes - - - 7/1/2015 30.775 1190 9
TCC-FT-32
Yes 3.506 1.17 2.996 2.07 2.36 8.491 9.680 87.711 5/1/2015 1217 11 0.880 0.63429
TCC-FT-34
Yes 2.016 1.211 1.664 2.1 2.48 5.126 6.054 84.677 7/1/2014 31.682 1521 4 1.513 0.84268
TCC-FT-35
Yes 1.672 1.406 1.189 1.76 2.04 4.137 4.795 86.274 3/1/2017 2.676 552 5 0.959
TCC-FT-38
Yes - - - 5/1/2018 20.687 126 4
TCC-FT-39
Yes - - - 6/1/2015 8.679 1191 6
36
Individual correlations between the variables in Tables 7 and 8 are tabulated in Annex C. Only four of these relationships produced statistically significant results. Tanks with a greater age of contents had sludge that was higher in solids (r = .82, 95% CI = 0.45, 0.95). Greater age of contents also produced effluent with lower solids (r = -.73, 95% CI = -0.27, -0.92). Available volume per user correlated negatively with both sludge solids content (r = -0.59, 95% CI = -0.02, -0.87) and effluent solids content (r = -.68, 95% CI = -0.18, -0.90). No similar trend for E. coli was observed. These relationships are summarized in Table 9.
Table 9: Correlations between tank characteristics and physical and microbiological
properties of effluent and sludge
Percent Full Age of Contents
Sludge Accumulation
Rate
Available Volume Per
Person (%) (days) (liters/cap/day) (liters/person)
Effluent E. coli Effluent Total Solids
-0.73 (-0.27, -0.92)
0.68 (0.18, -0.90) Sludge E.
Coli Sludge Total Solids
0.82 (0.45, 0.95)
37
Further, the number of compartments in the tank was considered; correlation between number of compartments and physical and microbiological variables is shown in Table 11. None of these correlations were statistically significant, as indicated by 95% confidence intervals that include zero.
Table 10: Effect of number of compartments on sludge and effluent quality
Variable Correlation with Number of Compartments
(95% CI)
Total Solids, Top -.04 (-0.60, 0.55)
E. coli, Top -.29 (-0.74, 0.34)
Total Solids, Bottom .02 (-0.59, 0.59)
38
CHAPTER IV: DISCUSSION
Characterization findings
Findings from the field work demonstrated that what is locally regarded as a septic tank may not fit the definition used by sanitation engineers. Even in the case of tanks that are fully lined, have an outlet, and have proper mechanisms in place to reduce short-circuiting,
maintenance practices may prohibit the system from functioning as a true septic system. This underscores the need for a better working definition of what qualifies as a septic tank.
In particular, the frequent and improper emptying of septic tanks may be impeding their performance. Consider an empty septic tank. The tank will receive influent wastewater any time there is a flushing event, and the total liquid level will continue to rise until it reaches the outlet pipe. At this point, provided the tank is appropriately sized to provide adequate settling distance, clarified effluent will flow out of the tank as new wastewater comes in to replace it. In time, the tank will reach a microbiological equilibrium; die-off of pathogens in the sludge will be offset by the inflow of fresh pathogens. Further, though in principle the solids level in the tank is rising, the total content volume exhibits steady state behavior, in which volumetric inflows are balanced by volumetric outflows. The tank can continue to operate in this manner until the sludge level rises to a level such that effective liquid volume no longer provides a sufficient hydraulic retention time, at which point the tank should be desludged.
39
soon as effluent began to flow out, they believed it was time to have their tank cleaned. This unnecessarily frequent emptying not only increases maintenance costs, but also inhibits the tank from ever reaching the steady state at which it is designed to operate. This pumping
behavior makes sense from the household perspective, especially since the containment systems with overflow discharge to open drains rather than to a drainfield. Conventional septic systems
rely on the drainfield for additional removal of pathogens, but when no drainfield is present, frequent pumping is more favorable than uncontrolled effluent discharge into the community. This raises the question of whether it even makes a difference whether a containment system is a pit latrine, a septic tank, or somewhere in between; if effluent is not properly managed, unsafe returns are likely to occur regardless of tank design.
40
These inconsistencies raise the question of which systems can reasonably be called septic tanks for the purposes of modeling. The motivation behind deriving a septic tank model that was separate from the one developed for pit latrines is that a septic tank is a flow system, which makes it physically and mathematically very different from a pit. In practice, though, the line between pits and septic tanks is not as clear. It is possible that future definitions of sanitation technology will need to reflect this gray area, particularly if future data show a demonstrable difference in performance between the categories.
For the purposes of this study, a working definition of “septic tank” had to be established so that relevant systems could be selected for modeling. It is evident from the case study that if conventional design standards (such as the use of T-shaped pipes) were applied, almost no systems would be considered septic tanks. Similarly, although design factors such as multiple compartments and a sufficient L:B ratio have been shown to make septic tanks more effective, a system without these can still be reasonably considered a septic system so long as it is (a) a
41
sealed, watertight chamber that (b) discharges clarified liquid effluent. For this reason, the operational definition of the septic tank used in this work is a fully lined tank with overflow. This was the basis for the selection of the subset of containment systems used in the analysis.
Microbiological findings
The variables that were determined to impact tank performance can be divided into three categories:
1. Those pertaining to design and construction of septic tanks (length:width ratio, number of compartments;
2. Those relating to the operation and emptying of the tank (age of contents, sludge accumulation rate);
3. Those that are a function both of tank design and operation (sludge depth, available volume per person).
The variables related strictly to tank design are most relevant to masons, engineers, and regulators; they cannot be changed in tanks that have already been constructed. Those related to emptying and operation can more readily be changed in existing tanks, but depend on a diffuse system of responsibility for tank operation and maintenance. Thus, the findings from these results can be divided into those that have implications for builders and engineers and those that have implications for tank owners.
For planners and engineers
42
regulation is limited, builders of septic tanks are mostly constrained by the tank owner’s budget, as well as their own. In the long term, regulations should be put in place to hold builders
accountable for a minimum set of design standards. Until these design standards are established, there are a few variables that responsible engineers can consider.
Tank sizing is a key variable that must be considered in tank construction. Excess volume translates to excess cost, so it is desirable to keep systems as small as possible while still
preserving treatment effectiveness, particularly in dense urban environments. Still, in addition to the known importance of hydraulic retention time on treatment effectiveness, data show that ensuring adequate tank volume has an impact on treated water quality. Available volume per user was negatively correlated with solids content in both effluent and sludge samples. This finding is somewhat anomalous; by conservation of mass, a lower solids content in one phase should be offset by increased solids in another phase. It is possible that these data are
confounded by the variable amount of flush water used between households.
43
For homeowners
In the short term, homeowners have more control over their tanks’ performance than anyone else. Since onsite sanitations systems are largely unregulated, enforcing any kind of design standards on a large scale will take time and regulatory attention. However, educating homeowners about proper tank operation is, by comparison, very actionable – particularly when the changes they can make to protect public health may also save them money.
If the tanks sampled here were attached to appropriate effluent receivers, these findings would suggest that homeowners are having their tanks pumped too frequently. Since pathogen die-off over time is the main mechanism by which containment systems protect public health, tanks should, in principle, be operated at an equilibrium in which liquid effluent is being discharged. However, since effluent in Trichy and Coimbatore is discharged not to drainfields but to open drains (which presents the opportunity for unsafe returns to the community), this regime does not make sense. Regardless of whether the tank itself meets the criteria of a septic tank, if space or resources do not permit the construction of a proper effluent receiver, the advantages of a septic system will not be realized.
Still, proper emptying procedures can enhance the performance of existing systems. For example, regulators should ensure that emptying operators are pumping from all compartments (particularly the first) and emptying solid contents as well as liquids. This will ensure optimal operation of systems already in use.
Limitations
The limitations of this work are chiefly related to the limited data set, particularly when tanks not meeting the “fully-lined with overflow” criterion are excluded. Although the
44
for future analysis, a larger dataset is necessary to construct a statistically robust model. In addition, analysis is limited due to the lack of paired data points for each containment system. Without knowing the pathogen loading and solids content of the influent wastewater – which likely varies between households – it is difficult to quantify treatment effectiveness in absolute terms. While it is difficult to devise a sampling protocol to capture influent samples, this could be at least partially resolved by sampling the same tanks repeatedly over many days in order to construct a time series to be used in modeling.
To the authors’ knowledge, this work represents the most complete case study of containment system characteristics and treatment effectiveness to date. Still, gaps in the data exist, owing both to unreported fields in survey data and to laboratory limitations. In particular, a key weakness of this work is the analysis of only one pathogen – E. coli – in assessing removal effectiveness. As previously discussed, pathogen attenuation and partitioning both differ by pathogen category, which is a chief criticism of the “model pathogen” approach. Time and resource limitations did not allow for the enumeration of pathogens other than E. coli. Still, the approach developed here can be applied to other pathogens when the analytical capacity exists.
45
Future work
To address the limitations of this work and further develop a pathogen flow model, plans for a third field visit are underway. This visit will aim to:
1. Identify and sample more systems that meet the criteria for septic tanks;
2. Collect samples large enough that they may be examined for other parameters, such as concentrations of helminth eggs and viruses; negotiations are in progress with a laboratory specializing in molecular analysis for virus enumeration;
3. Sample the same tanks over many days and seasons to construct a time series for pathogen concentrations;
4. Collect samples and observational data about other steps in the FSM chain (e.g. sewer points and open drains) to begin to construct a pathogen balance across whole
communities.
46
Conclusions
This work produced the first steps toward developing a flows-based modeling approach to pathogen reduction in septic systems. Although some inferences can be made from the literature, there is limited published information about what design parameters have the greatest impact on pathogen flows. As demonstrated by the Tamil Nadu case study, the distinction between pit latrines and septic tanks is not as clear-cut as the literature would suggest, making it even more difficult to apply previously published findings to the current approach. By
47
APPENDIX A: SANITATION TECHNOLOGY USER SURVEY
Pre-assigned System ID
Has the respondent provided informed consent to participate in the study?
Survey Information
Interviewer Name
Today's Date
Interview Location
Sanitation Facility Location
Identification
Location
System Type
System Number
Location Type
Household Members
What is the total number of people who usually live and eat in your household
How many members of your household are less than one (1) year old?
How many members of your household are between the ages of 1 and 5?
How many members of your household are between the ages of 5 and 15?
How many members of your household are between the ages of 15 and 50?
How many members of your household are more than 50 years old?
Are any members of your household children under 3 years old?
How are the stools of children under 3 years old usually disposed of?
Household Sanitation Infrastructure
What kind of toilet facility do members of your household usually use?
Do all household members exclusively use this toilet when they are at home?
Do you share this toilet with other households?
At home, where do you dispose of greywater (wastewater from kitchen, bathroom, and laundry)?
How do you usually dispose of solid waste at home?
Facility Use and Operation
48
How many people use this facility, in total?
Can any member of the public use this facility?
How many toilets/seats are in use in this facility or are connected to the same containment system?
Is this facility currently usable/operational?
In which year was this facility built?
Take a photo of the toilet
OBSERVATION: Is the facility operational/usable?
OBSERVATION: Does the toilet have a cleanable slab?
OBSERVATION: Is the floor or slab contaminated with feces or urine?
Do you have any toilets, facilities, or containment systems that are no longer in use or have been abandoned?
Containment
Where do the contents of this toilet discharge to?
Take a photograph of the containment system or discharge location
OBSERVATION: Is the containment accessible for emptying?
OBSERVATION: Is there an access point/hatch for emptying?
Take a photo of the most likely access point for emptying this system
Does this containment system have an outlet or overflow?
Has this toilet ever overflowed?
Has this containment system ever filled up or required emptying?
What did you do the last time the containment system filled up?
Has the pit or tank ever been emptied or desludged?
How many times has your pit/tank been emptied in the past 5 years?
In which year and month was your pit/tank last emptied?
On average, how long does it take for your system to fill up or require emptying again?
End of Interview
Interview Result
49
APPENDIX B: OBSERVATIONAL SURVEY
Enumerator Name Location
Community Name
Which part of the Faecal Sludge Management Chain is to be observed? GPS Location for observation made
Today's date
Faecal Hazard Associated with Storage or Containment of Fecal Sludge
Identifying Code
Users of the containment system being observed
What is the type of the sanitation technology being emptied? Is feces or urine visible on the ground around the pit/ toilet?
Is the pit/ tank or effluent receiver (e.g. soakaway, open drain, etc.) covered and the cover slab sealed well?
Is the pit/ tank or effluent receiver (e.g. soakaway, open drain, etc.) full, overflowing or allowing waste to leak onto the ground?
Is the discharge from the toilet pan contained (e.g. in a pit/ tank/ soakway, etc.) or is there visible discharge in the immediate environment (e.g. on open land in the property, or in an open channel)?
Is the connecting pipework blocked or damaged, with signs of effluent leaking into the immediate environment (e.g. on open land in the property, or in an open drain)? Is there evidence that the lined pit, lined tank or fully-lined tank needs desludging? Is there evidence that the lined pit/ lined tank/ fully-lined tank has overflowed before? Is the household toilet or containment system connected to the open drain?
Take two photographs for each observation made
Characteristics of Emptied Containment system
What were the material(s) used for the construction of side walls of the emptied containment system?
50
Does the tank have an inlet pipe to the containment system? Was the tank constructed with an elbow or T-pipe inlet pipe?
Does the tank have an overflow/ outlet pipe to the effluent any receiver? Are there baffle walls in containment system?
Take two photographs for each observation made
End of Interview
51
APPENDIX C: CORRELATION TABLE
Length (m) Width (m) Length to Width- L:B Sludge Depth (m) Total Depth (m) Sludge Volume (m3) Total Volume (m3) Percent Full Last Emptied Age of Tank (years) Age of Contents (days) Users Available Volume Per User Sludge Accumulation Rate (m3/cap-day) Total Solids Top (%)
E. coli Top (Log[CFU/L])
Total Solids Top (%)
Length (m) 1.000 Width (m) 0.009 1.000 Length to
Width- L:B 0.956 -0.279 1.000 Sludge Depth
(m) 0.476 0.178 0.377 1.000 Total Depth
(m) 0.498 0.223 0.389 0.963 1.000 Sludge
Volume (m3) 0.896 0.260 0.768 0.766 0.759 1.000 Total Volume
(m3) 0.917 0.285 0.783 0.715 0.735 0.994 1.000
Percent Full 0.217
-0.006 0.184 0.748 0.541 0.483 0.385 1.000
Last Emptied 0.244 0.167 0.258 -0.412
-0.339 -0.034 0.018 -0.573 1.000 Age of Tank
(years) -0.068
-0.126 -0.060 0.477 0.437 0.225 0.165 0.348 -0.303 1.000 Age of
Contents
(days) -0.246
-0.164 -0.260 0.413 0.339 0.034 -0.019 0.575 -1.000 0.307 1.000
Users 0.080 0.532 -0.087 -0.337
-0.192 0.061 0.138 -0.607 -0.002 -0.203 0.005 1.000 Available
Volume Per
User 0.130
-0.317 0.229 0.563 0.590 0.184 0.152 0.336 0.132 0.049 -0.132
-0.732 1.000 Sludge
Accumulation Rate
(m3/cap-day) 0.262
-0.399 0.391 -0.509
-0.379 -0.142 -0.071 -0.904 0.976 -0.882 -0.976
-0.327 0.200 1.000 Total Solids
Top (%) -0.091 0.478 -0.223 -0.514
-0.338 -0.167 -0.077 -0.788 0.737 -0.097 -0.732 0.859 -0.684 0.910 1.000 E. coli Top
(Log[CFU/L]) -0.234 0.064 -0.224 -0.534
-0.383 -0.367 -0.309 -0.717 -0.115 -0.525 0.124 0.340 -0.139 0.748 0.320 1.000 Total Solids
Top (%) -0.162 0.448 -0.311 -0.192
-0.034 -0.075 -0.014 -0.524 -0.809 0.158 0.816 0.753 -0.585 -0.829 0.729 0.403 1.000 E. coli Top
(Log[CFU/L]) -0.033 0.121 -0.057 -0.244
-0.019 -0.114 -0.042 -0.706 0.511 -0.294 -0.509 0.426 0.037 0.382 0.280 0.337 0.066
52
REFERENCES
[1] W. H. Organization. Sanitation Fact Sheet, Vol. 2019 (in series), 2018.
[2] J. M. Programme. JMP Green Paper: Global monitoring of water, sanitation and hygiene post-2015, 2015.
[3] W. H. Organization. Guidelines on sanitation and health, Geneva, 2018. [4] S. P. Initiative. SFD Manual Volume 1 and 2, Vol. 2017 (in series), 2017.
[5] L. Fleming, A Conceptual Model of Pathogen-Specific Hazards in Pit Latrines Over Time. University of North Carolina at Chapel Hill 2017.
[6] F. Almomani, Environmental Technology, 2016, 37 (5), 521-534. DOI: 10.1080/09593330.2015.1074623
[7] J. F. Wehner, R. H. Wilhelm, Chemical Engineering Science, 1956, 6 (2), 89-93. DOI: 10.1016/0009-2509(56)80014-6
[8] C. Polprasert, K. K. Bhattarai, Journal of Environmental Engineering-Asce, 1985, 111
(1), 45-59. DOI: 10.1061/(asce)0733-9372(1985)111:1(45)
[9] H. B. Fischer, Journal of the Hydraulic Division, ASCE, 1967, 90 (HY6), 187-216. [10] B. E. Abbassi, R. Abuharb, B. Ammary, N. Almanaseer, C. Kinsley, Water, 2018, 10 (5). DOI: 10.3390/w10050578
[11] M. A. Allayla, S. M. Alrawi, Journal of Environmental Science and Health Part a-Environmental Science and Engineering & Toxic and Hazardous Substance Control, 1989, 24
(5), 543-556. DOI: 10.1080/10934528909375499
[12] M. Brandes, Journal Water Pollution Control Federation, 1978, 50 (5), 936-943. [13] L. M. D. Cruz, A. L. Tonetti, B. Gomes, Journal of Water Sanitation and Hygiene for Development, 2018, 8 (2), 268-277. DOI: 10.2166/washdev.2018.094
[14] J. L. S. Hickey, D. L. Duncan, Journal Water Pollution Control Federation, 1966, 38 (8),
1298-&.
[15] S. Haydar, M. Anis, G. E. Hina, J. A. Aziz, M. Arbi, Chinese Journal of Chemical Engineering, 2018, 26 (4), 886-891. DOI: 10.1016/j.cjche.2017.10.015
53
[17] F. A. Nasr, B. Mikhaeil, Desalination and Water Treatment, 2015, 56 (8), 2073-2081. DOI: 10.1080/19443994.2014.961174
[18] M. Al-Shayah, N. Mahmoud, Bioresource Technology, 2008, 99 (16), 7758-7766. DOI: 10.1016/j.biortech.2008.01.061
[19] J. A. Alvarez, I. Ruiz, M. Soto, Ecological Engineering, 2008, 33 (1), 54-67. DOI: 10.1016/j.ecoleng.2008.02.001
[20] A. Coelho, M. B. H. do Nascimento, P. F. F. Cavalcanti, A. C. van Haandel, Water Science and Technology, 2003, 48 (11-12), 221-226.
[21] F. J. A. da Silva, M. G. S. Lima, L. A. R. Mendonca, M. Gomes, Brazilian Journal of Chemical Engineering, 2013, 30 (1), 133-140. DOI: 10.1590/s0104-66322013000100015 [22] S. L. dos Santos, J. P. D. Simoes, F. V. Paiva, A. van Haandel, Engenharia Sanitaria E Ambiental, 2018, 23 (6), 1213-1225. DOI: 10.1590/s1413-41522018166570
[23] S. L. dos Santos, J. P. D. Simoes, F. V. Paiva, A. van Haandel, Water Practice and Technology, 2017, 12 (1), 55-71. DOI: 10.2166/wpt.2017.010
[24] T. Elmitwalli, Y. C. Feng, J. Behrendt, R. Otterpohl, Water Science and Technology,
2006, 53 (9), 45-54. DOI: 10.2166/wst.2006.276
[25] T. A. Elmitwalli, S. Sayed, L. Groendijk, J. van Lier, G. Zeeman, G. Lettinga, Water Science and Technology, 2003, 48 (6), 219-226.
[26] T. Elmitwalli, Water Science and Technology, 2013, 68 (4), 956-964. DOI: 10.2166/wst.2013.337
[27] F. Fdz-Polanco, S. I. Perez-Elvira, M. Fdz-Polanco, Desalination and Water Treatment,
2009, 4 (1-3), 161-167. DOI: 10.5004/dwt.2009.371
[28] K. Kujawa-Roeleveld, T. Fernandes, Y. Wiryawan, A. Tawfik, W. Visser, G. Zeeman, Water Science and Technology, 2005, 52 (1-2), 307-313.
[29] S. P. Lohani, R. Bakke, S. N. Khanal, Water and Environment Journal, 2015, 29 (4),
558-565. DOI: 10.1111/wej.12154
[30] S. Luostarinen, J. Rintala, Water Science and Technology, 2006, 54 (2), 143-149. DOI: 10.2166/wst.2006.497
54
[32] S. C. Oliveira, M. von Sperling, Journal of Water Sanitation and Hygiene for Development, 2011, 1 (1), 37-56. DOI: 10.2166/washdev.2011.022
[33] T. Sabry, Journal of Hazardous Materials, 2010, 174 (1-3), 500-505. DOI: 10.1016/j.jhazmat.2009.09.080
[34] S. A. Samhan, R. M. Al-Sa'ed, N. J. Mahmoud, Water International, 2007, 32 (5), 798-809. DOI: 10.1080/02508060.2007.9671999
[35] G. Wibisono, K. Mathew, G. Ho, Water Science and Technology, 2003, 48 (11-12), 193-198.
[36] T. Viraraghavan, Water Air and Soil Pollution, 1977, 7 (1), 103-110.
[37] T. Koottatep, S. K. Chapagain, C. Polprasert, A. Panuvatvanich, K. H. Ahn, Environment Development and Sustainability, 2018, 20 (1), 495-506. DOI: 10.1007/s10668-016-9892-6 [38] D. Butler, J. Payne, Building and Environment, 1995, 30 (3), 419-425. DOI: 10.1016/0360-1323(95)00012-u
[39] A. H. Havelaar, M. Butler, S. R. Farrah, J. Jofre, E. Marques, A. Ketratanakul, M. T. Martins, S. Ohgaki, M. D. Sobsey, U. Zaiss, Water Research, 1991, 25 (5), 529-545.
[40] H. Harada, N. T. Dong, S. Matsui, Water Science and Technology, 2008, 58 (6), 1305-1311. DOI: 10.2166/wst.2008.715
[41] J. Kaminsky, A. Javernick-Will, Journal of Construction Engineering Management,
2013, 139 (A4013004).
[42] K. J. Levett, J. L. Vanderzalm, D. W. Page, P. J. Dillon, Water Science and Technology,
2010, 62 (7), 1499-1509. DOI: 10.2166/wst.2010.434
[43] H. Lossing, P. Champagne, P. J. McLellan, Water Science and Technology, 2010, 62
(12), 2944-2952. DOI: 10.2166/wst.2010.412
[44] M. Ronteltap, R. Khadka, A. R. Sinnathurai, S. Maessen, Desalination, 2009, 248 (1-3),
369-376. DOI: 10.1016/j.desal.2008.05.077
[45] E. J. Barranco, G. R. Briggs, Florida's master septic tank contractor registration program, On-Site Wastewater Treatment: Proceedings of the Eighth National Symposium on Individual and Small Community Sewage Systems, 1998.