EX VIVO EVALUATION OF NEW 2D AND 3D DENTAL IMAGING TECHNOLOGY FOR DETECTING CARIES
Laurence R Gaalaas
A thesis submitted to the faculty at the University of North Carolina at Chapel Hill in partial fulfillment of the requirements for the degree of Master of Science in
Oral and Maxillofacial Radiology in the School of Dentistry.
Chapel Hill 2015
iii
ABSTRACTLaurence R Gaalaas: EX VIVO EVALUATION OF NEW 2D AND 3D DENTAL IMAGING TECHNOLOGY FOR DETECTING CARIES
(Under the direction of Donald Tyndall)
Proximal dental caries remains a prevalent disease with only modest detection rates by current diagnostic systems. X-ray radiography represents the most common and successful means of diagnosing early dental caries lesions, however; many new systems are available without controlled validation of diagnostic efficacy. This study evaluated the caries detection of three new dental radiographic imaging technologies: an intraoral digital detector employing an advanced sharpening filter, an extraoral
iv
ACKNOWLEDGEMENTS
v
TABLE OF CONTENTS
LIST OF TABLES ... vi
LIST OF FIGURES ... vii
LIST OF ABBREVIATIONS ... viii
OVERALL INTRODUCTION ... 1
MANUSCRIPT 1: CARIES DETECTION BY OBSERVER ANALYSIS ... 3
Introduction... 3
Materials and Methods ... 8
Results ... 16
Discussion ... 18
MANUSCRIPT TWO: EVALUATION OF SYSTEM GRAYSCALE PERFORMANCE ... 44
Introduction... 44
Materials and Methods ... 47
Results ... 51
Discussion ... 53
vi
LIST OF TABLES
Table 1 – Proximal surface ground truth status as assessed by micro-CT ... 29
Table 2 – Full set AZ scores derived from ROC curves ... 30
Table 3 – Truncated set AZ scores derived from ROC curves ... 31
Table 4 – Caries detection sensitivity and specificity scores... 32
Table 5 – Summary of statistical findings for AZ and caries sensitivity/specificity scores ... 33
Table 6 – Depth accuracy correlation with micro-CT assessed depth ... 34
Table 7 – Summary of statistical findings comparing depth observation kappa coefficients ... 35
Table 8 – Cavitation detection sensitivity and specificity scores ... 36
Table 9 – Summary of statistical findings comparing cavitation sensitivity and specificity scores ... 37
Table 10 – Intraobserver agreement for caries presence observations ... 38
Table 11 – Intraobserver agreement for caries depth observations ... 40
Table 12 – Intraobserver agreement for caries cavitation observations ... 42
Table 13 – Summary of statistical findings comparing intraobserver agreement kappa coefficients ... 43
Table 14 – Mean and standard deviation grayscale value by rod density by modality ... 61
Table 15 – Regression and R-square by modality ... 61
Table 16 – Summary of “failed” (non-significant) pairwise comparisons of average grayscale value ... 65
Table 17 – Minimum distinguishable rod density by modality ... 66
vii
LIST OF FIGURES
Figure 1 – Photograph and volumetric rendering of phantom mandible with teeth ... 27
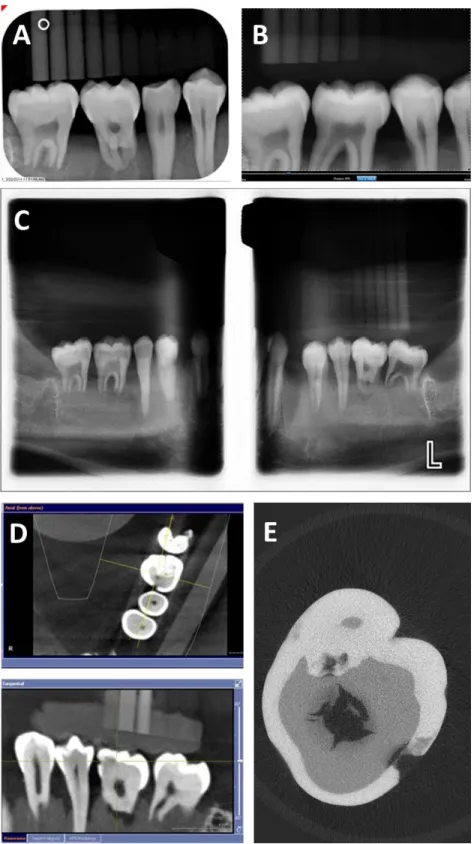
Figure 2 – Representative images of extracted teeth and caries ... 28
Figure 3 – Full set ROC curves by modality ... 30
Figure 4 – Truncated set ROC curves by modality ... 31
Figure 5 – Observed depth correlation with micro-CT depth boxplots by modality ... 35
Figure 6 – Intraobserver agreement boxplots for caries presence observations by modality ... 39
Figure 7 – Intraobserver agreement boxplots for caries depth observations by modality ... 41
Figure 8 – Intraobserver agreement boxplots for caries cavitation observations by modality ... 43
Figure 9 – Volumetric rendering of micro-CT scan of tooth with caries and calibration rods ... 59
Figure 10 – Representative ROIs for each rod and background for all modalities ... 60
Figure 11 – Mean grayscale value by rod density for micro-CT ... 62
Figure 12 – Mean grayscale value by rod density for PSP ... 63
Figure 13 – Mean grayscale value by rod density for Schick33 ... 63
Figure 14 – Mean grayscale value by rod density for PanBW ... 64
viii
LIST OF ABBREVIATIONS
ANOVA analysis of variance
AZ area under the ROC curve
CBCT cone beam computed tomography CNR contrast to noise ratio
DT thesis mentor (Donald Tyndall)
FOV field of view
HAP hydroxyapatite
HD high definition
IRB institutional review board MARS metal artifact reduction software
µSv micro-Sieverts
micro-CT micro-computed tomography or microtomography PanBW Planmeca panoramic bitewings
PI principal investigator (Laurence R Gaalaas) PSP photostimulable phosphor (bitewings) ROC receiver operating characteristic (curve) ROI region of interest
Schick33 Schick 33 direct digital bitewings SdNR signal difference to noise ratio
1
OVERALL INTRODUCTION
This thesis represents two separate but complimentary approaches to evaluating three relatively new dental radiographic imaging systems for proximal caries detection. These new technologies include the Schick 33 intraoral direct digital sensor (Sirona Dental, Salzburg, Germany) employing a new dynamic image sharpening adjustment, a Planmeca ProMax® panoramic unit (Planmeca Inc., Helsinki, Finland) operating in extraoral “panoramic bitewing” mode, and a Sirona Orthophos XG3D CBCT (Sirona Dental, Salzburg, Germany) employing Metal Artifact Reduction Software (MARS), an advanced approach to reducing artifacts in CBCT. Each of these systems is available in the dental market but with little or no controlled independent validation of caries detection efficacy.
The first approach to evaluating caries detection is clinically focused. We employed an ex vivo study design with extracted human teeth placed into a phantom human mandible. Micro-computed tomography was used as a ground truth analysis to establish the proximal caries status of the extracted teeth. Ten expert dentist observers who were blinded to the caries status of the teeth rated confidence in lesion presence, caries lesion depth, and confidence in lesion cavitation with images from each new modality as well as images from a photostimulable phosphor (PSP) “control modality” system. As a “paired-case, paired-reader” study design, all teeth were imaged on all clinical modalities, and all observers viewed all teeth. A combination of lesion presence, depth, and cavitation status assessment along with subsequent receiver operating characteristic, sensitivity/specificity, and correlation analysis methods provided a thorough and holistic view of the systems’ proximal caries detection capabilities.
2
signal response, and contrast resolution. Understanding that radiographic caries diagnosis relies heavily on displayed contrast of dental hard tissues, these evaluations allowed us to compare technical
3
MANUSCRIPT ONE: CARIES DETECTION BY OBSERVER ANALYSIS
Introduction
Dental caries remains the most prevalent dental disease, affecting millions of individuals world-wide. Nearly 80 percent of patients have at least one cavity by 17 years of age, and in general 20% of the population experiences at least 60% of the caries burden, all despite the caries reduction effects resulting from the widespread use of fluoride.1 Overall caries remains a major problem for large segments
of the population.1 Radiology plays a major role in caries diagnosis, particularly for the interproximal
contact regions of posterior teeth where clinical examination is much more challenging.2, 3 Among many
diagnostic modalities the bitewing radiograph stands as the most accepted and best overall approach to detection of dental caries.2-6 The detection rate of proximal caries is far from ideal, however; as standard
bitewing radiographs detect only about 60% of proximal lesions.7-9
The relatively recent introduction of digital dental radiographic imaging has so far failed to demonstrate any increase in caries detection rates. Numerous studies have demonstrated that photostimulable-phosphor (PSP) and current direct-digital bitewing images provide detection rates equivalent to traditional film images.5, 6, 10-15 Digital imaging does allow for more powerful imaging
processing, enhancement, and manipulation compared to traditional film.16 It is also well understood that
that caries diagnosis remains an image contrast-limited task rather than an image resolution limited task
.
17, 18 Limited studies suggest that advanced contrast adjustment improves proximal caries diagnosis19and observer agreement.20 Image sharpening, a variation of contrast enhancement has been explored as
a means to improve caries detection, but most studies have demonstrated no increase in caries
detection.21, 22 Furthermore such image enhancements have been implicated with increased false positive
diagnoses.23 Overall there does not yet appear to be an image enhancement algorithm that delivers clear
4
Compared to intraoral imaging, extraoral imaging promises improved patient comfort and efficiency. These modalities have been evaluated for their caries detection potential with overall mixed and modest results. Standard digital panoramic imaging demonstrates inferior detection rates compared with intraoral imaging due to the superimposition of additional structures, increased image blurriness, and inconsistent opening of posterior proximal contacts.24-26 Conversely, digitally enhanced tomography
images (Cranex® TOME scanograms, Soredex, Tuusula, Finland) demonstrated similar caries detection accuracy to standard film bitewing.27 At this time we are aware of only one published study that has
evaluated panoramic bitewing images (Planmeca Promax®, Planmeca Inc., Helsinki, Finland) for proximal caries detection.28 This study demonstrated inferior detection rates of the extraoral systems compared to
standard intraoral bitewings, but use of root lesions and extensively involved proximal lesions in their sample may have influenced final results.
Cone beam CT (CBCT) imaging in 3D overcomes the fundamental limitation of superimposition of structures inherent to conventional 2D imaging. Many studies have demonstrated CBCT caries detection rates approximately equivalent to intraoral modalities if the teeth are non-restored.15, 29-35 Other studies
have demonstrated increased detection of caries lesions involving the dentin,36, 37 more accurate lesion
depth determination,34 and improved occlusal caries detection35 using CBCT versus conventional bitewing
techniques. A recent review of the literature summarizes that currently, CBCT is equivalent to intraoral techniques at detecting clinically relevant caries lesions in minimally restored teeth but increased dose, cost, time, and artifact concerns dictate that bitewing images are still the preferred modality for proximal caries detection.2
It is understood that beam hardening and streak artifacts from both metal objects and dense tooth structure (enamel) are a major limitation of CBCT imaging.38, 39 In reality beam hardening and
extinction artifacts are significant contributors to streak artifacts.38, 40 Scatter, noise, exponential
edge-gradient, and aliasing effects are additionally implicated in artifact formation but to a lesser extent.40
Various metal artifact reduction techniques are available and their strategies vary from post-processing of the artifacts within the reconstructed images, to preprocessing the raw projection data prior to
5
by artifact.41-44 In general, pre-processing of the raw projection data and iterative techniques
demonstrate more promise in artifact reduction than post-processing approaches.41-43 In both in vitro and
in vivo imaging environments, at least one specific algorithm has demonstrated the ability to increase contrast to noise ratio.45, 46 Despite multiple manufacturer’s efforts, the combination of beam hardening
and streak artifacts in thick proximal enamel and around existing restorations or metallic appliances continues to be a source of caries false positives and a major obstacle for taking advantage of 3D imaging for diagnosing caries.30, 47
Our best understanding of the caries disease process has identified lesion depth, activity, and cavitation status as significant indicators for the likelihood of lesion progression.48, 49 There has been a
corresponding shift in caries treatment philosophy from an aggressive approach emphasizing surgical intervention and tooth restoration, to a preventative approach emphasizing early detection and non-surgical treatment of lesions.1, 4, 50 This non-restorative approach has been shown to reduce overall
dental treatment costs as well as the need for additional dental restorative therapy.48, 50 The new
approach of identifying and treating incipient and early caries lesions places a maximum demand on radiographic imaging systems. With regard to lesion detection, this point represents our rationale for desiring increased sensitivity from new diagnostic systems with no corresponding compromise in the already high specificity rates. This point also raises the importance of a modality’s ability to accurately identify lesion depth and lesion cavitation.51
Radiographic examination plays a role in the assessment of lesion depth, which influences treatment decisions. As a caries lesion progresses, the likelihood of successfully treating the lesion non-restoratively diminishes quickly. The likelihood of more severe dental disease such as infection of the pulp and tooth fracture correspondingly increases. The assessment of lesion depth by radiographic means is important for interproximal surface lesions where clinical assessment of lesion status is not possible. Existing research on the ability of conventional 2D radiographic modalities to accurately identify lesion depth shows mixed results. Limited studies report that 2D bitewing radiographs provide accurate depth assessment,52 whereas most studies conclude that lesion depth assessment from bitewing radiographs is
6
that bitewing images most likely underestimate lesion depth approximately 30%.16 Research on the
ability of CBCT to assess lesion depth is also somewhat mixed with one study indicating no difference in depth accuracy between CBCT and conventional 2D modalities when assessing occlusal lesions,55 and
other studies indicating truly improved depth accuracy of proximal lesions.34, 56
While a single radiograph cannot provide any information about lesion activity, i.e. the current status of tooth surface demineralization versus remineralization, accurate relative depth measurements can provide an indication of lesion activity. Radiographs at different points in time can indicate whether an existing lesion has grown in size (indicating an active lesion) or remained the same size (indicating an inactive lesion). Despite concerns about reproducible image geometry, this radiographic approach to identifying lesion activity has been validated for conventional 2D bitewing imaging.5 In summary,
accurate depth assessment can provide clinically relevant information for caries assessment.
In addition to lesion depth, the presence of lesion cavitation represents a significant component in the decision process of whether to treat a caries lesion by non-surgical or surgical means.57 A cavitated
lesion demonstrates a much higher likelihood of progression because the plaque biofilm becomes physically trapped in the compromised tooth structure, preventing hygienic removal by the patient and blocking the therapeutic effects of remineralizing agents.49 Surface cavitation status has been shown to
be a significantly better predictor of caries lesion progression than lesion depth alone.58, 59
Unfortunately, conventional 2D imaging modalities are largely unable to differentiate the cavitation status of caries lesions.2 Historically, studies have identified a link between lesion depth as
assessed by radiographs and the likelihood of surface cavitation. A treatment-decision threshold was established based on these relationships by which only lesions assessed as extending into the dentin or deeper were selected for surgical intervention.2 Recent work, including a comprehensive literature review,
7
The growing clinical significance of lesion cavitation status is particularly interesting because CBCT provides significantly improved detection of cavitated caries lesions with no compromise in specificity, compared to other common 2D modalities.32, 61 There is general consensus that at an
approximately 30% increase in sensitivity, this boost over conventional modalities is clinically relevant.2
Coupled with the increased emphasis of cavitation status and its implications for treatment decisions, it appears that CBCT could play an important role in caries diagnosis.
A variety of new dental imaging technologies have recently been introduced to the dental market, each having developments that may increase caries detection. These new technologies include the Schick 33 intraoral direct digital sensor (Sirona Dental, Salzburg, Germany), a Planmeca ProMax® panoramic unit in bitewing mode (Planmeca Inc., Helsinki, Finland), and a Sirona Orthophos XG3D CBCT in High Definition (HD) with Metal Artifact Reduction Software (MARS) (Sirona Dental, Salzburg, Germany).
The Schick 33 intraoral sensor has a new dynamic image sharpening filter which alters contrast and may aid in caries visualization. This image sharpening filter directly addresses the contrast-limited task of caries identification.17, 18 The Planmeca ProMax® panoramic bitewing images are acquired with a
new image projection geometry designed to open posterior dental contacts and consequently increase caries visibility. The Sirona Orthophos XG3D CBCT in HD mode with MARS employs artifact reduction algorithms which may overcome the beam hardening and streak artifact limitation in CBCT caries imaging for both restored and non-restored teeth. Conceptually, the Sirona iteration of MARS employs a pre-processing approach that removes dense objects from the raw projection data before reconstructing the scanned volume. It then replaces the dense objects in the volume with appropriate grayscale values. Approaches similar to this strategy have shown the greatest potential for meaningful artifact reduction.42
8
MARS demonstrate reduced beam hardening and streak artifacts, yet the impact of this technique on caries detection with and without dental restorations or appliances has yet to be evaluated.
The National Institutes of Health Consensus Development Conference Statement on Diagnosis and Management of Dental Caries Throughout Life calls for continued research on diagnostic methods, including new devices and techniques.1 Especially because all three of these imaging systems are
available in the dental market, evaluation of their caries diagnostic capability is critical. In vitro/ex vivo studies have been validated as an appropriate means of assessing radiographic caries diagnosis.63
Accordingly, the aim of this project is to establish the diagnostic efficacy of these three new dental radiographic imaging technologies for diagnosing the presence, depth, and cavitation status of proximal caries in non-restored teeth using an ex vivo study design.
Materials and Methods
Institutional review board (IRB) approval was obtained to collect de-identified extracted human teeth from existing tooth repositories and to perform observer sessions at the University of North Carolina at Chapel Hill (UNC) School of Dentistry (Study #13-2843). Tooth selection criteria included human premolar or molar teeth with an unrestored status or minimally restored status with cervical (non-coronal, non-proximal) involvement only. Selection criteria also included proximal caries status of sound/no-lesion or small to moderate sized lesion as estimated by visual, tactile, and bitewing radiographic techniques. Teeth with large, cavitated coronal lesions were excluded. A total of 29 extracted teeth were selected for the sample. Three of the 29 teeth were selected to be used twice in the sample, giving a total tooth sample of 32 teeth/64 proximal surfaces. The three teeth used twice in the sample were selected because they demonstrated simultaneously classic proximal lesion morphology and challenging lesion visibility when screened with bitewing radiography.
9
Premolar/molar pairs were assigned either teeth “19” and “20” positions on the left side of the mandible or teeth “29” and “30” positions on the right side of the mandible. Slight adjustments were made to the randomized order to ensure that the three teeth used twice in the sample were assigned to opposite sides of the mandible. This adjustment step ensured that the duplicated teeth would be imaged in separate right and left anatomic orientations, in effect mirroring their radiographic image and minimizing the possibility for biased observer recall. The individual teeth were numbered and the order of
premolar/molar pairs was recorded so that the exact tooth sequence could be replicated.
Each pair of teeth was placed in its assigned mandible site prior to imaging with each modality. Non-restored and non-carious premolars and molars were placed anteriorly and posteriorly, respectively, to the paired sample teeth. All teeth were arranged as anatomically correct as possible and all contacts were closed to best simulate real patient anatomy. Efforts were made to make contact orientations as parallel as possible in order to minimize the confounding effect of “closed contacts” on the task of interpretation.
A 1 cm layer of wax was placed around the mandible to simulate the effect of soft tissue attenuation of the x-ray beam. For the extraoral imaging modalities (the Sirona XG3D CBCT and the Planmeca panoramic bitewings) an additional water balloon and 3 mm thick by 15.5 cm diameter aluminum cylinder were placed inside and around the mandible/wax phantom, respectively, to simulate the attenuation properties of the human head relevant to extraoral imaging.
10
Intraoral High (#2) setting, 16-bit, invert images, and Image Enhancement: Enable histogram stretch, upper histogram cut 0.3, Lower histogram cut 3.4, Gamma correction 0.7. Images were saved with no additional adjustment of window and level and no additional applied filters.
The Schick 33 (Schick33) direct digital bitewing images were taken with the same Focus intraoral source (Instrumentarium Dental, Tuusula, Finland) at 70kVp, 0.05s, and 40cm SID standard 30cm
rectangular collimation. The software interface for the Schick 33 sensor was run CDR DICOM for Windows Version 5.4.1658.5883 (Sirona Dental, Salzburg, Germany). Exposure time was selected to achieve appropriate receptor exposure according to the CDR exposure indicator tool. Images were acquired with the following settings: Schick 33 High Resolution Acquisition, subtract dark image, acquire 12 bit image. Like the PSP modality, image geometry was controlled by hand for every image resulting in open
proximal contacts for each set of extracted teeth and a clinically relevant simulation of image acquisition. The panoramic bitewing (PanBW) images were taken with a Promax® Dimax 4 unit (Planmeca Inc., Helsinki, Finland), in panoramic bitewing mode operating at 72kVp and 11mA with a square average jaw shape. This particular unit was in active use in a private dental practice in the region. The mandible was placed in the machine according to standard anatomic positioning. Small adjustments were made to the phantom position to ensure open posterior contacts on the images. Dexis Version 9.0.5 imaging software (Dexis LLC, Hatfield, PA) was used to acquire and store the images. Dexis imaging software was chosen instead of Planmeca Romexis native imaging software because Dexis was used exclusively by the private office operating the unit.
The CBCT (XG3D) scans were taken with a Sirona Orthophos XG3D (Sirona Dental, Salzburg, Germany) unit operating at 85kV and 6mA with a 5x5cm FOV, and 0.1mm voxel size. Both high definition (HD) mode and metal artifact reduction software (MARS) were used. Scans were reconstructed and stored using Sidexis XG Version 2.56 software (Sirona Dental, Salzburg, Germany).
11
2cm diameter poly-ether-imid sample tube with 0.7mm wall thickness. To confirm system accuracy, the unit underwent routine weekly bone density calibration using manufacturer supplied hydroxyapatite (HAP) phantoms ranging in density from 99-800 mg/cc. For the year prior to imaging, average variance for the 800 mg/cc calibration phantom was 12 mg/cc which was well within manufacturer tolerances. No beam hardening correction was applied as bone density calibrations were considered accurate and selected system parameters were deemed acceptable for accurate dental tissue imaging. Scans were reconstructed with a 20µm voxel size using Scanco Version 1.2a software (Scanco Medical AG, Bruttisellen, Switzerland).
A total of 10 observers were recruited from the UNC School of Dentistry Division of Oral and Maxillofacial Radiology. All observers had specialty-level training in oral and maxillofacial radiology and familiarity with diagnosing caries on intraoral, extraoral, and 3D imaging modalities. Therefore, all observers were considered to have “expert” skill and knowledge of the radiographic interpretation of caries above and beyond the general dentist level of training. Of the 10 observers, 4 were board-certified faculty members in the division of oral and maxillofacial radiology. The remaining 6 observers were graduate students in the UNC School of Dentistry’s oral and maxillofacial radiology graduate training program.
All observers participated in an orientation session prior to the interpretation sessions. The orientation reviewed study objectives, details of the four different imaging modalities, and the nature of the tooth sample. Observers were instructed on how to properly interpret and respond to three
interpretation tasks regarding caries presence, lesion depth, and lesion cavitation. Proper use of a 5-point scale for receiver operating characteristic (ROC) analysis was explained. Additional emphasis was placed on the nature of beam hardening artifact in CBCT images and the suspected imaging differences from real caries lesions. Example images of both beam hardening artifacts and caries lesions were shown. The software used for each experimental modality was demonstrated. Informed consent to participate in the study was obtained from each observer per IRB protocol.
12
present, 2 = caries probably not present, 3 = unsure, 4 = caries probably present, and 5 = caries definitely present. Task 2: rate the caries lesion depth on a 5-point scale where 1 = caries not present, 2 = caries involving the outer half of enamel, 3 = caries involving the inner half of enamel, 4 = caries involving the outer half of dentin, and 5 = caries involving the inner half of dentin. Task 3: rate the likelihood of lesion cavitation on a 5-point scale where 1 = cavitation definitely not present, 2 = cavitation probably not present, 3 = unsure, 4 = cavitation probably present, and 5 = cavitation definitely present.
Observer sessions were held in the UNC School of Dentistry’s dental student radiology interpretation room. Six dual-monitor workstations with Lenovo LT2252p monitors (Lenovo, Beijing, China) as the primary diagnostic display were available. The diagnostic displays underwent TCG-18 test pattern quality control checks prior to the sessions. Adjustments to monitor brightness and contrast settings were made to confirm visualization of both the 5% and 95% contrast levels in the test pattern. Ambient lighting in the room was subdued to appropriate interpretation levels. The principle investigator (PI) was present during all observer session to troubleshoot and clarify questions.
MiPACS Dental Enterprise Viewer 3.1.1401 (Medicore Imaging, Charlotte, NC) was used for the PSP bitewing interpretation software. Observers were allowed to use brightness and contrast settings but not allowed to use any available secondary imaging filters. CDR DICOM for Windows Version
13
The first observer session began with interpretation of images of four calibration teeth. These extracted teeth were independent of the study sample. The caries status of the calibration teeth confirmed by micro-CT was known by the PI prior to the session. Observers were asked to interpret images of the calibration teeth for all four modalities according to the three specific observer tasks. After interpretation, the PI discussed the known caries status relative to the observer responses and provided guidance to correct any interpretation errors.
Following interpretation and discussion of the calibration set of images, the observers completed interpretation of images of all 32 subject teeth imaged by all four modalities. The sequence of
image/modality interpretation was prescribed so that no modality was biased towards the beginning or end of the session and no set of the same extracted teeth were interpreted in succession. Observers recorded their responses on provided forms. Breaks were allowed during the session to minimize
observer fatigue. After a wash-out period of 2-3 weeks, observers returned to complete a second session. The observers interpreted images of exactly half (16 of 32) of the subject teeth imaged by all four
modalities.
To complete the caries ground truth analysis, each micro-CT scan was reviewed by the PI and thesis mentor (DT) to establish caries status, lesion depth, and cavitation status of every proximal surface in the sample. Decision discrepancies were resolved by consensus following a discussion of the image findings.
Caries observation scores for each observer-modality combination were compiled with the ground truth caries presence status for each tooth using Excel Version 14.0.7143.5000 (Microsoft Office,
Microsoft, Redmond, WA). Receiver operating characteristic (ROC) curves were constructed using a web-based ROC Analysis tool available from Johns Hopkins University School of Medicine (www.jrocfit.org), and fitted area under the curve (Az) scores were recorded. Raw sensitivity and specificity scores were
calculated for each observer-modality combination where caries presence ratings 4 and 5 were considered a positive diagnosis and caries ratings 1,2, and 3 a negative diagnosis.
14
more of all observations were excluded from the initial data set. For two of these surfaces, caries presence was 5 for 100% of observations. ROC curves were constructed from this truncated data set similarly to those created from the full data set.
Observer-modality combination Az scores for both full and truncated data sets were compared
with a fixed-effects main effects two-way analysis of variance (ANOVA). A p-value < 0.05 was considered statistically significant for overall test of effects. Sensitivity and specificity scores were compared with a fixed-effects Freidman’s two-way nonparametric analysis of variance (ANOVA) using observer and modality as main factors. A non-parametric approach was chosen based on the non-normal behavior of sensitivity and specificity scores. A p-value < 0.05 was considered statistically significant for overall test of effects. Appropriate t-test or Wilcoxon rank sum pairwise comparisons were made between modalities when statistical significance was observed between modalities. The Bonferroni adjusted significance criterion was used for post-hoc tests. Because there were six pairwise comparisons among the four modalities, p < 0.05/6 = 0.0083 was considered statistically significant.
15
Cavitation observation scores for each observer-modality combination were compiled with the ground truth caries presence status for each tooth using Excel Version 14.0.7143.5000 (Microsoft Office, Microsoft, Redmond, WA). ROC analysis of the cavitation data was discarded because of the limited number of known cavitated lesions in the sample and the corresponding inability to construct meaningful ROC curves. Raw sensitivity and specificity scores were calculated for each observer-modality
combination where a caries presence ratings of 4 and 5 was considered a positive diagnosis and a caries ratings of 1, 2, and 3 a negative diagnosis. Sensitivity and specificity scores were compared with a fixed-effects Freidman’s two-way nonparametric analysis of variance (ANOVA) using observer and modality as main factors. A non-parametric approach was chosen based on the non-normal behavior of sensitivity and specificity scores. A p-value < 0.05 was considered statistically significant for overall test of effects. Wilcoxon rank sum pairwise comparisons were made between modalities when statistical significance was observed between modalities. Bonferroni adjusted significance criterion was used for post-hoc tests where because there were six pairwise comparisons among the four modalities, a p < 0.05/6 = 0.0083 was considered statistically significant.
The observation scores from the second session were used to determine the intraobserver agreement. For each of every observer’s tooth surface assessment (presence, depth, and cavitation) the level of agreement between the first and second session observations were calculated. It was assumed that images were independent and that ratings were independent. Weights for analysis were as follows: 1 for perfect agreement, 0.75 for one off, 0.5 for 2 off, 0.25 for 3 off, 0 for 4 off. Weighted kappa statistics were calculated and observations that were closer to agreement were weighted higher than those that were further. Kappa values greater than or equal to 0.4 were considered moderate agreement and scores greater than or equal to 0.8 were considered strong agreement. Confidence intervals for each kappa (95%) were produced and any interval that contains 0 suggested that there is no relevant
agreement at the 0.05 significance level. The median weighted kappa for each modality was determined. Weighted kappa coefficients for each observer were compared with one-way analysis of variance
16
between modalities. Bonferroni adjusted significance criterion was used for post-hoc tests. Because there were six pairwise comparisons among the four modalities, p < 0.05/6 = 0.0083 was considered
statistically significant. Analyses were done using SAS software (version 9.3, SAS Institute Inc., Cary, NC).
Results
A photograph and volumetric rendering of the phantom mandible imaging setup can been seen in Figure 1. Example images of extracted teeth and caries can be seen in Figure 2. Micro-CT analysis
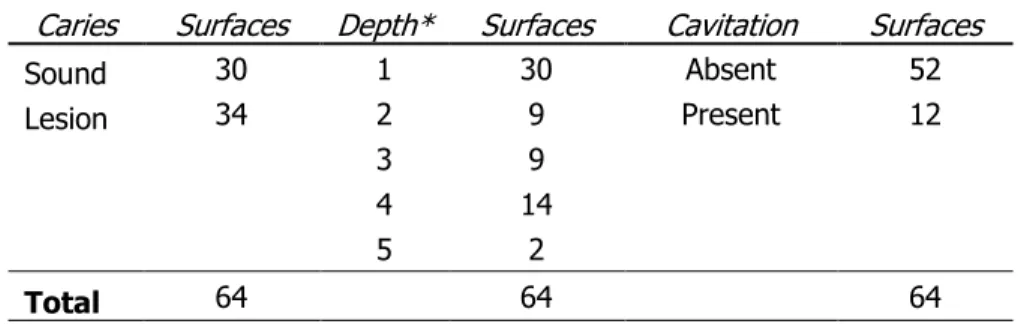
indicated that of 64 total proximal surfaces, 34 surfaces had caries lesions and 30 surfaces were sound. Of the 34 surfaces with lesions, 9 extended into the outer half of enamel, 9 into the inner half of enamel, 14 into the outer half of dentin, and 2 into the inner half of dentin. 12 of the 34 surfaces with lesions demonstrated breakdown of the outer layer of enamel and were classified as cavitated. These findings are summarized in Table 1.
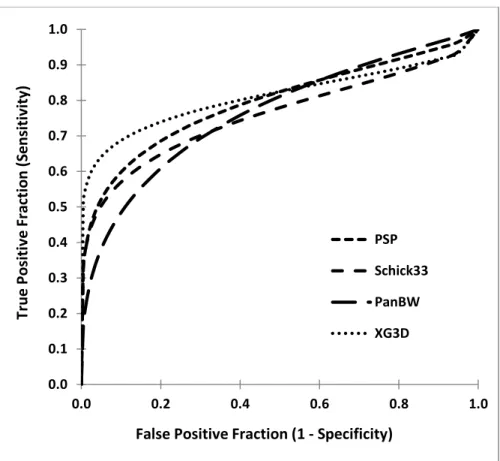
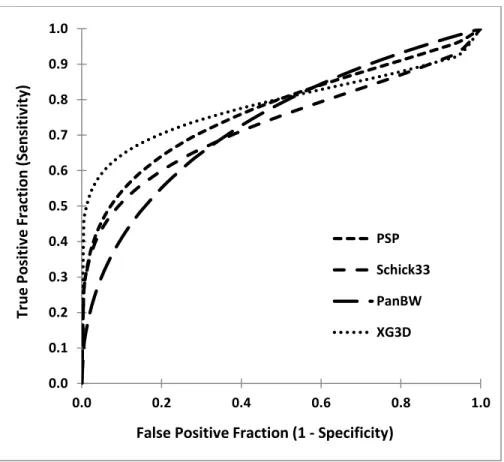
AZ scores for both full and truncated sets are provided in Table 2 and Table 3 with accompanying
compiled ROC curves per modality for full and truncated sets in Figure 3 and Figure 4, respectively. Caries detection sensitivity and specificity scores are provided in Table 4. For the full data set, fixed-effects main fixed-effects two-way ANOVA of Az scores indicated no significant difference between observers
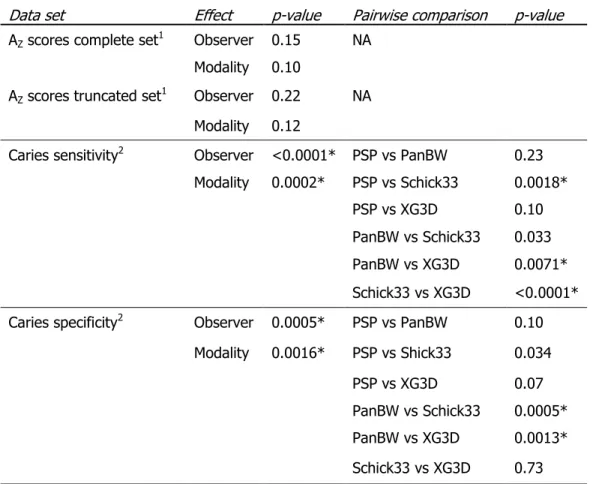
(p=0.15) and modalities (p=0.10). Subsequent analysis of the truncated data set also indicated no significant differences between observers (p=0.22) and modalities (p=0.12). Fixed-effects Friedman’s two-way non-parametric ANOVA of caries presence sensitivity scores for the full data set indicated significant differences between observers (p<0.0001) and modalities (p=0.0002). Similar analysis of specificity scores indicated significant differences between observers (p=0.0005) and modalities
17
(p=0.0005) and XG3D (0.97) demonstrated a higher specificity than PanBW (0.86) (p=0.0013). A summary of statistical findings for caries detection is provided in Table 5.
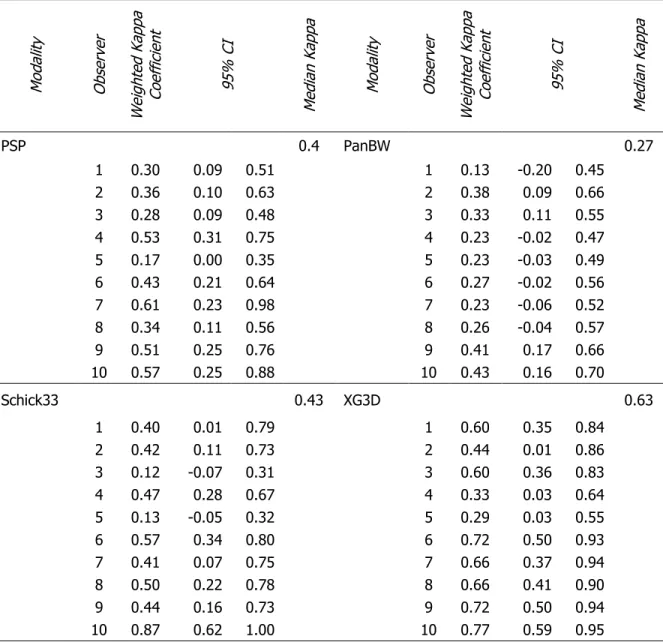
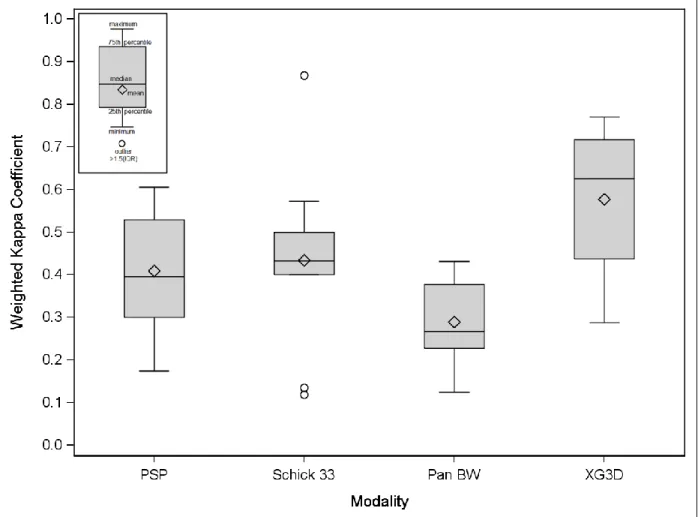
Of the 64 surfaces, the range of true positive depth scores was 14 to 25 for PSP, 9 to 23 for the Schick33, 8 to 25 for PanBW, and 17 to 26 for the XG3D. Weighted kappa values for each observer’s depth score, based on images from each modality, are displayed in Table 6, along with median weighted kappa values by modality. Scores above 0.4 are considered moderately accurate while scores above 0.8 are highly accurate. Observers whose 95% confidence intervals for the weighted kappa includes 0 do not have significant accuracy of depth measurement for the modality. A visual comparison of the weighted kappa values among modalities is displayed in Figure 5. The median accuracy of the observer-assigned depth scores is moderately high for PSP (K = 0.40), Schick 33 (K = 0.43), and XG3D, with XG3D having the best accuracy (K = 0.63). The PanBW modality is considered fairly inaccurate (K = 0.27). One-way ANOVA of kappa coefficients indicated significant differences between modalities (p=0.003). Subsequent t-test pairwise comparisons indicated that XG3D had significantly better depth agreement than PanBW (p=0.002). A summary of statistical findings for the depth analysis is provided in Table 7.
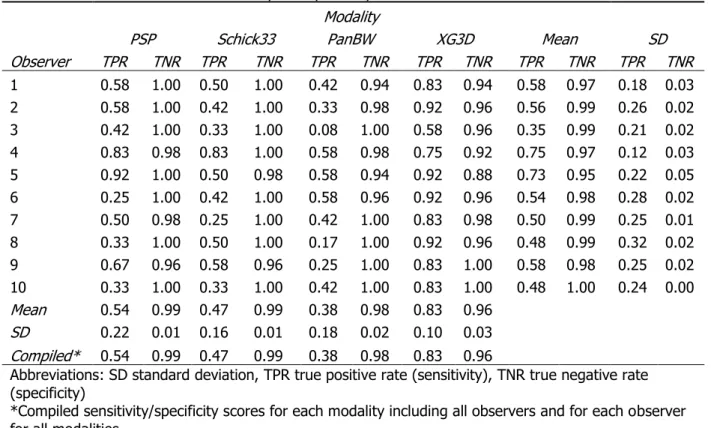
Cavitation detection sensitivity and specificity scores are provided in Table 8. For cavitation sensitivity scores, fixed-effects Freidman’s two-way nonparametric ANOVA indicated significant differences between observers (p=0.0063) and modalities (p<0.0001). In cavitation specificity scores, there were similar significant differences between modalities (p=0.0025) but no significant differences between observers (p=0.1829). Subsequent Wilcoxon rank sum pairwise comparisons indicated that XG3D (0.83) had higher sensitivity than PSP (0.54), Schick33 (0.47), and PanBW (0.38) (p=0.0011, <0.0001, <0.0001). XG3D (0.96) had significantly lower specificity than PSP (0.99) and Schick33 (0.99). Cavitation detection statistical findings are summarized in Table 9.
observer-18
modality combination had at least moderate intraobserver agreement (K>0.40) for the cavitation question. Overall, based on median weighted kappa, intraobserver agreement of caries presence is moderately high for each modality (PSP: K = 0.62; Pan BW: K = 0.62; XG3D: K = 0.65). Intraobserver agreement for caries depth is moderately high for each modality (PSP: K = 0.76; Schick 33: K = 0.74; XG3D: K = 0.73). Intraobserver agreement of caries cavitation is moderately high for each modality (PSP: K = 0.69; Schick 33: K = 0.70; XG3D: K = 0.72). Box plots of intraobserver agreement by modality for caries presence, depth, and cavitation questions are provided in Figures 6, 7, and 8. One-way ANOVA of kappa coefficients indicated no significant differences between modalities for caries presence, depth, and cavitation ratings (p=0.411, 0.376, 0.197, respectively) (Table 13).
Discussion
ROC analysis was chosen as the primary tool for discriminating caries detection abilities between the different modalities because this analysis removes the effect of differences in observers’ decision thresholds and provides the best overall indication of diagnostic accuracy.64-66 ROC analysis of caries
diagnosis indicated no significant differences between modalities in terms of their AZ scores. This
suggests that all four modalities performed equally with respect to identifying lesions. One key nuance of ROC analysis, however, is that two separate ROC curves may have very different curve shapes but the exact same AZ. The difference between curve shapes occurs as a result of a tradeoff between sensitivity
and specificity. Irrelevant to overall diagnostic accuracy, this tradeoff between sensitivity and specificity can be clinically relevant. For caries detection, the tradeoff between sensitivity and specificity is indeed important. It is much more beneficial to the patient and provider to maximize specificity with minimal penalty in corresponding sensitivity because a false positive lesion can result in unnecessary surgical treatment of the tooth at additional cost to the patient and significant detriment to the tooth’s future restorative prognosis.7 Furthermore because caries is increasingly a slowly-progressing disease, the small
19
increased sensitivity, the authors reiterate that we desire improved sensitivity from new diagnostic systems with no corresponding penalty in the already high specificities.
According to this rationale, subsequent analysis of modality sensitivity and specificity scores elucidated potentially relevant clinical differences in performance. PSP (0.57) demonstrated a higher sensitivity than Schick33 (0.48), XG3D demonstrated a higher sensitivity than Schick33 (0.48), and XG3D (0.62) demonstrated a higher sensitivity than PanBW (0.53). Schick33 (0.96) demonstrated higher specificity than PanBW (0.86) and XG3D (0.97) demonstrated a higher specificity than PanBW (0.86). Per the discussion of ROC curves above, these differences in sensitivity and specificity between modalities can be appreciated in Figure 3 and Figure 4. Finding significant differences between observers in the caries and cavitation sensitivity/specificity analyses was not surprising because these measures of diagnostic accuracy are dependent on the individual observer’s decision threshold. This observation reinforces the importance of ROC analysis as a means to assessing overall diagnostic efficacy. The specific ANOVA analyses for sensitivity/specificity results were chosen because they address observer variation before making a determination of significant modality effects.
The tendency of Schick 33 to have lower sensitivity compared to other modalities may be attributable to the dynamic image sharpening slider. Based on observer comments, it was found that different observers had different preferences for the level of sharpness. The immediate adjustment of image sharpness during interpretation may have distracted or otherwise influenced the observers into missing very subtle, difficult to detect lesions resulting in somewhat decreased sensitivity. Alternatively the filter may have truly obscured lesions, making it impossible more difficult to see. However, this study was not designed to test the specific influence of the image sharpening in the Schick 33 system,
therefore no definitive conclusions about the sharpening system itself can be made at this time. Overall the Schick 33 system proved equivalent to the other modalities in the ROC analysis, and demonstrated no significant decrease in specificity. Thus, the Schick 33 system demonstrates equivalent overall diagnostic accuracy and specificity, but lower sensitivity.
20
formed as a result of image acquisition geometry, similar to that in traditional panoramic imaging.24-26
Observers commented that horizontal streak artifact from the contralateral body of the phantom mandible were superimposed over the teeth of interest, resulting in the perception that image interpretation was more challenging. It is possible that these artifacts may have mimicked lesions in a number of cases, resulting in an elevated false positive rate. The fact that the panoramic bitewing modality proved equivalent to other modalities in ROC analysis suggests promise as an effective and patient-comfortable imaging modality, the authors are concerned that a potentially elevated false positive rate could have detrimental effects associated with treatment decisions.
The XG3D cone beam CT system tended to have higher sensitivity than other modalities while incurring no penalty in specificity. This finding is different than previous studies which cited beam hardening artifacts from nearby enamel as a source of decreased specificity (increased false positive diagnoses).30, 47 One possible explanation of reduced false positive lesions is that the XG3D was operating
in HD mode with the MARS reconstruction algorithm. While the MARS algorithm is designed to reduce artifacts from metal restorations in a scan, it is possible that the algorithm may also reduce artifacts from dense tooth structure. An alternative explanation for the reduction in false positive lesions for the XG3D is the investigators’ careful demonstration of beam hardening artifacts versus real caries lesions to the observers. This demonstration may have educated the observers to more consistently avoid false positive diagnoses of artifacts as lesions. Unfortunately, this study was designed to test the overall efficacy of the XG3D system compared to other modalities, not the specific influence of MARS with and without metal objects in the scan or the specific influence of educating observers on artifact recognition. This study also did not examine any differences between far-field and near-field artifact reduction by MARS, when it is known that far-field artifacts are more controllable yet near-field artifacts are possibly more relevant to tooth pathology diagnosis including dental caries.67
21
findings agree with previous studies showing that radiographic assessment of lesion depth with bitewing radiographs is only fairly accurate,52, 53 and that CBCT systems allow better depth assessment.34, 56
Another analysis approach that was considered to measure the accuracy of true positive depth scores was a correlation coefficient. The weighted kappa strategy was chosen over correlations because it better captures how well the modality depth scores actually match the micro-CT scores, and not just a general relationship trend. When assessing accuracy of one categorical variable by another, when each has as few as 5 levels, scores that are off by more than 1 are not considered matches, meaning that such a score from the modality is inaccurate. For example, the ratings from observer 8 on the PSP modality gives a Spearman correlation of 0.71, which supports a linear relationship, and a weighted kappa of 0.338, which suggests that there is little agreement. In fact, a scatter plot of the PSP depth scores by the micro-CT score for this observer shows an increasing trend, thus reasonable correlation, but the markers are quite spread out, meaning that the scores do not often actually match.
The XG3D CBCT system demonstrated markedly better detection of cavitated lesions compared to the other modalities. The XG3D cavitation sensitivity of 0.83, compared to PSP (0.54), Schick 33 (0.47), and Pan BW (0.38) represents an approximately 30% increase in sensitivity over conventional 2D modalities. This finding is highly consistent with other recent studies, some of which include images influenced by metal artifact.2, 32, 61 Our statistical analysis indicated that XG3D (0.96) had significantly
lower specificity than PSP (0.99) and Schick (0.99), however; these reported specificities are all extremely high. The authors conclude that the statistically significant differences found regarding cavitation
specificity are clinically irrelevant because (1) the already very high specificity of the “statistically different” XG3D system, (2) the very poor sensitivities achieved by the other modalities, and (3) the relatively limited number of cavitated lesions in the sample (12 of 64 surfaces), which biased results towards high specificities. Based on the findings in this study and other recent studies,2, 32, 58 it seems
apparent that CBCT affords better detection of cavitated proximal lesions. Evidence suggests that this relationship holds true even in the presence of some metal artifacts.2, 58 Coupled with the increased
clinical importance of lesion cavitation status as a marker for potential progression,57-59 CBCT may
22
Almost all observer-modality combination weighted-kappa correlation scores were at least
moderately agreeing (K>0.40) with most scores demonstrating moderate to high agreement in Tables 10, 11, and 12 and Figures 6, 7, and 8, respectively. A review of similar multireader ROC studies cites a range of intraobserver agreement from 0.35 to 0.59,68 confirming typical results in this study. No
statistically significant differences in intraobserver correlations scores were observed between modalities for the caries presence, caries depth, and caries cavitation questions. This finding indicates that our observers performed uniformly modality-to-modality throughout the study.
CBCT imaging incurs much greater radiation dose, financial cost, and acquisition/interpretation time compared to other imaging modalities. The typical radiation dose for a CBCT scan varies widely from several micro Sieverts (µSv) up to more than 1000 µSv depending primarily on selected scan resolution and FOV.69-71 The Sirona Orthophos XG3D protocol used in this study had an effective dose of 53 µSv per
mandibular posterior quadrant scan.71 Conversely, the dose from a standard set of four PSP or digital
bitewing images is about 5 µSv, and dose from a standard panoramic image (approximately equal to a panoramic bitewing dose) is about 15 µSv.69 The financial cost of CBCT imaging is frequently in the
hundreds of dollars, compared to tens of dollars for bitewing or panoramic/panoramic bitewing exams. The total acquisition and interpretation time for a CBCT may be 10 minutes or more, compared to total acquisition and interpretation time of bitewing radiographs and panoramic/panoramic bitewings lasting 1-2 minutes or much less. These tradeoffs (or lack thereof) of diagnostic efficacy versus various costs must be carefully considered before selecting the imaging modality to address the relevant diagnostic question. With regard to caries detection, it is the authors’ opinion that the marginal increase in lesion sensitivity, marginal increase in lesion depth assessment, and even the drastic improvement in lesion cavitation detection may not be worth the significant increases in dose, cost, and time. Of course, if a CBCT is taken for other clinical indications it appears prudent to assess the visible regions of teeth for caries.
Lack of statistical power is an unlikely explanation for why this study found no statistically significant modality or observer effects on AZ scores from ROC analysis. An estimated sample of 51
surfaces is recommended for a “paired-case, paired-reader” study design72 with the following power
23
frequency, a large level of observer variability, and ten observers.73 Slightly elevated intraobserver
variation in our study compared to this cited power calculation was likely balanced by the modest
increase in number of cases to 64. Furthermore, the authors’ choice of power factors in this study was to deliberately detect clinically relevant differences in detection.73, 74 With believe elevated interobserver
variation in this study was typical and expected because a review of similar multireader ROC studies found that reader variability is almost always larger than modality variation.68
A second explanation for why this study found no statistical significant modality or observer effects on AZ scores is that the sample of lesions was “too easy” to diagnose, resulting in all observations
reaching some non-differentiating maximum level. The authors consider mean AZ scores per modality
ranging from 0.780 to 0.828 as somewhat high relative to other similar proximal caries studies. One might argue that the level of lesion difficultly was not challenging enough to reveal subtle differences in diagnostic capability between modalities. The authors suggest in response that the relatively
well-balanced spread of lesion size used in this study represents a clinically relevant sample of lesion sizes and accordingly our assessment of overall diagnostic capability by ROC applicable to clinically relevant lesions. In other words, intentionally increasing the sample difficulty to reveal subtle modality differences could result in a misrepresentation of clinically relevant modality differences. As an exploratory measure to investigate the influence of “easy” lesions on our sample, four readily diagnosed lesions were excluded from the sample and the ROC analysis was performed on the truncated sample. Subsequent statistical results remained unchanged, providing additional evidence that our lesion sample difficulty was not likely a significant confounding factor in the study results.
24
radiographic caries diagnosis. A typical caries diagnostician may be a general dentist with only general-dental level training in radiographic diagnosis. Also, all images were acquired with ideal image geometry resulting in open proximal contacts, whereas clinical imaging of real patients dictates that it is not always possible to open all posterior proximal contacts. Non-physiologic point contacts established by the random selection of extracted teeth may not mimic true clinical imaging either, because in real patients, proximal tooth contacts demonstrate an element of broadness not perfectly simulated in our experimental system. Of note, the investigators found that acquiring panoramic bitewing images with open contacts using the phantom mandible was significantly more difficult than the other modalities. Once the correct focal layer “jaw shape” was established for the phantom mandible to reliably open posterior contacts, it was observed that there were only several millimeters of tolerance in mandible position that maintained open proximal contacts. While the panoramic bitewing images indicated overall diagnostic efficacy equivalent to the other modalities, it is unclear how frequently closed contacts occur during clinical imaging and how much those closed contacts would influence caries diagnosis. Given the difficulty experienced with opening contacts with a phantom mandible under controlled conditions, the
investigators suspect that closed contacts may be a significant diagnostic obstacle specific to extraoral imaging for caries detection. Additional studies are needed to further clarify how readily panoramic bitewing systems open contacts and the resulting effect on caries detection. Not surprisingly the CBCT scans were very insensitive to phantom mandible position with respect to opening contacts because isotropic 3D imaging allows investigation of any contact area regardless of tooth position.
The traditional gold-standard method to validate dental caries status is visual examination of thin section histology, however, in recent years, micro-CT has proven to be an effective alternative.
Numerous studies have employed and found success with micro-CT as a ground truth caries validation tool with purposes including simple caries detection,75, 76 evaluating lesion depth,55 evaluating progression
of lesion morphology,77 calculating lesion mineral concentration,78, 79 and validating caries removal
techniques.80-82 Micro-CT has also been shown to agree with transverse microradiography, another
accepted gold-standard technique for the evaluation of caries.83 One study reported that micro-CT does
25
having the greatest discrepancy between histology and micro-CT results. They explain that two scenarios associated with histology (not micro-CT) may confound accurate caries identification. First, it is very difficult to create a thin section exactly at the location of a small caries lesion confined to the enamel, and second, that the procedure of sectioning the tooth may cause loss of tooth and/or lesion material. 84
Micro-CT on the other hand allowed unimpeded evaluation of the entire tooth anatomy, including very small lesions. Another study reports that micro-CT generally underestimates caries lesion depth compared to histological assessment.85 However, tooth discoloration/stain due to infiltrative bacterial activity may
confound the assessment of lesion depth with histology and may not represent the true extent of decalcification. Conversely, micro-CT evaluates mineral decalcification directly. The selection of 70 kVp tube potential in this study’s micro-CT analysis is supported by the literature86, 87 and system calibration
efforts outlined in the materials and methods section support well-calibrated imaging. It is the authors’ opinion that this study’s micro-CT analysis functioned as an appropriate and valid ground-truth modality, based on the body of research in support of micro-CT for a caries validation technique, the problems with missed lesions or lost tooth structure associated with histology slice preparation, the possible
confounding factor of tooth stain associated with histology slice analysis, and our selected system technique factors.
In conclusion, this study found equivalent overall diagnostic efficacy for posterior proximal caries detection between three new and one control dental radiographic systems: the Schick 33 intraoral direct digital sensor (Sirona Dental, Salzburg, Germany) employing a new dynamic image sharpening
adjustment, a Planmeca ProMax® panoramic unit (Planmeca Inc., Helsinki, Finland) operating in extraoral “panoramic bitewing” mode, a Sirona Orthophos XG3D CBCT (Sirona Dental, Salzburg,
Germany) employing Metal Artifact Reduction Software (MARS), and the PSP bitewing system utilized in the UNC School of Dentistry radiology clinics. Additional findings from this study clarify potentially important differences between these modalities with respect to their overall caries detection:
26
2. The Planmeca panoramic bitewing images show decreased specificity compared to other
modalities, possibly due to confounding streak or “ghost” artifacts from the contralateral body of the mandible. The resulting increase in false positive diagnoses may be a significant concern regarding unnecessary surgical tooth procedures. Panoramic bitewings appear to be less accurate than CBCT for assessing lesion depth. Difficulty in acquiring Planmeca panoramic bitewing images with open proximal contacts during this study may be an indicator of frequently closed contacts during clinical imaging. More studies are needed on panoramic bitewing systems to clarify how often proximal contacts are closed and the influence on caries detection.
3. The Sirona Orthophos XG3D CBCT shows increased sensitivity compared to other modalities with no significant penalty in specificity. It is unclear whether this system’s artifact reduction
algorithms or increased observer training results in a reduced number of false positive diagnoses. The XG3D also demonstrates more accurate lesion depth assessment than the Planmeca
panoramic bitewing images and substantially better detection of cavitated lesions compared to all other modalities. These diagnostic differences may be clinically relevant, but their value in overall treatment decisions and patient care must be weighed with the substantially increased radiation dose, financial cost, and acquisition/interpretation time associated with CBCT. Given these study findings, it appears prudent that if a CBCT scan is taken for other clinical reasons, proximal regions of teeth visible in the scan that are not corrupted by significant metal artifact should be evaluated for clinically significant caries lesions and cavitation. Additional studies are needed to evaluate the specific influence of MARS on image artifacts with and without the presence of metal objects in the scan (including restorations) and any differences in management of near field versus far-field artifacts.
4. This study was performed with expert observers under ideal viewing conditions with ideal image geometry. These features of study design were chosen to best evaluate the diagnostic
27
Tables and FiguresFig. 1. Photograph of phantom mandible with wax and latex water-filled balloon (A), Volumetric rendering of large FOV CBCT scan of phantom setup (B), note there were no metal or extensive composite
28
29
Table 1. Proximal surface ground truth status as assessed by micro-CT Caries Surfaces Depth* Surfaces Cavitation Surfaces
Sound 30 1 30 Absent 52
Lesion 34 2 9 Present 12
3 9
4 14
5 2
Total 64 64 64
*Lesion depth scale: 1 = caries not present
30
Table 2. Full set AZ scores derived from ROC curves for each modality-observer combination, mean AZ
scores with standard deviations, and compiled* AZ for each modality and each observer
Modality
Observer PSP Schick33 PanBW XG3D Mean SD
1 0.800 0.725 0.757 0.829 0.778 0.046
2 0.680 0.690 0.818 0.781 0.742 0.068
3 0.821 0.856 0.746 0.858 0.820 0.052
4 0.868 0.803 0.781 0.802 0.814 0.038
5 0.846 0.729 0.879 0.832 0.822 0.065
6 0.798 0.762 0.695 0.852 0.777 0.066
7 0.810 0.816 0.755 0.872 0.813 0.048
8 0.899 0.790 0.870 0.842 0.850 0.046
9 0.812 0.814 0.780 0.842 0.812 0.025
10 0.865 0.816 0.828 0.773 0.821 0.038
Mean 0.820 0.780 0.791 0.828 0.805 0.023
SD 0.060 0.052 0.058 0.033 0.031
Compiled 0.795 0.758 0.763 0.811 0.782
Abbreviations: ROC, receiver operating characteristic curve, AZ area under the ROC curve
*Compiled AZ scores for each modality including all observers and for each observer for all modalities
Fig. 3. Full set ROC curves for each modality’s compiled observations. 0.0 0.1 0.2 0.3 0.4 0.5 0.6 0.7 0.8 0.9 1.0
0.0 0.2 0.4 0.6 0.8 1.0
PSP
Schick33
PanBW
XG3D
False Positive Fraction (1 - Specificity)
31
Table 3. Truncated set AZ scores derived from ROC curves for each modality-observer combination,
mean AZ scores with standard deviations, and compiled* AZ for each modality and each observer
Modality
Observer PSP Schick33 PanBW XG3D Mean SD
1 0.796 0.688 0.766 0.817 0.767 0.057
2 0.640 0.660 0.793 0.752 0.711 0.073
3 0.796 0.837 0.712 0.839 0.796 0.059
4 0.855 0.784 0.756 0.776 0.793 0.043
5 0.826 0.693 0.864 0.814 0.799 0.074
6 0.771 0.733 0.662 0.833 0.750 0.072
7 0.785 0.794 0.724 0.855 0.790 0.054
8 0.886 0.762 0.853 0.821 0.831 0.053
9 0.787 0.789 0.749 0.821 0.787 0.029
10 0.848 0.796 0.805 0.742 0.798 0.044
Mean 0.799 0.754 0.768 0.807 0.782 0.025
SD 0.067 0.058 0.063 0.038 0.033
Compiled 0.769 0.730 0.735 0.788
Abbreviations: ROC, receiver operating characteristic curve, AZ area under the ROC curve
*Compiled AZ scores for each modality including all observers and for each observer for all modalities
Fig. 4. Truncated set ROC curves for each modality’s compiled observations. 0.0 0.1 0.2 0.3 0.4 0.5 0.6 0.7 0.8 0.9 1.0
0.0 0.2 0.4 0.6 0.8 1.0
PSP
Schick33
PanBW
XG3D
False Positive Fraction (1 - Specificity)
32
Table 4. Caries detection sensitivity and specificity scoresModality
PSP Schick33 PanBW XG3D Mean SD
Observer TPR TNR TPR TNR TPR TNR TPR TNR TPR TNR TPR TNR
1 0.41 0.97 0.26 1.00 0.24 1.00 0.53 0.97 0.36 0.98 0.14 0.02 2 0.41 1.00 0.32 1.00 0.44 0.90 0.50 1.00 0.42 0.98 0.07 0.05 3 0.71 0.70 0.68 0.90 0.62 0.87 0.74 0.97 0.68 0.86 0.05 0.11 4 0.56 0.93 0.50 1.00 0.53 0.90 0.50 1.00 0.52 0.96 0.03 0.05 5 0.56 1.00 0.35 1.00 0.56 0.93 0.53 0.93 0.50 0.97 0.10 0.04 6 0.74 0.60 0.68 0.80 0.74 0.50 0.76 0.97 0.73 0.72 0.04 0.21 7 0.44 1.00 0.50 1.00 0.47 0.93 0.59 1.00 0.50 0.98 0.06 0.03 8 0.65 0.93 0.50 0.97 0.59 0.90 0.71 0.93 0.61 0.93 0.09 0.03 9 0.65 0.90 0.59 1.00 0.65 0.73 0.65 0.97 0.63 0.90 0.03 0.12 10 0.59 0.93 0.41 0.97 0.50 0.93 0.74 1.00 0.56 0.96 0.14 0.03 Mean 0.57 0.90 0.48 0.96 0.53 0.86 0.62 0.97
SD 0.12 0.14 0.14 0.07 0.14 0.14 0.11 0.03 Compiled* 0.57 0.90 0.48 0.96 0.53 0.86 0.62 0.97
Abbreviations: SD standard deviation, TPR true positive rate (sensitivity), TNR true negative rate (specificity)
33
Table 5. Summary of statistical findings comparing caries presence AZ scores for
complete, truncated sets and caries sensitivity/specificity scores
Data set Effect p-value Pairwise comparison p-value
AZ scores complete set1 Observer 0.15 NA
Modality 0.10
AZ scores truncated set1 Observer 0.22 NA
Modality 0.12
Caries sensitivity2 Observer <0.0001* PSP vs PanBW 0.23
Modality 0.0002* PSP vs Schick33 0.0018*
PSP vs XG3D 0.10
PanBW vs Schick33 0.033 PanBW vs XG3D 0.0071* Schick33 vs XG3D <0.0001* Caries specificity2 Observer 0.0005* PSP vs PanBW 0.10
Modality 0.0016* PSP vs Shick33 0.034
PSP vs XG3D 0.07
PanBW vs Schick33 0.0005* PanBW vs XG3D 0.0013* Schick33 vs XG3D 0.73 *Denotes statistically significant difference
1Fixed-effects main effects two-way ANOVA
2Fixed-effects Friedman’s two-way nonparametric ANOVA and Wilcoxon rank sum
34
Table 6. Depth accuracy correlation with micro-CT assessed depth for true positive diagnoses only
Moda lit y Ob se rver We ighte d K appa Coe ffi cie nt 95 % C I Me dia n Ka ppa Moda lit y Ob se rver We ighte d K appa Coe ffi cie nt 95 % C I Me dia n Ka ppa
PSP 0.4 PanBW 0.27
1 0.30 0.09 0.51 1 0.13 -0.20 0.45
2 0.36 0.10 0.63 2 0.38 0.09 0.66
3 0.28 0.09 0.48 3 0.33 0.11 0.55
4 0.53 0.31 0.75 4 0.23 -0.02 0.47
5 0.17 0.00 0.35 5 0.23 -0.03 0.49
6 0.43 0.21 0.64 6 0.27 -0.02 0.56
7 0.61 0.23 0.98 7 0.23 -0.06 0.52
8 0.34 0.11 0.56 8 0.26 -0.04 0.57
9 0.51 0.25 0.76 9 0.41 0.17 0.66
10 0.57 0.25 0.88 10 0.43 0.16 0.70
Schick33 0.43 XG3D 0.63
1 0.40 0.01 0.79 1 0.60 0.35 0.84
2 0.42 0.11 0.73 2 0.44 0.01 0.86
3 0.12 -0.07 0.31 3 0.60 0.36 0.83
4 0.47 0.28 0.67 4 0.33 0.03 0.64
5 0.13 -0.05 0.32 5 0.29 0.03 0.55
6 0.57 0.34 0.80 6 0.72 0.50 0.93
7 0.41 0.07 0.75 7 0.66 0.37 0.94
8 0.50 0.22 0.78 8 0.66 0.41 0.90
9 0.44 0.16 0.73 9 0.72 0.50 0.94
35
Fig. 5. Observed depth correlation with micro-CT depth boxplots by modality. Table 7. Summary of statistical findings comparing depth observation weighted kappa correlation coefficients (correlation with micro-CT depth assessment)
Data set Effect p-value Pairwise comparison p-value
Lesion depth correlation with micro-CT (kappa)1
Modality 0.003*
PSP vs PanBW 0.62 PSP vs Shick33 1.00
PSP vs XG3D 0.15
PanBW vs Schick33 0.32 PanBW vs XG3D 0.002*
Schick33 vs XG3D 0.30
*Denotes statistically significant difference
1One-way ANOVA with t-test pairwise comparison, Bonferroni adjustment for
36
Table 8. Cavitation detection sensitivity and specificity scores Modality
PSP Schick33 PanBW XG3D Mean SD
Observer TPR TNR TPR TNR TPR TNR TPR TNR TPR TNR TPR TNR
1 0.58 1.00 0.50 1.00 0.42 0.94 0.83 0.94 0.58 0.97 0.18 0.03 2 0.58 1.00 0.42 1.00 0.33 0.98 0.92 0.96 0.56 0.99 0.26 0.02 3 0.42 1.00 0.33 1.00 0.08 1.00 0.58 0.96 0.35 0.99 0.21 0.02 4 0.83 0.98 0.83 1.00 0.58 0.98 0.75 0.92 0.75 0.97 0.12 0.03 5 0.92 1.00 0.50 0.98 0.58 0.94 0.92 0.88 0.73 0.95 0.22 0.05 6 0.25 1.00 0.42 1.00 0.58 0.96 0.92 0.96 0.54 0.98 0.28 0.02 7 0.50 0.98 0.25 1.00 0.42 1.00 0.83 0.98 0.50 0.99 0.25 0.01 8 0.33 1.00 0.50 1.00 0.17 1.00 0.92 0.96 0.48 0.99 0.32 0.02 9 0.67 0.96 0.58 0.96 0.25 1.00 0.83 1.00 0.58 0.98 0.25 0.02 10 0.33 1.00 0.33 1.00 0.42 1.00 0.83 1.00 0.48 1.00 0.24 0.00 Mean 0.54 0.99 0.47 0.99 0.38 0.98 0.83 0.96
SD 0.22 0.01 0.16 0.01 0.18 0.02 0.10 0.03
Compiled* 0.54 0.99 0.47 0.99 0.38 0.98 0.83 0.96 Abbreviations: SD standard deviation, TPR true positive rate (sensitivity), TNR true negative rate (specificity)
37
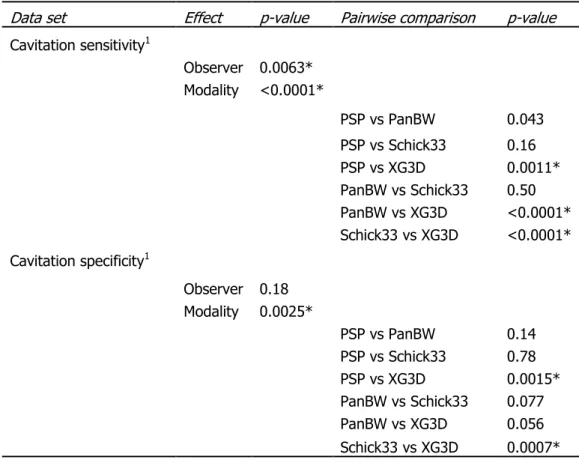
Table 9. Summary of statistical findings comparing cavitation sensitivity and specificity scores
Data set Effect p-value Pairwise comparison p-value
Cavitation sensitivity1
Observer 0.0063* Modality <0.0001*
PSP vs PanBW 0.043
PSP vs Schick33 0.16
PSP vs XG3D 0.0011*
PanBW vs Schick33 0.50 PanBW vs XG3D <0.0001* Schick33 vs XG3D <0.0001* Cavitation specificity1
Observer 0.18 Modality 0.0025*
PSP vs PanBW 0.14
PSP vs Schick33 0.78
PSP vs XG3D 0.0015*
PanBW vs Schick33 0.077 PanBW vs XG3D 0.056
Schick33 vs XG3D 0.0007*
*Denotes statistically significant difference
1Fixed-effects Friedman’s two-way nonparametric ANOVA and Wilcoxon rank sum