Aachen
Department of Computer Science
Technical Report
Empirical Studies for the Application of
Agile Methods to Embedded Systems
Dirk Wilking
ISSN 0935–3232 · Aachener Informatik Berichte · AIB-2008-19 RWTH Aachen · Department of Computer Science · December 2008
The publications of the Department of Computer Science of RWTH Aachen
University are in general accessible through the World Wide Web.
Empirical Studies for the
Application of Agile Methods to
Embedded Systems
Von der Fakult¨at f¨ur Mathematik, Informatik und Naturwissenschaften der RWTH Aachen University zur Erlangung des akademischen Grades eines Doktors der Naturwissenschaften genehmigte Dissertation
vorgelegt von Dipl.-Inform. Dirk Wilking aus Osterholz-Scharmbeck
Berichter: Universit¨atsprofessor Dr.-Ing. Stefan Kowalewski Universit¨atsprofessor Dr.-Ing. Ulrik Schroeder Tag der m¨undlichen Pr¨ufung: 13.11.2008
Diese Dissertation ist auf den Internetseiten der Hochschulbibliothek online
Dirk Wilking
Lehrstuhl Informatik 11
Aachener Informatik Bericht AIB-2008-19 Herausgeber: Fachgruppe Informatik
RWTH Aachen University Ahornstr. 55
Abstract
Agile Methods are a collection of software engineering techniques with specific differences to traditional software engineering processes. The main differences consist of rapid, cycle based development phases setting the focus of attention on feedback of the source code being developed. The results taken from user feedback, software reviews, or other forms of software evaluation are used as a basis for changes which comprise for example corrections of the user interface or the adaption of the software architecture. Based on single techniques taken from Agile Methods, their application to embedded systems software engineering is empirically evaluated in this thesis.
The experiments and studies which have been conducted comprise the tech-niques ofrefactoring, short releases, and test driven development. The results hint to inconclusive effects. For example it could be shown that a constant effort for functional work is achieved by using the short releases technique, but its impact on the resulting software remains difficult to assess. For refactoring a reduced consumption of memory was found, but this effect was created by an overhead for applying the refactoring technique itself.
The effect of agile techniques appears to be inferior to individual software development ability of participants in terms of factor strength. Consequently, the second part of the thesis aims at creating variables for the purpose of experiment control. Variables comprise C language knowledge and viscosity
measuring a participant’s level of reluctance to change a fragment of source code.
An additional experiment consists of the replication of the N-version pro-gramming experiment by Knight and Leveson. The original experiment of independence between two program failures has been extended by an additional factor of hardware diversity. By using different hardware platforms, it has been expected to create mutual independent failures which is not approved by experimental observations.
Acknowledgments
I would like to thank Prof. Dr. Stefan Kowalewski for supporting the overall and sometimes very ambitious aim of this thesis. Prof. Dr. Ulrik Schroeder gave kind advice concerning the human centered approach. I would like to thank Prof. Dr. Dr. Wolfgang Thomas and Prof. Dr. Horst Lichter for participating in the dissertation committee.
The members of the embedded software chair must be mentioned for all the fruitfull discussions and great cooperation. Especially the first three Ph.D. students, namely Dr. Bastian Schlich, Dr. Falk Salewski, and Daniel Kl¨under were a strong point of motivation.
Finally, I would like to thank all my diploma students. Umar Sherwani, David Schilli, Axel Janßen, Sven Abeln, and Ahmad Afaneh amongst others had a strong influence on the results and direction of this thesis.
Contents
I
Introduction
1
1 Motivation 3 2 Thesis Synopsis 5 2.1 Research Question . . . 5 2.2 Research Methodology . . . 6 2.3 Thesis Outline . . . 7 2.4 Bibliographic Notes . . . 8II
Experiments on Agile Techniques
9
3 Overview of Agile Methods related Experiments 11 4 Planning of Embedded Software Projects 13 4.1 The Technique of Short Releases . . . 134.2 Design of the Experiment . . . 14
4.2.1 Variables and Measurement . . . 14
4.2.2 Hypothesis . . . 15
4.2.3 Procedure . . . 15
4.2.4 Participants . . . 16
4.2.5 Threats to Validity . . . 16
4.3 Analysis . . . 17
4.3.1 Quality of the Survey Data . . . 17
4.3.2 Group Differences . . . 17
4.3.3 Main Hypothesis . . . 19
4.3.4 Explorative Analysis . . . 19
4.4 Experiment Results . . . 24
Contents
5.1 The Technique of Refactoring . . . 27
5.2 Design of the Experiment . . . 28
5.2.1 Variables and Measurement . . . 28
5.2.2 Hypotheses . . . 29 5.2.3 Procedure . . . 29 5.2.4 Participants . . . 30 5.2.5 Threats to Validity . . . 31 5.3 Analysis . . . 32 5.3.1 Main Hypothesis . . . 32
5.3.2 Analysis of Additional Variables . . . 35
5.3.3 Experiment Power . . . 37
5.4 Experiment Results . . . 38
6 Test Driven Development 39 6.1 Design of the Experiment . . . 39
6.2 Reasons for Failure . . . 40
7 Summary of Findings 41 7.1 Problem of the Human Factor . . . 41
7.2 Results of Experiments . . . 41
III Experiments on the Human Factor
43
8 Overview of Human Factor related Experiments 45 9 Rasch Models 47 9.1 The Dichotomous Rasch Model . . . 479.2 The Linear Logistics Test Model . . . 48
9.3 Logit as Parameter Units . . . 49
9.4 Benefits and Drawbacks of the Rasch Model . . . 50
10 C Knowledge 53 10.1 The Concept of C Knowledge . . . 53
10.2 Design of the Experiment . . . 54
10.2.1 Variables and Measurement . . . 54
10.2.2 Hypothesis . . . 54
10.2.3 Procedure . . . 55
10.2.4 Participants . . . 55
Contents 10.3 Analysis . . . 58 10.3.1 Test Revision . . . 60 10.3.2 Assessing Validity . . . 61 10.4 Experiment Results . . . 61 11 Viscosity 65 11.1 The Concept of Viscosity . . . 65
11.2 Design of the Experiment . . . 65
11.2.1 Variables and Measurement . . . 66
11.2.2 Hypothesis . . . 67 11.2.3 Procedure . . . 68 11.2.4 Participants . . . 70 11.2.5 Threats to Validity . . . 72 11.3 Analysis . . . 73 11.4 Experiment Results . . . 75 12 Uncertainty 77 12.1 Uncertainty within Software Engineering . . . 77
12.2 Relation to Agile Methods . . . 78
12.3 Design of the Meta Study . . . 78
12.3.1 Variable and Measurement . . . 79
12.3.2 Procedure . . . 80 12.3.3 Participants . . . 82 12.3.4 Threats to Validity . . . 83 12.4 Analysis . . . 83 12.4.1 Overview . . . 83 12.4.2 Non-Productive Effort . . . 84
12.5 Results of the Study . . . 87
12.5.1 Uncertainty in Processes . . . 87
12.5.2 Threats to Validity of Variables . . . 88
12.5.3 Relation to Higher Level Software Engineering . . . 89
13 Summary of Findings 91
IV An Experiment on Dependability
93
14 N-Version Programming with Hardware Diversity 95 14.1 N-Version Programming . . . 95Contents
14.2.1 Variables and Measurement . . . 96
14.2.2 Hypothesis . . . 96
14.2.3 Procedure . . . 97
14.2.4 Participants . . . 98
14.2.5 Threats to Validity . . . 98
14.3 Analysis . . . 99
14.3.1 Independence of NVP with Forced Diversity . . . 99
14.3.2 Replication of the NVP Experiment . . . 100
14.3.3 Assessing the Strength of Factors . . . 102
14.4 Experiment Results . . . 103
V
Measurement Tools
105
15 Code Evolution Framework 107 15.1 Example of an Analysis . . . 10715.2 Code Evolution Data Collector . . . 108
15.3 Code Evolution Data Analyzer . . . 109
15.4 Source Stepper . . . 111
15.5 Module Interface for Data Analysis . . . 112
16 Progress Measurement Environment 115 17 Disturber 119
VI Conclusion
121
18 Lessons Learned 123 18.1 Lessons Learned for Empirical Work . . . 12318.2 Lessons Learned for Software Engineering . . . 124
18.3 The Black Matter of Software Engineering Experimentation . . 125
18.4 Effect Strength . . . 126
19 Results 129 19.1 Agility and Embedded Systems . . . 129
19.2 Variables . . . 130
19.3 The Perfect Experiment . . . 132
A Basic Methodical Approach 135 A.1 Box Plots . . . 135
Contents
A.2 Hypothesis Testing . . . 136
A.3 Test Artifacts . . . 136
A.4 Resampling . . . 137
A.5 T-Test . . . 138
List of Tables
2.1 Short summary of experiments . . . 8
3.1 Overview of agile experiments . . . 12
4.1 U-Test to assess initial differences in performance . . . 19
4.2 U-Test concerning the treatment influence on the different variables 19 5.1 Power calculation of a difference in means of 12 seconds for different sample sizes N . . . 37
9.1 Coding of correct and incorrect answers . . . 47
9.2 Excerpt of a q-matrix for the LLTM . . . 49
10.1 Item parameters and fitness values . . . 58
10.2 Item parameters and fitness values for revised test . . . 61
11.1 Questions and the according item numbers, resembling η param-eter used in the result section . . . 67
11.2 Different models compared . . . 74
11.3 Resulting parameters concerning the twelve questions were put in order by easiness . . . 74
11.4 Resulting parameters concerning libraries. Parameters are given relative to first library (MFC) . . . 76
List of Figures
4.1 Accumulated data points per group and date - one data point is an entry consisting of a specific task, a duration and a type . . . 18 4.2 Overall fraction of different types of work in percent . . . 20 4.3 Mean and normalized functional part . . . 21 4.4 Mean absolute working time in minutes and normalized fraction
of architectural work by treatment. . . 22 4.5 Mean normalized fractions of defect by treatment . . . 23 4.6 Mean normalized fractions of change by treatment . . . 24 5.1 Box plot of mean fixing time of each participant divided by
treatment group, 6 data points per group . . . 32 5.2 Box plots for changed LOC per version categorized by 6 data
points per treatment . . . 33 5.3 Box plots for fraction of development time compared to first
version per modification categorized by 6 data points per treatment 34 5.4 Bootstrap simulation of mean memory difference . . . 35 5.5 Accumulated occurrences of refactoring techniques for 6
partici-pants . . . 36 9.1 Item characteristic curves of items one and eight form the C
knowledge experiment depicting the ogive function . . . 51 10.1 Histogram of the number of years the participants were
program-ming . . . 56 10.2 Frequency of background categories for participants . . . 57 10.3 Goodness of fit plot for two separated groups by median of person
parameter . . . 59 10.4 Boxplots for parameter estimates of C knowledge versus years of
programming . . . 62 11.1 Background of participants . . . 70 11.2 Libraries known to participants . . . 71
List of Figures
11.3 Goodness of fit plot forβ parameters of the basic Rasch model
based on randomized groups . . . 72
11.4 Goodness of fit plot for η parameters of the LLTM based on randomized groups . . . 75
12.1 Example 1 of changes in lines of code - organizational information stripped due to length of the line . . . 79
12.2 Example 2 of changes in lines of code - organizational information stripped due to length of the line . . . 80
12.3 Steps to analyse similar lines in a file . . . 81
12.4 General data for each study . . . 84
12.5 Percentage of effort deleted in each study . . . 85
12.6 Events of deleting source code over all studies . . . 86
12.7 Plot of deleted effort and relative project time . . . 87
12.8 Comparison of the effort spent on productive (final) and non-productive (deleted) lines . . . 88
14.1 The simulation process . . . 100
14.2 Histogram of independent model simulation . . . 101
14.3 Strength assessment of different factors of influence . . . 102
15.1 Accumulated complexity/McCabe metric over time taken from TDD experiment . . . 108
15.2 Structure of stored experiment data . . . 109
15.3 Graphical user interface of the source stepper applications . . . 112
15.4 Effort spent on different aspects in N-version experiment . . . . 113
16.1 Change of functionality by version for two exemplary implemen-tations . . . 115
16.2 Changes of instructions and branches for two exemplary imple-mentations . . . 117
Part I
1 Motivation
The principles of the software engineering process are subject to frequent changes concerning the general paradigm. As pointed out by Boehm [9], the process of creating software was considered as crafting in the nineteen-sixties, formally definable in the nineteen-seventies, productivity oriented in the nineteen-eighties, concurrent vs. sequential in the nineteen-nineties, and agile and value based since the year 2000. The aim of this thesis is to increase findings for agile methods in the special area of embedded software engineering and thus follows the course of current paradigms as defined by Boehm.
Agility in Software Engineering is focussed on a multitude of aspects. Re-garding embedded systems, continuous feedback of the software product’s functionality, early testing, and focus on simple design appear as viable ef-fects for the development process. Especially the design and implementation of sophisticated architectures like AUTOSAR for the automotive domain or CORBA for distributed systems might benefit from these effects. In order to evaluate agile methods for embedded systems, three different techniques were compared using an experiment for each. The reason for this approach originated from the internal structure of agile methods being based on single techniques. The most important representative of agile methods is Extreme Programming introduced by Beck [7]. It consists of twelve individual and different techniques. As each technique is of different importance, only tech-niques relevant to embedded systems were chosen. Thus the techtech-niques of refactoring, test driven development and short releases were regarded to have a high relevance as explained in Section 2.1. The benefits of agile methods are linked to the individual techniques and are rarely subsumed for the entire family of methods. Refactoring as introduced by Fowler [28] has the aim of increasing and maintaining a good internal software structure with a simple design. This is supposed to reduce the effort needed for changes and to increase maintainability of the software. Test driven development is regarded to increase software design quality due to usage of structures before they are created. Another benefit is thought to be an increase in reliability of the resulting software. Especially the creation of a test collection with a sufficient code coverage is in support of the embedded systems need to fulfill the quality of reliability for a given functionality. Short releases are considered to be one of the main differences
1 Motivation
to traditional software development methods. The aim of this technique is to gather rapidly and continuously feedback from users and stake-holders of a software project in order to increase overall perceived quality. This might support the aspect of configurability often found for embedded systems software development. By identifying solutions dynamically during the project lifetime their design quality might be reviewed during the course of the project. The aim would be to find a small software design allowing to implement the required number of configurations.
Combining all these single effects into one paradigm would result in a rea-sonable strong software engineering methodology. The required precondition is that every single technique has the benefits that are propagated. This leads to an individual assessment of techniques which was done within this thesis.
The execution of single experiments revealed problems in the area of noise-induced errors. Although experiment control and design became rigid, results suffered from these disturbance effects. The origin of these effects was supposed to be generated by specific human traits which were not measured directly. The definition and measurement of participant related variables lead to a human centered approach during the second part of the thesis. A general shift to a human centered paradigm guiding software engineering as proposed by Cockburn [19] was omitted, but measuring the human factor for the purpose of control appeared inevitable. Although ”changing” this factor is not possible for software engineering projects in general, controlling this aspect to reduce noise-induced errors is regarded critical for experimentation. Finally, when assessing the effect strength of techniques proposed by software engineering and the characteristics of experiment participants, the question is raised if the the former surpasses the later.
2 Thesis Synopsis
2.1 Research Question
Agile methods are a generic term for a collection of software development methods which focus on short planning and cycle based execution [2]. The methods are a controversial topic that have been evolved over the last two decades (cf. Abrahamsson et al. [3] for a short history). Well-known methods belonging to this family are Extreme Programming [55], Scrum, the Crystal
Family of methodologies and Feature Driven Development. An important agile
method is Extreme Programming consisting of twelve single techniques to be applied within a project. The techniques are:
• On-Site Customer: Collaborative software development with the customer
• Planning Game: Repeated planning meetings ”in the large”
• Metaphor: List of terms taken from the customer’s domain
• Short Releases: Small steps in terms of functional software increase
• Testing: Collection of regression tests
• Simple Design: Implementation of non-complex software architectures
• Refactoring: Continuous structural change to maintain subjectively good design
• Pair Programming: Two programmers work simultaneously on one ma-chine supervising each other’s works
• Collective Ownership: Every developer is responsible for every source code aspect and no individual responsibilities exist
• Continuous Integration: Source code changes are gathered in small itera-tions in a source code repository
2 Thesis Synopsis
• Coding Standards: Source code layout and naming regulations are gath-ered and maintained
• 40 Hour Week: This technique tries to enforce productive work by reducing meetings and controlling overtime
Williams et al. [90] state that empirical evaluation of single techniques is an acceptable approach to increase overall knowledge of agile methods. According to this proposal a subset of these techniques is used in this thesis.
In general, agile methods are a rather well covered area concerning empirical evaluations, although other sources speak of a need for even more experimen-tation [3]. The technique that received the most research attention is pair programming as reported by [1]. Because of this attention and a rather small effect of the pair programming technique as shown by a meta-analysis of M¨uller et al. [64], it was omitted in this thesis. Short releases, refactoring and test driven development were the techniques I considered to have the strongest effect. In addition the application of these techniques could be controlled rather easily. Other techniques like on-site costumer or the planning game were considered as strong effects, but creating a realistic environment to test them would have been difficult as they require long projects with bigger project groups. As this environment was not feasible, the direct programming techniques presented above were evaluated.
2.2 Research Methodology
The decision to work empirically was mainly influenced by Tichy [82]. In order to evaluate software engineering process related techniques, a measurement driven approach appeared as viable. During the second part of the thesis, the focus on person related measurement made it necessary to ”borrow” methods and artifacts (as proposed by Singer et al. [79]) from other disciplines which are mainly human and social sciences. Experiment design, treatment, size of participant groups, control group, effect strength and so on are all concepts which were taken from human science and accordingly are rarely found in computer science. Nevertheless the generic concept of experimentation catches hold in all sciences and only variable acquisition was directly influenced by human sciences. The acquisition particularities comprise for example the Hawthorne effect describing a change in human behavior in an experimental situation. Human behavior tends to support the experimenter in showing a significant difference, which in turn makes the study invalid. Other examples taken from human science experimentation are the use of randomization in
2.3 Thesis Outline
order to factor out individual differences in performance which otherwise might blur a given treatment effect. Apart from a variety of computer science articles describing experimentation for software engineering in detail, a good source for software engineering experimentation is given by Bortz and D¨oring [12].
One complaint about software engineering experimentation is that students are not considered representative for individual software developers. As ex-plained in [80], this type of participants is sufficient for evaluating basic effects or an initial hypothesis which was the aim of this thesis. H¨ost et al. [42] state that at least last-year software engineering students have a similar assessment ability compared to professional developers. In [15] no general difference could be found for a different programming expertise between these groups. Accord-ing to these findAccord-ings students are considered sufficient for the evaluation of basic effects. Looking at this from a different point of view, an effect that only affects the group of professional or expert developers can be regarded as too specialized for an application in software engineering. Incorporating the average programmer into software engineering experimentation appears as a more holistic approach.
2.3 Thesis Outline
The main aspect of this thesis is divided into three distinct experiment families which appear as separate parts. Agile methods related experiments are presented in Part II of the thesis. It comprises the short releases experiment (Chapter 4), the refactoring experiment (Chapter 5), and the test driven development related experiment (Chapter 6). Part III presents experiments which are related to assessing the human factor consisting of the C knowledge experiment (Chapter 10), the viscosity experiment (Chapter 11) and the uncertainty related experiment (Chapter 12). Part IV contains the experiment about N-version programming (Chapter 14). This experiment is not directly related to agile methods but presents a replicated experiment and is included for the purpose of reference. For each of these parts an individual summary is given consisting of a collection of findings and their interpretation. The experiments are presented in chronological order in Table 2.1 withN being the number of participants. The domain the experiment belongs to is given, additionally.
A brief overview of the created tools is given in Part V. They are presented in this thesis because of the tacit knowledge they contain and because of the additional variables they generate within experiments. The thesis is closed by Part VI comprising an interpretation of the results for the application of agile methods in embedded system software engineering, empirical work in general
2 Thesis Synopsis
Name Domain Type N Chapter
Planning Horizon Agile Methods Experiment 28 4
N-version Progr. Dependability Experiment 24 14
Refactoring Agile Methods Experiment 12 5
Test Driven Development Agile Methods Experiment 24 6
C Knowledge Empirical variable Experiment 151 10
Uncertainty Agile Methods Meta study 51 12
Viscosity Empirical variable Experiment 63 11
Table 2.1: Short summary of experiments
and additional observations that are based mainly on experience gathered within the experiments and lab courses that were executed.
Each experiment is presented using the same template. It consists of a background description, an experiment design, an analysis, and a section for result interpretation. The structural presentation of the experiments is loosely based on the template suggested by Wohlin et al. [91].
2.4 Bibliographic Notes
The experiments presented in this thesis were published on different conferences and in a journal. The N-version programing experiment was published in [74]. A slightly more detailed description of the refactoring experiment was published in [88].
Regarding the human factor related experiments, the variable for C knowledge and more details on the underlying Rasch model are given in [89]. A more thorough tool description for the code evolution framework described in Chapter 15 can be found in [87].
Part II
3 Overview of Agile Methods
related Experiments
The following three experiments are directly related to specific techniques of the Agile Methodology. Although a considerable number of techniques exist, the most promising techniques were chosen as described in Chapter 2.1. At first the technique of short releases was tested as this was thought to be the main difference between traditional and agile paradigms. The main treatment of this experiment was to induce frequent planning and result phases compared to one long phase of planning and development. 28 students participated in this experiment which was executed during a lab course. This experiment is described in Chapter 4.
Consequently the presumably second strongest factor i. e. refactoring was empirically evaluated. For this experiment twelve developers were divided into two groups with one group having to apply a controlled refactoring to its program while the second group had to execute a placebo treatment consisting of an additional documentation. Details and results of this experiment are presented in Chapter 5.
Finally the test driven development technique was assessed within another experiment. The aim here was to test if the overall reliability was influenced by this method. In addition to the twelve student taking part in this experiment, it was planned to reuse results from earlier experiments in order to identify a change in reliability. Due to organizational problems concerning the time frame and place of this experiment, only a few students successfully finished this course. The resulting number of six measurement points was insufficient to perform an inference statistical test. Although this experiment failed, details and problems are described in Chapter 6 in order to enhance quality of further studies of that technique.
Table 3.1 presents the properties of each experiment which are important for a statistical assessment. Regarding the size of treatment group Nt, the
refactoring experiment was the only experiment with very few students. The number of students for the test driven development experiment was higher because of the existing data being reused. In order to cope with small groups in experiments, the inference test used during the statistical analysis was changed.
3 Overview of Agile Methods related Experiments
Name Nt Variable Source Inference test
Planning Horizon 7 Effort Survey U-Test
Refactoring 6 Time Measurement Resampling
Test Driven Development 12 Failures Test environment Resampling
Table 3.1: Overview of agile experiments
Resampling (or bootstrapping) is a method which reuses the observed results
and therefore is able to omit certain assumptions. For example a t-Test has the precondition that the observed data follows a normal distribution which is difficult to assure for small experiment sizes. Due to the fact that resampling easily scales up to bigger sized experiments, this method was used since the second experiment. Another quality assessment of an experiment is given by the measurement variable and its source. Again the planning horizon used a rather rough main variable based on a survey for effort estimation. The refactoring experiment used a stopwatch time measurement while the test driven development experiment used a hardware test environment to count the failures of a system.
4 Planning of Embedded Software
Projects
4.1 The Technique of Short Releases
Regarding the different development methods related to Agile Methods [2], similarities between the approaches can be found. The most important simi-larity consists of short releases meaning that short implementation phases are continuously re-iterated by an intermediate organizing phase. A characteri-zation of this organizing phase leads to a similar significance as the general planning phase of an arbitrary software development. For Agile Methods the target time frame and the specification focus has a length of one (the next) development cycle. The length of these cycles differs strongly between different types of Agile Methods and ranges from two days (feature driven development) to approximately four weeks (Extreme Programming) as depicted in [17].
The experiment presented in the following was executed in order to assess one of the basic differences of agile and traditional methods: short releases of the agile approach compared to long phases of waterfall based methods. The waterfall method is taken as a reference because it is considered as the most prominent representative for traditional methods. The main purpose was to assess the impact of the different planning approaches on the outcome of a software project. The underlying reason to start such an experiment was based on the assumption that errors which were discovered late in a project threaten the project’s success. But as stated in Lippert et al. [55], this model of rising costs for changes in a project at a later project stage might be wrong.
The overall aim of the planning phase of a waterfall approach is to build a software architecture and a schedule for the entire lifetime of the project. This approach respectively allows to control the time and the programming tasks for multiple programmers in a project. The Agile Methods’ approach of planning consists of a reflection of the system created so far and a shorter planning focused on the next cycle. The intended time frame in conjunction with the different focus is considered as the difference in project execution and named planning horizon in the following. This rather informal term comprised
4 Planning of Embedded Software Projects
the main differences in the treatment of the experiment.
4.2 Design of the Experiment
In order to run the experiment, a lab course consisting of 28 students was taken as a platform (cf. [16]). The students were randomly divided into two groups. The first group used a traditional approach, where the design of the system architecture and the implementation planning constituted the initial phase. The second group was asked to deliver a usable and useful system source code every two weeks. The method for assessing the influence of the design horizon on the software development was to compare the time expended for the lab course by the different groups.
4.2.1 Variables and Measurement
Two types of main data collection devices were used. The first one was a log book which had to be filled out biweekly by the students (cf. [41] and [92] for similar approaches). Here a rough description of the work was required with a precision level of minutes. In addition to the general description in a single log book entry, the task’s type had to be documented. The possible choices were a functional, a planning, an architectural, a failure removal, or a non-function oriented change task. The overall development time could be calculated from these entries.
The controlled variable during this study was the planning time which was changed in length. The group with a short planning horizon was asked to omit a long time planning and to provide newly programmed source code every two weeks. The other group was asked to provide an architectural description of the system in UML together with a time schedule to program the different modules. While the first group progress was checked directly every two weeks, the second group provided UML diagrams and Gantt diagrams only once at the beginning. After that, no further control of development was made for this group.
Although a multitude of environments and principles for data collection exists (cf. [6], [18], [26], [90]), the approach taken in this work was different. In order to show a general influence of the effect, the data collected dealt with the parameters of the experiment. Therefore this log book oriented data collection can be regarded as a special measurement tailored for this experiment.
4.2 Design of the Experiment
4.2.2 Hypothesis
The early creation of a system architecture and a time schedule in the long planning horizon group were assumed to lead to an increased development effort during the late phases of the project. The reason for this assumption was expected to be the focus on non-critical aspects of the development. The main functional part of the system was assumed to be done late in the project and this was thought to impose major changes in architecture, modules and the system in general. Overall this leads to the more general hypothesis of:
H1 :tL 6=tS
Here tL denotes the overall development time of the long planning horizon
group and tS the overall development time of the short planning horizon group.
According to the principal of falsification, the hypothesis used in the inference test used the counter hypothesis H0 being
H0 :tL=tS.
4.2.3 Procedure
The system that had to be developed by the students consisted of a digital signal processor (DSP) and an ultrasonic sensor as used in an automotive environment. The purpose of the system was to provide pre-crash warning with automatic breaking. The functionality to be developed included the following tasks:
• Accessing an ultrasonic range sensor
• Computing the level of danger of collision based on the measured range
• Communicating the range to another DSP using a predefined protocol The DSP was a C5416 by Texas Instruments. The language used in the project was C++ and the development environment was the standard IDE provided by Texas Instruments DSPs (Version 2.2). The location that was used to develop the software was either the computer pool or the system was developed at home. In both cases no direct monitoring took place. Because of an insufficient number of hardware systems and a lack of working space a simulator was developed and given to the students. This simulator focused on the communication and sensor aspects of the main task. In conjunction with the instruction set simulator from Texas Instruments this environment simulator was able to provide a complete development environment.
4 Planning of Embedded Software Projects
4.2.4 Participants
The experiment itself was embedded into a main study period lab course at the RWTH Aachen University. The project lasted 15 weeks. The participants for this experiment were composed of 28 main study period students working in teams of two.
The participation was not controlled directly, instead the students took part in an election procedure allowing them to choose their favorite course.
Ethical issues, discussed for example in [22] and [76], were countered by using the data after the lab course had finished1, by keeping the results anonymous and by voluntary participation2.
4.2.5 Threats to Validity
The communication between students was a clear threat as the groups’ results could become dependent among each other. This concerns architecture design as well as the approach chosen to develop the software.
The usage of different practices of software engineering, like test driven development, pair programming etc. had to be controlled in order to increase the experiment’s internal validity. Except for UML and Gantt chart based modeling no special practices were allowed during the development. The usage of UML and Gantt charts were regarded as a low threat.
The data collection was not controlled directly due to the high number of participants and the length of the experiment. This threat was encountered with a detailed introduction to the logbook using an example allowing the students to use the logbook as it was intended to be used. In addition the logbook artifact was tested during a preparation phase.
There was a considerable number of students who quit the course. Two long planning horizon groups stopped working after about three quarters of the lab course had passed. In addition one long and one short planning horizon group were reduced to only one programmer and therefore have been removed from the data analysis as well.
The language C++ is a threat when programming an embedded system. The reason for that is that C is regarded as the lingua franca for embedded systems. The language C++ was used during this experiment because object oriented languages allow a better design representation of the software architecture using the UML. This was considered an aspect supporting software design in general. The team size with only two developers is very small which is a threat. The
1The logbook sheets were collected in an unaccessible box.
4.3 Analysis
advantage on the other hand is having an increased number of measurement points supporting the conclusion’s validity. Because of this, the team size can be regarded as a trade off. The experience of the developers is a threat as well, although the degree of an advantage in experience is unknown.
4.3 Analysis
As a first analysis step the quality of the biweekly provided survey data is checked. This is followed by tests which are applied on the initial surveys filled out by the participants. The initial surveys were executed in order to control equality of previous knowledge of both treatment groups.
The most important hypothesis was that both treatment groups needed the same effort to finish their project. This is considered the null hypothesis that must be falsified to show an effect.. In addition the biweekly surveys were used to identify differences in the type of the work. The different types of work were regarded as a unique concept. Therefore the final analysis step provides an explorative assessment of these variables.
4.3.1 Quality of the Survey Data
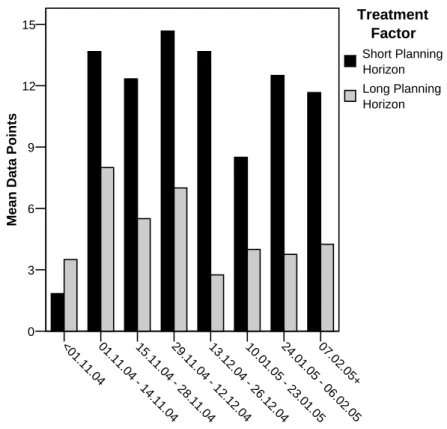
In order to assess overall measurement quality Figure 4.1 depicts the difference in the log book collection mechanism using single log book entries as data points. It presents an overview of the mean data points for each treatment group in a two weeks time frame. The precision is led by the short planning horizon group having about twice the number of data points as the long planning horizon group. This imposes a threat to the internal validity as it is different for the two treatment groups. The overall precision of the data can be expressed using the sum of the points divided by the number of the participating groups for each treatment. It is 88.3 data points per short planning horizon group and 38.8 for the long planning horizon group. Consequently the data collection itself is difficult to use and must be subject to control.
4.3.2 Group Differences
In order to describe the background concerning programming and software engineering experience an initial survey was carried out. Table 4.1 shows the result of a non-parametric U-Test of this survey (cf. Appendix A.6 for details). The test focuses on the equality of the central tendency (or median) of a sample. The Mann-Whitney U-Test is used for independent measurements and the
4 Planning of Embedded Software Projects <0 1.1 1.04 01 .1 1.0 4 - 1 4. 11 .04 15.1 1.0 4 - 28 .1 1.04 29.1 1.04 - 12 .1 2. 04 13.1 2.0 4 - 26 .1 2.04 10 .0 1. 05 - 23 .0 1.0 5 24.0 1.05 - 06. 02 .05 07 .0 2. 05 + Date (categorized) 0 3 6 9 12 15 Mean Dat a Poi n ts Treatment Factor Short Planning Horizon Long Planning Horizon Seite 1
Figure 4.1: Accumulated data points per group and date - one data point is an entry consisting of a specific task, a duration and a type
Wilcoxon W-Test is used if the two measurements are dependent. The values are based on rank sums were each value is transformed to its position in the occurrence of values. The lowest value is transformed to a value of one while the next higher value is transformed to the rank value of two (and so on). By building the sum of values it is possible to identify significant differences for example when one group receives too many low ranked values. The z-value transforms the test statistic to a distribution with a mean of zero and a variance of one. The significance finally indicates the likelihood of the test statistic with values less than 0.05 considered as significant. Two tailed tests aim for equality while one tailed tests aim at directed hypotheses.
The table points to a significant difference (0.04) for the variable ”Number of Years of Programming Activity”. This indicates an unbalanced general programming knowledge between both groups although randomization was used during treatment assignment.
4.3 Analysis Test Statisticsb 30,000 46,500 44,000 38,000 34,000 25,500 24,000 108,000 82,500 122,000 74,000 112,000 61,500 60,000 -1,512 -,120 -,388 -,815 -1,110 -1,822 -2,055 ,131 ,905 ,698 ,415 ,267 ,068 ,040 ,181a ,910a ,792a ,473a ,305a ,082a ,069a Mann-Whitney U Wilcoxon W Z
Asymp. Sig. (2-tailed) Exact Sig. [2*(1-tailed Sig.)] Good Programmer Project Work is new to him/her Knows many Programming Languages Is not good at C++ Is familiar with Extreme Programming / other Agile Methods Doesn't know how a SW Project should be carried out Number of Years of Programming Activity
Not corrected for ties. a.
Grouping Variable: Treatment b.
Seite 1
Table 4.1: U-Test to assess initial differences in performance
4.3.3 Main Hypothesis
The hypothesis of a different overall development time is tested with a U-Test as shown in Table 4.2. The variable Tsum is used as the sum of development
time for each group. The table shows a non-significant (0.286) difference for this variable. Thereforeh0, which is the hypothesis that both groups needed the
same development time, has to be accepted. Accordingly the main hypothesis of this experiment could not be shown.
Test Statisticsb 7,000 5,000 10,000 7,000 1,000 4,000 17,000 26,000 20,000 28,000 11,000 14,000 -1,066 -1,492 -,426 -1,066 -2,352 -1,711 ,286 ,136 ,670 ,286 ,019 ,087 ,352a ,171a ,762a ,352a ,019a ,114a Mann-Whitney U Wilcoxon W Z
Asymp. Sig. (2-tailed) Exact Sig. [2*(1-tailed Sig.)]
Tsum NTFunction NTPlanning
NTArchite
cture NTDefect NTChange
Not corrected for ties. a.
Grouping Variable: TreatmentFactor b.
Table 4.2: U-Test concerning the treatment influence on the different variables Additional work, which was expected to appear in some long planning horizon groups, did not occur. On the other side an advantage of a long planning phase did not have an influence on the overall development time either.
4.3.4 Explorative Analysis
Due to the explorative nature of this study, the area of interest was covered with more variables than actually needed by the main hypothesis. The greater
4 Planning of Embedded Software Projects
detail of the time variable is discussed in the following part.
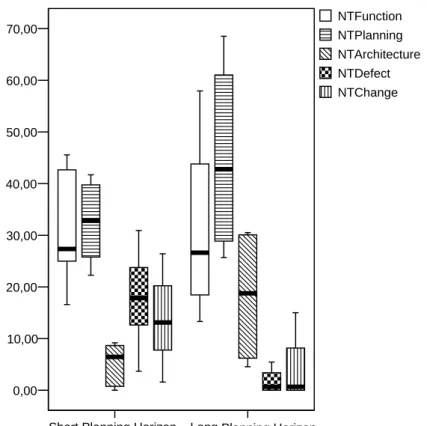
NT Variables 0,00 10,00 20,00 30,00 40,00 50,00 60,00 70,00 NTFunction NTPlanning NTArchitecture NTDefect NTChange
Short Planning Horizon LongPlanning Horizon
Seite 1
Figure 4.2: Overall fraction of different types of work in percent
The main variables of the survey based data collection were post processed in order to focus on the type of work for each treatment. The T in each variable indicates that the type of work was multiplied by the time needed for the specified task. The N refers to the normalization step, which computed the ratio of the given type of work (in percent) for the two weeks time frame. The result is a fraction describing the effort for each group and type of work. The meaning of the variables is:
• NTFunctionrepresents the functional fraction of the work like program-ming algorithms or peripherals. As for the other variables, it represents the percentual part of work within two weeks.
• NTPlanning is the part of planning time used during a two weeks cycle. This includes the time needed to read documents.
4.3 Analysis
• NTArchitecture is related to a programming task which changes the general architecture of the system without changing functionality.
• NTDefectcomprises the process generally considered as defect removal: finding the cause of the failure and fixing the fault.
• NTChange indicates the development part of the work that was used to do non-functional and non-architectural programming. This comprises commenting, renaming, and general organizational changes.
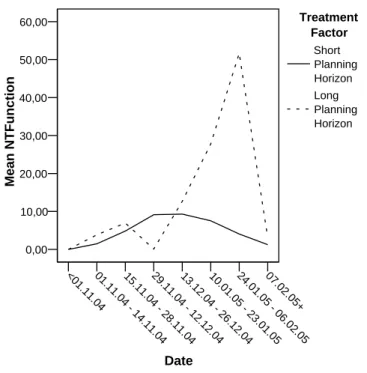
Analysis of NT-Variables <01 .11.04 01. 11. 04 - 14.11.04 15.11.04 - 28 .11 .04 29.11. 04 - 12.12.04 13.12.04 - 26 .12 .04 10. 01. 05 - 23 .01 .05 24. 01. 05 - 06.02.05 07. 02 .05+ Date 0,00 10,00 20,00 30,00 40,00 50,00 60,00 Mean NTFunction Treatment Factor Short Planning Horizon Long Planning Horizon
Figure 4.3: Mean and normalized functional part
In order to evaluate the fraction of each work type concerning the overall development process, Figure 4.2 provides a box plot of the different data points. The influence of the different treatments reveals a higher maximum planning fraction for the long planning horizon group which could have been expected. In addition the architecture is a more important task for the planning group which again is caused by the treatment of the according group. The variance for the short planning horizon group seems to be smaller, although the reason for
4 Planning of Embedded Software Projects
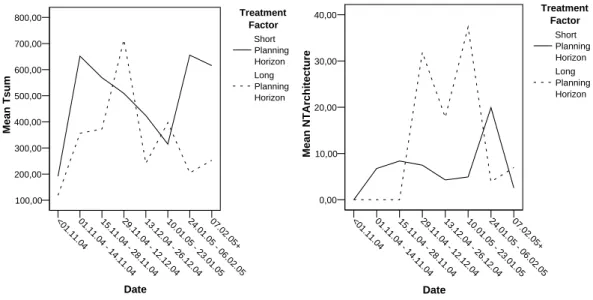
this might be found in the precision of the data points as discussed in Section 4.3.2. <01.11.0401. 11. 04 - 14.11.04 15.11.04 - 28 .11 .04 29.11.04 - 12.12. 04 13.12.04 26 .12 .04 10.01.05 - 23 .01 .0 5 24.01.05 - 06 .02 .05 07. 02. 05 + Date 100,00 200,00 300,00 400,00 500,00 600,00 700,00 800,00 Mean T sum Treatment Factor Short Planning Horizon Long Planning Horizon Seite 1 <01.11. 04 01. 11. 04 - 14.11.04 15.11.04 - 28 .11 .04 29.11.04 - 12.12.04 13.12.04 - 26 .1 2.0 4 10. 01. 05 - 23 .01 .05 24 .01.05 - 06.02.0507.02. 05 + Date 0,00 10,00 20,00 30,00 40,00 Mean NTArchitecture Treatment Factor Short Planning Horizon Long Planning Horizon Seite 1
Figure 4.4: Mean absolute working time in minutes and normalized fraction of architectural work by treatment.
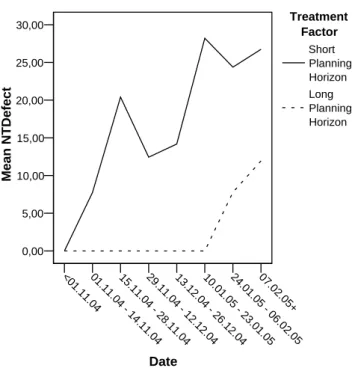
The U-Test on the NT-variables presented in Table 4.2 was chosen because the assumption of normal distribution could not be met for the given variables. The table shows a significant difference for the NTDefect-variable. This variable indicates that the fraction of work used for defect removal was significantly different for each treatment. One interpretation of this difference is a more dependable system which is caused by a superior planning and architecture. The result may have been a reduced number of failures for the system. The other reason consists of the overall system quality. It is likely that some groups did a more challenging yet more powerful system than others leading to a different number of system defects. One last aspect is the lack of precise data as mentioned in Section 4.3.1 which means that the real fraction of defect related development is not shown precisely enough for both treatments.
One solution to the problem of precision is a final system quality test. It was suggested in [64] as a control device to assure equality of programming results. Coming too late for this experiment, the proposal was included only informal, but has been established for a different experiment environment as described in [73].
4.3 Analysis <01. 11. 04 01.11.04 - 14.11.04 15.11. 04 - 28.11. 04 29.11.04 - 12. 12. 04 13.12. 04 - 26.12.04 10.01. 05 - 23.01.05 24.01.05 06. 02. 05 07.02.05+ Date 0,00 5,00 10,00 15,00 20,00 25,00 30,00 Mean NTDefect Treatment Factor Short Planning Horizon Long Planning Horizon Seite 1
Figure 4.5: Mean normalized fractions of defect by treatment
Analysis of the Development Progress
The mechanism of collecting data regularly over a period of time allows to investigate general development progresses and differences caused by the two treatments. One effect which is assumed to be a problem of long planning horizon approaches is shown in Figure 4.3. A peak of the functional part of the work becomes evident at the end of the course. This indicates an effect, where just before the absolute deadline, a major part of the needed functional work is done using a waterfall method.
An interesting aspect, especially regarding the main hypothesis, is the overall work that was done by both groups. The difference between the two treatments is shown on the left in Figure 4.4. It shows that the mean work time in minutes for the short planning horizon group was much higher in the end than for the long planning horizon group which is a surprising result. The reason for this unexpected observation is that the focus on functional work is considered to reduce unexpected work during the end phase of a project.
In order to obtain a better assessment considering the higher amount of work, the according fraction of work types is shown on the right in Figure 4.4. The fraction of the architectural work as shown in this Figure points out greater effort for the short time planning group. Here the mean value of 20% indicates
4 Planning of Embedded Software Projects <01.11. 04 01.11.04 14.11.04 15.11. 04 - 28. 11.04 29.11.04 - 12. 12. 04 13.12. 04 - 26. 12 .04 10. 01. 05 - 23.01.05 24 .01.05 - 06. 02. 05 07.02.05+ Date 0,00 10,00 20,00 30,00 40,00 Mean NTChange Treatment Factor Short Planning Horizon Long Planning Horizon Seite 1
Figure 4.6: Mean normalized fractions of change by treatment
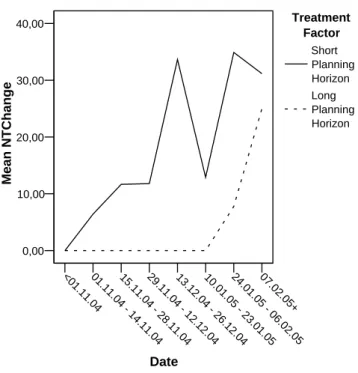
major changes right before the end of the course. The assumption of additional work is supported by Figures 4.5 and 4.6. The amount of non-architectural change programming and defect caused programming appears to be much higher in the short time planning group. Although these effects are an often reported and well known effect (”embrace change”), this might be a reason for the additional work for the short time planning group before the deadline of the lab course.
4.4 Experiment Results
The hypothesis of both groups having a different development effort could not be shown. Thus, neither a short planning horizon nor a long planning horizon changes the time needed to develop a system significantly. Concerning the explorative analysis for this experiment, differences in the types of programming work were found. Differences in functional or defect related development appeared. Although not part of the hypothesis, it is very likely that these differences are imposed by the different methods and that an according effect could be shown.
4.4 Experiment Results
control. Especially the underlying assumption, that short and long planning composed the only factor of influence for the development time is regarded false in retrospect. Experiment control was low as gathering UML and Gantt diagrams is not really countable. Differences in quality as well as detail level could not be controlled. Especially the lack of control of the final version is critical. As only the functioning sensor was sufficient for a running system, neither reliability nor other non functional aspects of the source code were tested. This is regarded highly problematic as differences especially in these areas were enormous and thus the source code of the different groups was not really comparable.
Nevertheless the kind of data collected in this experiment is regarded in-teresting. As types of programming tasks were gathered, their frequency of occurrence and average length can be considered potentially different for both kinds of software projects. The final question of the impact of different types of work regarding project success could not be answered.
5 Refactoring
5.1 The Technique of Refactoring
Refactoring first mentioned by Opdyke [65] is an important technique on its own, although it is considered part of the Extreme Programming methodology. It can be described as continuous review of the source code with a restructuring of source code according to implicit design rules. The steps to change source code are described in Fowler [28]. Another important aspect is when to apply a refactoring. It is described to be best executed when a developer identifies a source code fragment which does not follow the implicit design rules. The discrepancy in design is subjective in nature and described as ”smell” by [28]. After identification of the problem the catalog of changes is used to correct the source code design. The steps to achieve this comprise for example renaming of variables, extraction of new methods or even extraction of complete classes.
According to Mens and Tourw´e [60], refactoring is assumed to affect posi-tively non-functional aspects, presumably extensibility, modularity, reusability, complexity, maintainability, and efficiency. Negative effects consist of additional memory consumption, higher power consumption, longer execution time, and lower suitability for safety critical applications.
Research on refactoring mostly includes technical aspects like computer aided application of refactoring. One area of research is refactoring on non object oriented programming languages ([37, 54]). Another common area of interest is the computer aided support of design flaw identification ([58, 70, 77, 84]). The area consists of the actual application of a refactoring step as this is syntactical non trivial ([30, 59]). Empirical work on this topic is rather uncommon. One example for an empirical evaluation is the influence of refactoring on changeability as evaluated in [33] reporting a lower change effort. Other empirical results provide a taxonomy for bad smells as presented in [58].
The results reported by experience reports provide a mixed picture of refac-toring. Non-satisfactory results are reported by [67]. The reason for this was given as bad tool support and in addition to this the size of a legacy system being refactored. Code evolution analysis [48] investigates code clones (copied code fragments) as one of the main artifacts minimized by refactoring. For
5 Refactoring
some code clones no refactoring was available and additionally it was reported that not all code clones should be refactored. One successful application of refactoring is reported in [32]. Here programming performance was increased. A secondary nevertheless interesting aspect mentioned was the compliance to the design principle of information hiding after having finished the refactoring.
5.2 Design of the Experiment
For the refactoring experiment, twelve students had to develop a program based on the same requirements specification. Six students were asked to apply refactoring to their software. The other six students continuously had to document their source code. The later step is regarded a placebo effect treatment to omit the effect that students behave in an experiment conform way (Hawthorne effect [69]). Additionally the disturbance for a person that was created by refactoring was also applied to the control group by using this treatment. Group assignment was done randomly.
Two hypothesis based on non functional aspects were tested. Maintainability was thought to be higher in refactored source code. This was tested by randomly inserting errors in the source code and measuring the time a participant needed to fix the error (thus classified as corrective maintainability [5]). The second hypothesis was that modifiability was higher in the refactored code due to its better internal structure. This was tested by adding requirements to the software and measuring the times and lines of code (LOC) needed to meet these requirements. For both hypotheses the differences in metrics were not used within an inference statistical test. Although this is proposed in [46], the distribution and scale types are regarded as problematic for testing purposes.
5.2.1 Variables and Measurement
The main independent controlled variable was the assignment of a participant to the refactoring or documentation group. The execution of refactoring as well as documentation was done with a tool named disturber (cf. Chapter 17). Using this tool every participant was interrupted every twenty minutes and reminded to execute the treatment task. In case of refactoring a list of design flaws (smells) had to be checked. For the documentation treatment it was needed to document the new software parts.
The dependent variables were lines of code, development time for a new requirement (modifiability) as well as the time to identify and correct errors in the source code (maintainability). The two relevant variables for modifiability
5.2 Design of the Experiment
could be measured using the code evolution framework as described in Chapter 15. It gathered login and logout information of participants as well as source code changes written during the time of implementation. For the randomly induced errors of the maintainability test, a simple tool was written which randomly removed lines of code. This removal of source code lines resulted in syntactical or semantical errors. 15 syntactical and 10 semantical errors were created in each version. The time needed to fix them was measured using a stopwatch and the measurement was supervised by a member of the chair.
5.2.2 Hypotheses
As maintainability was assumed to be better in the refactoring group, the time
tmain needed to find and correct errors induced into the source code was thought
to be lower in the grouptmainRef compared to the documentation grouptmainDoc.
As the opposite had to be rejected, the hypothesis H0 was formalized as
H0 :tmainRef ≥tmainDoc.
The resulting alternative hypothesis was
H1 :tmainRef < tmainDoc.
A similar hypothesis was used for modifiability. Only the meaning of t changed, as tmod described the mean time to develop additional requirements for the
refactoring group. Consequently, theH0 hypothesis for modifiability was
H0 :tmodRef ≥tmodDoc.
and H1 was given as
H1 :tmodRef < tmodDoc.
5.2.3 Procedure
In this experiment, video tutorials were used to explain details about the envi-ronment and the microcontroller to the participants. Two different videos were shown for the treatment consisting of a video about refactoring and documen-tation. The advantage of using this way of training was that each participant received the same amount of attention and no person or method was favored. After this initial tutorial step, a general survey was executed in order to assess person ability. Questions in this survey were based on experience, language and microcontroller knowledge. To avoid any motivation effect, refactoring was
5 Refactoring
named reorganization during the active experimentation procedure. Based on a requirement list, programming was done. Each participant had to work in a separate room. This lead to a non continuous development with students working during different times a week.
The main task consisted of a reaction and a memory game to be programmed. The reason for selecting this task was the low domain knowledge required to start development. Different types of hardware needed to be programmed as buttons, LCD, LEDs and hardware interrupts were part of the requirements specification. An acceptance test was executed checking the functionality and requirements as programmed by the participants. In this early experiment the test was manual in contrast to the later available automatic tests used in other experiments as described in Chapter 16.
The refactoring treatment was based on a subset of steps applicable to the programming language C. This was needed as C is regarded a more common and realistic language for embedded systems1 and C itself has no direct support for object oriented features needed to apply all steps. Thus only non object oriented refactoring steps could be chosen for the treatment. As a special refactoring C macro refactoring was added as discussed in [29] and [30].
The application of refactoring (and the documentation treatment) was con-trolled by the disturber tool (cf. Chapter 17) which lead to a constant treatment execution every twenty minutes. The controlled interruption was done to remind, assure and consequently control treatment execution. Although the periodic application of refactoring is not natural as refactoring is executed based on a developer’s decision, the rigid control was needed because participants were supposed to be new to the technique. As the main reason to start a refactoring is based on a programmer’s subjective view, this had to be controlled via checklists based on smells described in [28].
The chair’s standard development environment consisting of an ATMEL ATmega16 microcontroller was used for this experiment. The development environment was WINAVR 2 together with ATMEL AVR Studio 3. As it was not part of the main experiment, a header and a C file was provided for the LCD programming.
5.2.4 Participants
Participants of this experiment were twelve computer science students from the RWTH Aachen University. All of them were in the main study period and their participation in the experiment was paid on basis of a regular student contract.
5.2 Design of the Experiment
The experiment lasted 40 hours and the overall execution of the experiment took three months. The reason for this time span was the number of rooms which had to be used exclusively leading to organizational issues. The project related data were saved on individual network drives and inaccessible for other participants. Based on the type of room interruption from other members of the chair occurred but the frequency was acceptable. Questions and feedback to the participants were handled via e-mail and a specific instant messaging server. Messages and experiment data were archived which had to be accepted and signed by the participants.
5.2.5 Threats to Validity
Although the more detailed validity examination proposed by Wohlin et al. [91] was used in the published experiment description [88], the following text contains the standard validity description of internal and external validity.
The most important threat to internal validity consists of the checklist which is used for refactoring. As it is artificial and not based on the developer’s subjective view, the realistic execution of this technique is threatened. The same is true for the periodical application every twenty minutes, which does not resemble a ”natural” application. On the other hand a detailed theory regarding the effects of refactoring does not exist. The main idea of ”once and only once” suggested by the inherent term ”factor” as explained by Fowler [28] is the most precise effect description that can be given. Thus it is not known how unrealistic a checklist is compared to intuition. The usage of maintainability and modifiability contains additional threats to internal validity. First both non functional aspects are described as one of a multitude of affected factors. The modifiability test of adding requirements may be in support of the refactoring technique thus creating a rather artificial setting. One last problem are the few participants consisting of six students per group. This low number would have required an exceptional factor strength of the refactoring treatment. This aspect is discussed in Section 18.4 in detail and tested in the analysis Section 5.3 of this experiment.
The external validity is lowered by the use of the C language as a major part of refactoring steps cannot be applied without object orientation. Here a trade off situation occurred, as the realism of using C for embedded systems is regarded higher. Additionally the principle of ”good” micro design is considered as a language independent aspect. The test of adding requirements is regarded realistic, as requirements elicitation and requirements stability are problematic on their own.
5 Refactoring
5.3 Analysis
5.3.1 Main Hypothesis
Maintainability
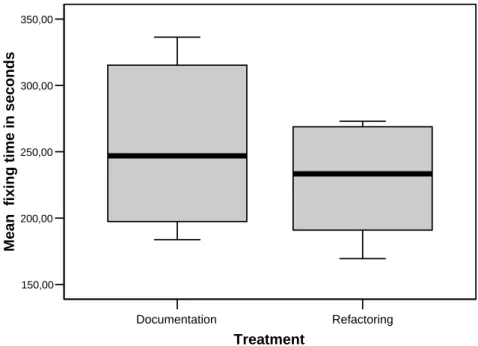
The maintainability test consisted of 15 syntactical and 10 semantical errors that were induced into the source code of each participant. The time to locate the error in the source code and to correct it was measured in seconds. Figure 5.1 depicts the mean correction time for each participant of each group as a box plot. Although the refactoring treatment had a slight advantage concerning reaction, results were not significant when tested with a bootstrap inference test for a level of significance of α= 0.05. Thus better maintainability is not regarded as different between the refactoring and the documentation treatment.
Documentation Refactoring Treatment 150,00 200,00 250,00 300,00 350,00 Mean f ixi ng t im e i n sec onds
Figure 5.1: Box plot of mean fixing time of each participant divided by treatment group, 6 data points per group
Modifiability
The effect of new requirements to a project was measured using the lines of code metrics (including comment lines). Three kinds of lines of code were
5.3 Analysis
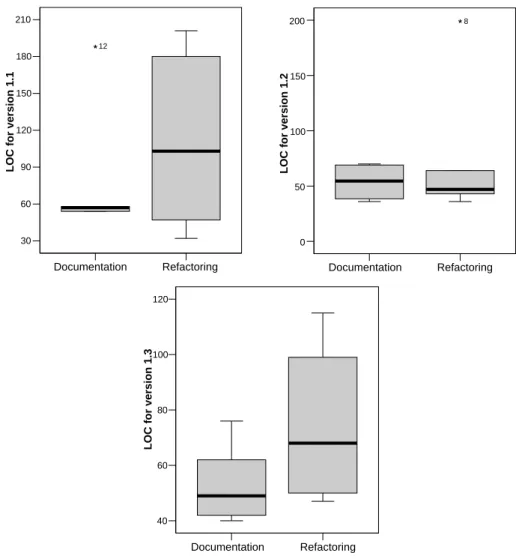
combined: added lines, changed lines and deleted lines. Additionally the time being measured needed to fulfill each new set of requirements. Due to differences in participant’s performance, ten completed version were available for the first requirement addition (version 1.1), while nine participants completed version 1.2 and 1.3. Documentation Refactoring 30 60 90 120 150 180 210 LOC for ve rsion 1 .1 12 Seite 1 Documentation Refactoring 0 50 100 150 200 LOC for ve rsion 1 .2 8 Seite 1 Documentation Refactoring 40 60 80 100 120 LOC for version 1.3
Figure 5.2: Box plots for changed LOC per version categorized by 6 data points per treatment
The change of lines of code for the different versions is shown in Figure 5.2. Obviously the initial hypothesis for modifiability contradicted the observed results as for two new versions, more lines of code were created for the refactoring
5 Refactoring
group. The median of changes of the refactoring group surpassed the median of changed lines for the control group nearly every time.
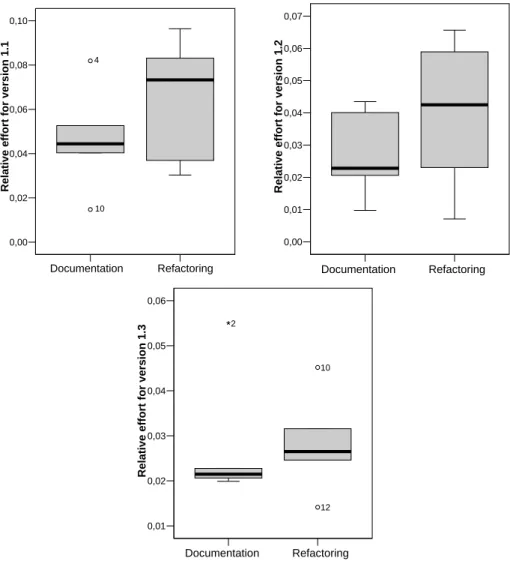
Documentation Refactoring 0,00 0,02 0,04 0,06 0,08 0,10 Relat ive e ffort for versi on 1. 1 10 4 Seite 1 Documentation Refactoring 0,00 0,01 0,02 0,03 0,04 0,05 0,06 0,07
Relative effort for version 1.2
Seite 1 Documentation Refactoring 0,01 0,02 0,03 0,04 0,05 0,06
Relative effort for version 1.3
12 10 2
Figure 5.3: Box plots for fraction of development time compared to first version per modification categorized by 6 data points per treatment
The results found above are supported by the time measurements as shown in Figure 5.3. Although both measurements naturally correlate (more lines of code take longer to be programmed), additional effort seemed to be required when applying the refactoring technique. Regarding the difference of time, all three additional versions needed more time to be finished by the refactoring group.
5.3 Analysis
Summing up, refactoring does not appear to support maintainability or modifiability. Apart from an influence on non functional aspects, side effects regarding development effort seem to occur when refactoring is applied. For a more detailed interpretation, see Section 5.4.
5.3.2 Analysis of Additional Variables
As additional variables were collected, an analysis of the results was done more deeply. As hypotheses were not formulated in the beginning, these results had to be considered indicators of possible effects.
The first observation was that the overall size of the resulting source code was not influenced by treatment. The size of the projects varied from 745 lines to 2214 lines of code.
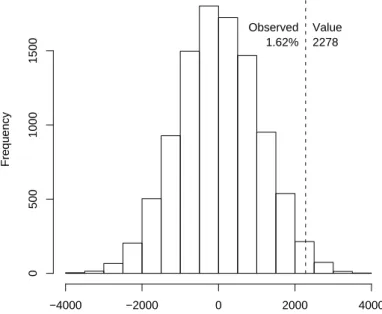
Simulation of mean Flash−RAM for version 1.0
Flash memory of documentation group − refactoring group
Frequency −4000 −2000 0 2000 4000 0 500 1000 1500 Observed 1.62% Value 2278
Figure 5.4: Bootstrap simulation of mean memory difference
One interesting difference was observed in the memory consumption between both treatment groups. This value was reported after every compilation and thus could be extracted from the finished versions of each participant. One