COMPARATIVE ANALYSIS OF THE DENSITY OF NATURAL
REGENERATION FOLLOWING THE WOODLAND STAGE
OF SEEDLINGS OF HUNGARIAN (
QUERCUS FRAINETTO
) AND TURKEY
OAK (
QUERCUS CERRIS
)
BERCEA IULIAN
Faculty of Agronomy, University of Craiova,[email protected]
Key words:Hungarian oak, Turkey oak, density,competition
ABSTRACT
The density of the naturally regenerated seedlings of Hungarian and Turkey oak diminishes gradually following the woodland stage, simultaneously with their increase in height. The right proportioning of the mixed stands of Hungarian and Turkey oak is achieved during the regeneration process through the guided removal of fully grown trees and planting of seedlings. It is also achieved through the forestry works in their early stages of life. The promotion of the Hungarian oak in these mixed stands, in which it is negatively affected in the process of regenertaion due to climatic changes, is a constant concern of forestry, and the study of the process of natural removal in these mixed stands of Hungarian and Turkey oak trees lays the scientific foundations of the method and time of intervention. The research carried out indicates that the Hungarian oak trees are able to prevail and filter out the Turkey oak trees in the same conditions and positions. The proportioning of the mixed stands may be guided through forestry works meant to provide equal opportunities for the Hungarian and Turkey oak trees in their ealy stages of life, i.e. the thicket, saplings and poles stages. Awareness of the changes occurring in each tree can lead to adequate guidance of the works in space and time so as to enhance the Hungarian oak growth in the competition with the Turkey oak.
INTRODUCTION
The long periods of high temperatures in the dry season and the frequent high temperatures throughout the year and the last decades, followed by dropping temperatures and heavy rainfall, characterize the climatic changes in the western part of the Getic Plateau. The Hungarian and Turkey oak trees rooted in the heavy compact soils and with a very high content of clay, where they created mixed stands. The climatic changes strongly affected the Hungarian oak, leading to its massive wilting between 1989-2004 and to their physiological decline as shown in the lack of fructification and, consequently, their reduced capacity for natural regeneration of the species (Bercea, 2008, 2013, 2014). Meanwhile, the Turkey oak trees withstood the climatic changes and continued to bear fruit at the usual rate (2-5 years). The higher economic value of the Hungarian oak in comparison with the Turkey oak requires forestry measures in the mixed stands of Hungarian and Turkey oak trees, through which the number of Hungarian oak trees could be maintained at the level registered before the climatic changes occurred. Our research aims to highlight the rate and intensity of the natural removal of the seedlings in mixed stands of Hungarian and Turkey oak so as to lay the scientific foundations of the forestry interventions favouring the Hungarian oak.
MATERIALS AND RESEARCH METHODS
the R&D Unit II Argetoaia (U.P.), Filiaşi Woodland, the Hungarian and Turkey oak trees are mixed in equal proportion stands. The location of the sample areas was decided upon after a long period of observation of the wilting of the Hungarian and Turkey oak trees since 1989, and permanent monitoring of the wilting phenomenon has been carried out in these sample areas. The wiltering rate of the Hungarian oak trees is 15% higher than in the case of the Turkey oak trees (Simionescu, 2003). The gaps due to the the removal of the wilted or wilting trees were filled with already existing seedlings of the 1994 low fructification of Hungarian and Turkey oak trees, contributing to the establishment of young stands following the regeneration cuts of the last two decades. Research on the natural regeneration of the seedlings was carried out in the permanent sample areas, and the outcomes were published in journals or presented at conferences (Bercea, 2005, 2007, 2008, 2013, 2014); furthermore, research focused on the natural removal of the Hungarian and Turkey oak trees during the first years of the woodland stage.
Measurements and observations were carried out in the former open group cuts during the regeneration process by applying progressive cutting to two 2-metre wide samples, one to the north-south and the other to the east-west. The results of the measurements and observations were recorded in tables for each species and for the whole stand. Tables were processed using Excel, and plotted using the same software.
The density of the seedlings, expressed as the number of seedlings/ m2, is influenced by the area in which they were planted (Bercea, 2007).
The lowest density of seedlings was recorded in the centre (C), followed by a steady increase in the number of seedlings in the middle (m) and peripheral area (P). Starting from the peripheral area to the outer area (o) under the woodland, the density of the seedlings increases sharply due to the larger number of fully grown trees able to bear fruit and due to the microclimatic conditions allowing for the planting and growing of seedlings in this area (Figure 1)
Desimea puietilor in functie de pozitia in interiorul si la marginea ochiurilor p<0.000
Pozitia puietilor in ochiuri: C- centru, m- mijloc, M-margine, e-exterior
De
s
im
e
a
p
u
ie
ti
lo
r
(n
r/
m
p
)
1 1.2 1.4 1.6 1.8 2 2.2 2.4 2.6
out to thedifferent pace of natural removal caused by the growth and development f the two species in the ealy stages of life.
FINDINGS AND INTERPRETATIONS
The density of seedlings was measured in the permanent sample areas during their natural regeneration and in the first years of the woodland stage. The measurement results were centralized in a table and presented graphically using Excel.
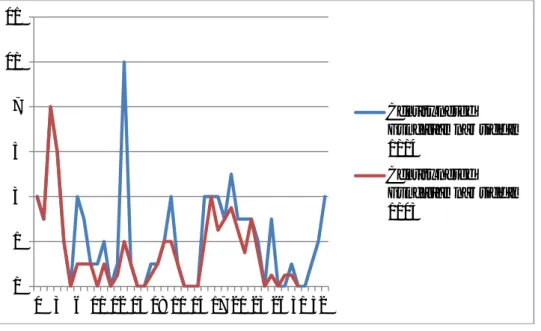
Figure 2. Density of Hungarian oak trees to the north-south
Figure 2 indicates the following:
- in the northern part of the former regeneration group cuts, the density of Hungarian oak specimens decreased due to the increase of seedlings (in height);
- in the middle area, the number is smaller due to natural removal following the significant increase of seedlings (in height);
- in the middle area of the former regeneration group cut, the density of Hungarian oak trees decreased dramatically due to the increase of seedlings (in height);
- in the southern part of the former regeneration group cut, natural removal is moderate due to the less significant increase of the seedlings (in height);
- the density of Hungarian oak trees to the north-south is determined by the rate of the increase of the seedlings (in height);
0 2 4 6 8 10 12
1 4 7 10 13 16 19 22 25 28 31 34 37 40 43
Density of the Hungarian oak tree in 2005
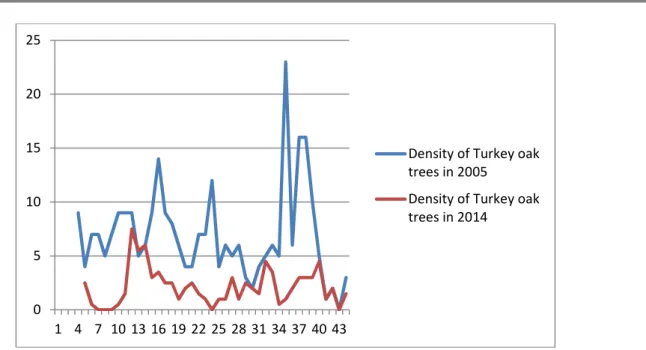
Figure 3. Density of Turkey oak trees to the north-south
By analyzing diagram 3, we notice the following:
- in the northern part of the former regeneration group cuts, the number of Turkey oak specimens, from north to south, decreased dramatically due to the increase of seedlings (in height);
- in the middle area, the number is much smaller in comparison with their density before the woodland stage;
- in the southern part of the former regeneration group cut, the density is much lower in comparison with their density before the woodland stage.
0 5 10 15 20 25
1 4 7 10 13 16 19 22 25 28 31 34 37 40 43
Density of Turkey oak trees in 2005
Density of Turkey oak trees in 2014
5 10 15 20 25
Density of
Hungarian+Turkey oak trees in 2005
Density of
- the density of seedlings is lower due to the significant increase in height and the intraspecific and interspecific competition;
- the natural removal to the north-south follows the vertical differentiation through the significant increase in height in the central area of former regeneration group cut.
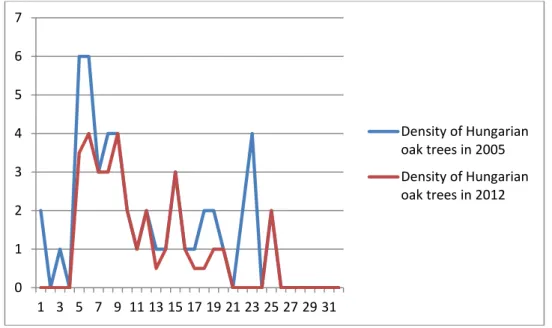
Figure 5. Density of Hungarian oak trees to the east-west
Diagram 5 shows that:
- the density of Hungarian oak specimens decreased significantly in the eastern part of the former regeneration group cuts in comparison with their density before the woodland stage;
- the density of Hungarian oak specimens remained relatively stable in the central part of the former regeneration group cuts in comparison with their density before the woodland stage;
- the density of Hungarian oak specimens decreased significantly in the western part of the former regeneration group cuts in comparison with their density before the woodland stage;
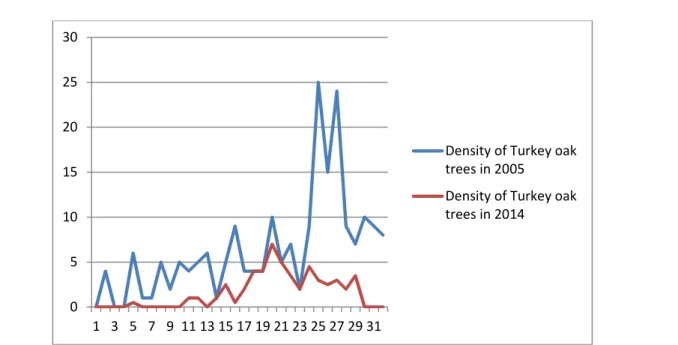
The analysis of diagram 6 reveals the following:
- the density of Turkey oak specimens decreased significantly to the east-west due to natural removal;
- the density of Turkey oak specimens reaches the maximum value in the western part of the former regeneration group cuts due to their increase in height and the high density before the woodland stage;
- to the east-west, the natural removal strongly affected the Turkey oak specimens due to the significant increase in height of the Hungarian and Turkey oak trees and to the high density of Turkey oak trees during the natural regeneration stage;
- the Turkey oak specimens were removed in the competition with the Hungarian oak trees in the same conditions and positions.
0 1 2 3 4 5 6 7
1 3 5 7 9 11 13 15 17 19 21 23 25 27 29 31
Figure 6. Density of Turkey oak trees to the east-west
Figure 7. Density of Hungarian and Turkey oak trees to the east-west
Diagram 7 shows that:
- the density of Hungarian and Turkey oak specimens decreased uniformously to the east-west in the eastern and central part of the former regeneration areas in
0 5 10 15 20 25 30
1 3 5 7 9 11 13 15 17 19 21 23 25 27 29 31
Density of Turkey oak trees in 2005
Density of Turkey oak trees in 2014
0 5 10 15 20 25 30
1 3 5 7 9 11 13 15 17 19 21 23 25 27 29 31
Density of
Hungarian+Turkey oak trees in 2005
Density of
- the density of the Hungarian and Turkey oak seedlings resulting from progressive cuttings remains high in the outer areas of the former regeneration group cuts and preserves a sinuous transversal profile, with lower heights in the peripheral and outer areas;
- during the natural removal process, the Hungarian oak specimens are favoured in comparison with the Turkey oak trees in the same conditions and positions in the stand;
- at the thicket stage, the Hungarian oak specimens branch out and create a protection system, succeeding in overshadowing the Turkey oak trees that are not likely to branch out, instead, we recorded the Turkey oak trees increase in height without any horizontal growth, which caused their removal by the Hungarian oak trees.
BIBLIOGRAPHY
1. Bercea, I., 2007. Cercetări privind regenerarea arboretelor de gârniţă şi cer din partea vestică a Podişului Getic (Research on the Regeneration of the Hungarian and Turkey Oak Seedlings in the Western Part of the Getic Plateau). Doctoral Thesis. “Transilvania” University of Braşov;
2. Bercea, I.,Cojoacă, F.D., 2013: Structural changes of mixed seedlings of Hungarian oak (Quercus frainetto) and Turkey oak ( Quercus cerris) trees following the woodland stage -Annals of the University of Craiova - Agriculture, Montanology, Cadastre Series, Vol. XLIII 2013, pag. 47 -53;
3. Niculescu, Mariana, Iulian Bercea, Gerald Matei, Silvestru Ilie Nuta, Ion Iovu, Stefan Aurelian Ciupitu, Calin Salceanu, 2009: Researches about Quercus cerris forests situated in the North-East of Dolj County, Analele Universitatii din Craiova, Agricultura, Montanologie/ Annals of the University of Craiova, Agriculture,
Montanology, Cadastre series,
http://old.agro-craiova.ro/index.php/aamc/article/view/322/300 , vol. XXXIX/B
4. Niculescu Mariana, Nicolin Alma Lioara, Bercea Iulian, Stănescu Ştefan, Niculescu Laurenţiu, Nuţă Ilie Silvestru,The corology, ecology and phytosociology of the woody plant communities of the Lapuşnic Valley, part of the
National Park Nerei-Beuşniţa
Gorgeshttp://agronomie.administrativ.ucv.ro/aamc/index.php/aamc, 2013
5. Florescu, I.I., 2004.Silvicultură(Forestry).Arad: "Vasile Goldiş" University Press. 6. Simionescu, A. et al.,2003: Starea de sănătate a pădurilor din România în