Longitudinal and Life Course Studies 2012 Volume 3 Issue 3 Pp 346 – 358 ISSN 1757-9597
RESEARCH NOTE
Life course influences on quality of life at age 50 years:
evidence from the National Child Development Study
(1958 British birth cohort study)
D Blane,
1,2M Wahrendorf,
3,2E Webb,
1,2G Netuveli
1,21. Imperial College London
2. ESRC International Centre for Life Course Studies in Society and Health
3. University of Duesseldorf
d.blane@imperial.ac.uk
Abstract
The objectives of this study were to investigate whether prospective data reveal life course influences on quality of life at older ages; to establish a baseline for the evolution of quality of life through the Third Age; and to estimate the relative importance of direct and indirect effects in these life course relationships. We used the age 50 years sweep of the National Child Development Study (1958 British birth cohort study) included the CASP measure of positive quality of life at older ages, allowing prospective path analysis of life course influences on quality of life at the start of the Third Age. We found that material (social class; deprivation) and psycho-social (family conflict; family fracture) circumstances in childhood and adulthood were linked using path analysis to CASP scores at age 50 years. The strength of these relationships was modest; and their influence was primarily indirect via well-recognised contemporaneous factors. Prospective data revealed life course influences on quality of life at the start of the Third Age. We conclude that the influence of these longitudinal factors is weak in comparison with that of contemporaneous circumstances. In this respect quality of life differs from health.
Keywords
: National Child Development Study; life course; CASP measure of positive quality of life at older ages; Third AgeIntroduction
The presently reported study, which analyses prospective life course data up to age 50 years, is situated at the transition between mid-life and early old age; in Laslett’s terms, the Second and Third Ages (Laslett, 1996). As well as being of substantive interest in its own right, the study is a baseline for future studies of the evolution of quality of life through the Third Age, including whether the balance between contemporaneous and life course influences shifts with age towards the former. Three issues are of particular interest: whether prospective data confirm previous findings
based on retrospective data; whether prospective data reveal life course influences on quality of life which are akin to those on health, where there are important long-lasting direct effects; or whether life course influences on quality of life are primarily indirect via recognised contemporaneous factors.
D Blane, M Wahrendorf, E Webb, G Netuveli Life course influences on quality of life at age 50 years
life with high responsibilities, mid-life includes the experience of success or failure in achieving important goals and satisfying important non-material needs (Willis, Martin, & Rocke, 2010). Among the latter, continued experience of control and autonomy and regular experience of personal achievement are core elements of quality of life (Higgs et al.,2003), which also influence later health (Jopp & Schmitt, 2010).
Recent increases in life expectancy at middle age and the spread of second pensions, both private and occupational, which in some countries supplement the State Pension, have combined to create a new phase of the life course which Laslett has christened the Third Age (Laslett, 1996). This Third Age lies between the end of family formation and paid employment, on the one hand, and the onset of physical dependency on the other. Freed of responsibility for children and to employer and in reasonable health and financial circumstances, a person, perhaps for the first time in their life, can concentrate on self and self-realisation. Although the concept of the Third Age has its critics, such as Bury (1995) who wondered whether it is a middle class phenomenon, and Gilleard & Higgs (2000), who stress the diversity of responses to this stage of life, it undoubtedly points to the potentially positive opportunities opening up to a growing proportion of people in early old age. The Third Age does not have specified age limits, but most descriptions would include the ages 55-75 years.
Previous research has identified the main predictors of positive quality of life in early old age as contemporaneous good physical functioning, financial adequacy, an absence of clinical depression, good quality personal relationships & frequent social contact, participation in social and voluntary activities and, negatively, being unable to move residence from a disliked neighbourhood (Bowling, Farquhar, & Browne, 1991; Farquhar, 1995; Bowling, 1995; Bowling, 1996; Wiggins et al., 2004: Netuveli et al.,2006; Wahrendorf et al., 2006; Knesebeck, Ovd et al., 2007; Siegrist & Wahrendorf, 2009; Wahrendorf & Siegrist, 2010; Webb et al.,
2011). The current evidence suggests that these same factors account for short term change in quality of life (Webb et al., 2011), but that any long-term life course effects are either non-existent or weak (Blane et al., 2004). In this respect, quality of life at older ages seems to differ from physical
and powerful (Davey Smith et al., 1997; Montgomery et al., 2000; Langenberg et al., 2003; Kuh et al.,2006; Langenberg et al., 2006;).
In contrast to the evidence relating to life course influences on physical health at older ages, which have come from prospective data, previous investigations of potential life course effects on quality of life at older ages have had to depend on retrospective data (Blane et al., 2004; Siegrist & Wahrendorf, 2009). The present research note corrects this deficiency by using prospectively collected life course data to investigate whether circumstances during childhood and adulthood influence quality of life at the start of the Third Age. We hypothesise that such effects will appear prospectively, with some direct effects in addition to indirect effects via the recognised contemporaneous factors mentioned above.
Methods
Data
The National Child Development Study (NCDS), also known as the 1958 British birth cohort study, sampled all those born in England, Wales and Scotland during one week in 1958. Study participants have been re-visited periodically to produce a prospective longitudinal data set, which is deposited on open academic access at the UK Data Archive. The presently reported NCDS analyses use information collected at birth and from follow-up sweeps at ages 7, 11, 16, 23, 33 and 50 years.
Missing data, due to sample attrition, item non-response and so forth, are a significant problem in birth cohort studies such as NCDS, whose original sample of some 18,000 births reduced to, at best, around 7,000 with complete data in the present analyses at age 50 years. We have addressed this problem by means of multiple imputation. Imputation was conducted on all NCDS members interviewed in 2008 (N=9790), thereby excluding all who had left the study due to death and other reasons. Results from both data sets, complete and imputed, are shown.
Operationalisation
D Blane, M Wahrendorf, E Webb, G Netuveli Life course influences on quality of life at age 50 years
thereby, to identify any unexplained influences which appear as direct effects. Life course material disadvantage was operationalised in terms of social class and deprivation, which are seen as potential influences on financial adequacy and physical functioning in early old age. The parallel psycho-social disadvantages are family conflict and family fracture (divorce or separation of parents, or death of one or both parents), impacting later clinical depression and social participation (the term clinical depression is used to distinguish it from transient feelings of unhappiness, not to imply validation by clinical interview).
Measures during childhood and adulthood
(a) Social class was measured using the Registrar General’s classification of occupations, aggregated into social classes V-IIIM (manual) and IIIN-I (non-manual), based on father’s occupation in 1958, when the NCDS participant was born, and the NCDS participant’s own occupation at age 33 years. (b) Accumulated deprivation during childhood was measured using the sum of four binary items, giving a scale 0-4. The items were: father being in social class V or IV when the NCDS participant was born; family having reported financial difficulties when the NCDS participant was aged 7 years; NCDS participant having received free school meals at age 11 years; family having reported financial difficulties when the NCDS participant was aged 16 years. Accumulated deprivation during adulthood was measured using the sum of three binary items at ages 23 and 33 years, giving a scale 0-6: occupying crowded residential accommodation; receiving welfare benefits; living in rented accommodation. (c) Family conflict was measured by whether or not the school health visitor reported parental discord when the NCDS participant was aged 7 years. The NCDS data set does not contain a comparable measure at 23 or 33 years, so family fracture at age 33 years was used instead. (d) Family fracture during childhood and at age 33 years were measured as divorce, separation or death of parent(s) before the NCDS participant was aged 7 years; and divorce, separation or death of spouse by age 33 years.
Measures at age 50 years
Financial situation was measured using a five category variable from the question whether the household of the NCDS participant experienced
financial difficulties (1 = none; 5 = great difficulties). We considered limiting illness was indicated by the SF36 physical functioning score (100 re-scaled 0-10). Clinical depression was measured by the nine-item version of the Malaise Inventory (Rutter, Tizzard, & Whitmore, 1970) on a continuous scale 0-9, where a score of four or more is considered indicative of depression. Social participation was measured as a score based on the past, current and active membership of civil society organisations, such as parents’ associations, religious groups, political parties and social and voluntary organisations. We used these variables either as continuous or as multiple categories to use the maximum information captured within them.
Quality of life was measured in its positive,
Third Age, sense (Higgs et al., 2003; Hyde et al.,
2003) by CASP-12 version 2 (Wiggins et al., 2008), which consists of 12 Likert-scaled items, each scored 0-3, that access the dimensions of control, autonomy, self-realisation and pleasure. Although CASP was developed to study the third age, by focusing on the psychosocial needs of this age group, we assume that its domains are relevant also to the mid-life period where, as mentioned previously, the experience of control and autonomy and regular experiences of personal achievement are important for quality of life (Willis, Martin, & Rocke, 2010) and later health (Jopp & Schmitt, 2010). CASP-12v.2 has a range of 0-36. For comparing size effects, the difference in mean CASP-12v.2 scores between those with no current long-standing illness and those with a current limiting long-standing illness, in this NCDS sample, is 4.9 units on the CASP-12v.2 scale.
Analysis
Data were analysed in STATA version 11 for descriptive analyses and Mplus version 4 for path analyses, with SEM models of direct and indirect effects, using WLSMV, as binary variables in the paths (Muthen, 2011). The multiple imputation created five sets of data with missing values imputed, giving 97% efficiency based on a
D Blane, M Wahrendorf, E Webb, G Netuveli Life course influences on quality of life at age 50 years
at age 50 years, on the other, into direct effects and indirect effects acting via those factors at age 50 years which are known to influence quality of life. Given that gender did not interact with childhood exposures, gender was adjusted in all models.
Results
Moderate to severe financial difficulties were experienced by 7.5% of the sample. The average SF36 physical functioning score was 1.4 (SD 2.2), with 29.9% of the sample above this level. The mean Malaise Inventory score measuring depression was 1.5 (SD 1.9), with 14.7% recording scores of four or more (indicating clinical depression). The maximum value of the social participation score was 29 out of a possible 50; with a mean value of 26.4 (SD 3.3) and 58.9% above this value (results not shown).
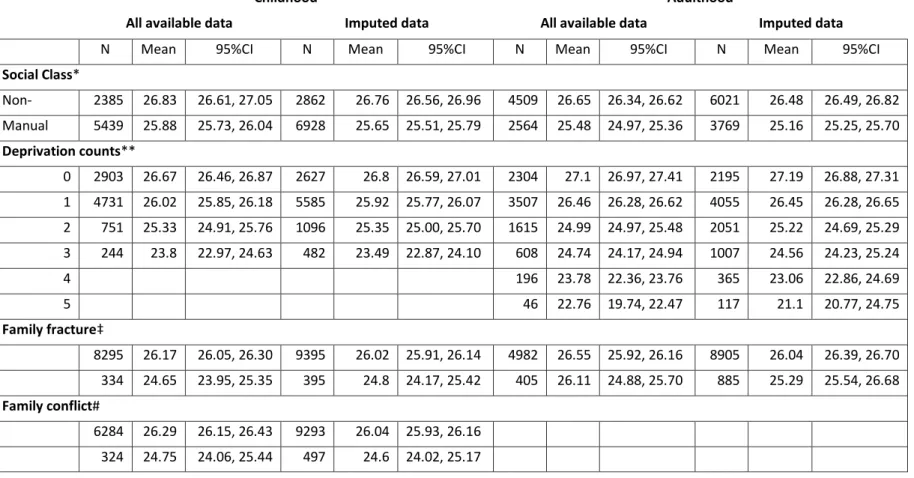
Table 1 shows that mean quality of life at age 50 years, as measured by CASP-12v.2, varies between those who had been in non-manual and manual social classes at birth (difference: 0.95 CASP units; p<0.001) and at age 33 years (difference: 1.17 CASP units; p<0.0001), with non-manual having the higher quality of life.
It is related in a stepwise fashion also to the level of deprivation experienced during childhood (difference 0-3 items: 2.87 CASP units; test for trend p<0.0001) and adulthood (difference 0-6 items: 4.34 CASP units; test for trend p<0.0001), with the least deprived having the highest quality of life.
In terms of psychosocial factors, mean quality of life at age 50 years, as measured by CASP-12v.2, is associated with family conflict at age 7 years (difference: 1.54 CASP units; p<0.0001) and with family fracture during childhood (difference: 1.52 CASP units; p<0.0001), but not with family fracture at age 33 years (difference: 0.44 CASP units; p 0.132).
In six out of the seven instances, the difference between the complete case and imputed means is small; the modest exception is deprivation during adulthood.
Figures 1-4 show the results of the path analyses. Following the convention to present the most parsimonious model, a path is shown only when its coefficient is significant statistically at the 95% level or above. The path coefficients are standardised
beta coefficients, allowing comparison of relative importance. The un-bracketed coefficients are derived from complete data, while the bracketed coefficients are derived from the imputed data.
Below each path diagram, a table reports the contribution of the various pathways to the relationship between childhood circumstances and quality of life at age 50 years, in both CASP and standard deviation units. The final column shows the share of each pathway. In Figure 1 for example, of the effect of father’s social class at birth on quality of life at age 50 years : 26% goes through social class at 33 years and its impact on quality of life at 50 years ; 45% goes through social class at 33 years and its impact on financial situation at 50 years; and 29% goes through social class at 33 years and impact on limiting illness at 50 years.
Longitudinal and Life Course Studies 2012 Volume 3 Issue 3 Pp 346 – 358 ISSN 1757-9597
Table 1. Quality of life (mean CASP-12v.2) at age 50 years by circumstances in childhood and adulthood; complete and imputed data
Childhood Adulthood
All available data Imputed data All available data Imputed data
N Mean 95%CI N Mean 95%CI N Mean 95%CI N Mean 95%CI
Social Class*
Non-manual
2385 26.83 26.61, 27.05 2862 26.76 26.56, 26.96 4509 26.65 26.34, 26.62 6021 26.48 26.49, 26.82
Manual 5439 25.88 25.73, 26.04 6928 25.65 25.51, 25.79 2564 25.48 24.97, 25.36 3769 25.16 25.25, 25.70
Deprivation counts**
0 2903 26.67 26.46, 26.87 2627 26.8 26.59, 27.01 2304 27.1 26.97, 27.41 2195 27.19 26.88, 27.31
1 4731 26.02 25.85, 26.18 5585 25.92 25.77, 26.07 3507 26.46 26.28, 26.62 4055 26.45 26.28, 26.65
2 751 25.33 24.91, 25.76 1096 25.35 25.00, 25.70 1615 24.99 24.97, 25.48 2051 25.22 24.69, 25.29
3 244 23.8 22.97, 24.63 482 23.49 22.87, 24.10 608 24.74 24.17, 24.94 1007 24.56 24.23, 25.24
4 196 23.78 22.36, 23.76 365 23.06 22.86, 24.69
5 46 22.76 19.74, 22.47 117 21.1 20.77, 24.75
Family fracture‡
8295 26.17 26.05, 26.30 9395 26.02 25.91, 26.14 4982 26.55 25.92, 26.16 8905 26.04 26.39, 26.70
334 24.65 23.95, 25.35 395 24.8 24.17, 25.42 405 26.11 24.88, 25.70 885 25.29 25.54, 26.68
Family conflict#
6284 26.29 26.15, 26.43 9293 26.04 25.93, 26.16
324 24.75 24.06, 25.44 497 24.6 24.02, 25.17
Notes.
* Childhood: at birth. Adulthood: at 33 years.
** Childhood: father’s social class at birth, family financial difficulties at age 7, free school meals at age 11, and family financial difficulties at age 16. Adulthood: living in crowded accommodation, receipt of benefits, and living in rented accommodation at ages 23 and 33.
D Blane, M Wahrendorf, E Webb, G Netuveli Life course influences on quality of life at age 50 years
Figure 1. Path analysis of father’s social class at time of NCDS member’s birth and NCDS member’s quality of life (CASP-12v.2) at age 50 years; results for complete data (N=6552) and imputed data [N= 9790]
Effect of father’s social class at birth on quality of life at 50 years
Paths Effect Contribution
CASP units SD units %
Social class @33 0.217 [0.262] 0.017 [0.020] 26 [26]
Social class @33 > Financ'l situation @ 50
-0.372 [-0.461] -0.030 [-0.036] 45 [45]
Social class @33 > Limiting illness @ 50
-0.241 [-0.290] -0.019 [-0.022] 29 [29]
Total indirect effects -0.396 [-0.489] -0.032 [-0.038] 100 [100]
Proportion of total association explained by the model 44%
D Blane, M Wahrendorf, E Webb, G Netuveli Life course influences on quality of life at age 50 years
Figure 2 shows that: (1) deprivation during childhood has direct effects on deprivation at age 33 years and on financial situation and limiting illness at 50 years, with the former having the strongest effect; (2) deprivation at 33 years has direct effects on financial situation and limiting
illness at 50 years, although unlike social class at 33 there is no direct effect on quality of life; (3) as in Figure 1, financial situation and limiting illness at 50 years have inverse direct effects on contemporaneous quality of life.
Figure 2. Path analysis of accumulated material deprivation during NCDS member’s childhood and adolescence and their quality of life (CASP-12v.2) at age 50 years; results for complete data (N=3147) and imputed data [N=9790]
Effect of childhood and adolescent deprivation on quality of life at 50 years.
Path Effect Contribution
CASP units SD units %
Deprivation @33 > Financ'l situation @ 50 -0.134 [-0.208] -0.017 [-0.028] 68 [68]
Deprivation @33 > Limiting illness @ 50 -0.064 [-0.115] -0.008 [-0.016] 32 [32]
Total indirect effects -0.198 [-0.323] -0.025 [-0.044] 100 [100]
Longitudinal and Life Course Studies 2012 Volume 3 Issue 3 Pp 346 – 358 ISSN 1757-9597
Figure 3 shows that: (1) family conflict at age 7 years has direct effects on depression and social participation at 50 years, but no direct effect on family fracture at 33 years; (2) family fracture at 33
years has direct effects on depression and social participation at 50 years; (3) both depression and social participation at 50 years have inverse direct effects on contemporaneous quality of life.
Figure 3. Path analysis of family conflict when NCDS member was aged seven years and NCDS member’s quality of life (CASP-12v.2) at age 50 years; results for complete data (N=4619) and imputed data [N=9790]
Effect of family conflict at seven on quality of life at 50 years.
Path Effect Contribution
CASP units SD units %
Depression @50 -0.713 [-1.065] -0.024 [0.003] 87 [89]
Social participation @ 50 -0.104 [-0.128] -0.003 [-0.008] 13 [11]
Total indirect effects -0.817 [-1.193] -0.027 [-0.047] 100 [100]
Longitudinal and Life Course Studies 2012 Volume 3 Issue 3 Pp 346 – 358 ISSN 1757-9597
Figure 4 shows that: (1) family fracture before age 7 years has a direct effect on depression at age 50 years, but no direct effect on family fracture at 33 years; (2) family fracture at 33 years has a direct effect on depression at 50 years; (3) both depression and social participation at 50 years have inverse direct effects on contemporaneous quality
of life; (4) three pathways are significant statistically only in the imputed data set: a direct path between family fracture before age 7 years and quality of life at 50 years; and paths to social participation at age 50 years from family fracture before age 7 and family fracture by age 33 years.
Figure 4. Path analysis of family fracture by the time the NCDS member was aged seven years and NCDS member’s quality of life (CASP-12v.2) at age 50 years; results for complete data (N=5919) and imputed data[N=9790]
Note. Dotted line refer to paths significant only in imputed datasets
Effect of family fracture by age seven on quality of life at 50 years.
Path Effect Contribution
CASP units SD units %
Depression @50 -0.609 [-0.776] 0.019 [0.026] 92 [60] Social Participation @50 -0.050 [-0.135] -0.002 [-0.004] 8 [10] Total indirect effects -0.659 [-0.911] -0.021 [-0.030] 100 [70] Direct effects 0 [-0.390] 0 [-0.013] 0 [30] Total effects -0.659 [1.301] -0.021 [-0.043] 100 [100]
D Blane, M Wahrendorf, E Webb, G Netuveli Life course influences on quality of life at age 50 years
Discussion
The use of prospective data has revealed life course influences on quality of life at age 50 years which were not detected when broadly similar analyses were conducted on life course data collected retrospectively. Four things are worth noting about these life course influences. First, their effect is modest; only the experience of deprivation in childhood and deprivation at age 33 years have an effect approaching in size the effect of having a limiting illness. Second, their effect is modest also in comparison with the influence on quality of life of well-recognised contemporaneous factors, such as financial adequacy, physical functioning, clinical depression and social participation. Third, with few exceptions, the life course affects quality of life at 50 years indirectly, via influence on these well recognised contemporaneous factors; only social class at age 33 years and, in the imputed data set only, family fracture before age seven years have a direct impact on quality of life at 50. Finally, the modest and largely indirect nature of life course influences on quality of life differs from the life course influences on physical health, where long-term effects are integral to the aetiology and pathology of, for example, cardiovascular and respiratory disease.
Three potential weaknesses need to be considered. First, an important assumption when using multiple imputation is that data are missing at random. In the case of the NCDS this may not be an always appropriate assumption, although grounds for cautious confidence come from the fact that in the present analyses multiple imputation mostly did not revise the substantive results derived from complete data. Comparison between the coefficients from the complete and imputed data models is difficult, because they come from different data sets, but the similarity in the contribution of the different paths suggests that our models are valid. The one exception is the path model for family fracture at age seven years, where the imputed data showed three paths which were not significant statistically in the complete cases model and contemporaneous depression and social participation had stronger associations with quality of life. This exception may be due to the involvement of family fracture in the imputation of all missing dependant variables (primary outcome
counter-balance, it is worth remembering that loss to follow-up in longitudinal studies tends to be greatest at the extremes of the social structure, thereby giving a conservative bias to results.
Second, we had the modest aim of showing the direct and indirect influences of childhood factors on adult wellbeing, so, when specifying our path models, we were thrifty in our use of variables, thereby exposing ourselves to the danger of omitting variables that might confound our models (Ploubidis & DeStavola, 2011).
Third, it is reasonable to protest that the Third Age does not start until after age 50 years, the age at which the outcome data used here were collected. The present findings come from the transition between mid-life and the Third Age; and should be seen as the baseline for future studies of early old age. It will be interesting to see whether the impact of life course influences on quality of life become stronger and more direct as the NCDS cohort ages deeper into the Third Age.
Two substantive conclusions of the analyses here reported are interesting. The first is scientific: that different dimensions of life at older ages appear to vary in their sensitivity to life course influences. The second concerns policy: that material deprivation early in life can have a significant long-term effect, but that contemporaneous circumstances are nevertheless the key to Third Age quality of life. These are considered in greater detail below.
D Blane, M Wahrendorf, E Webb, G Netuveli Life course influences on quality of life at age 50 years
way of life (financial and marital circumstances; tobacco smoking) but that, even after allowing for these contemporaneous factors, vegetable consumption in childhood predicted dietary quality 60 years later.
Life course influences on physical health at older ages appear to be stronger than those on quality of life or nutrition. Using data from a sub-sample of the Boyd Orr Cohort who had completed a lifegrid (Blane et al.,1999), Montgomery and colleagues showed that slow pre-pubertal growth, interpreted as an indicator of psycho-social stress during childhood, interacted with later occupational stress during adulthood to raise blood pressure in early old age (Montgomery et al., 2000); findings which were replicated in the National Survey of Health and Development (Langenberg et al., 2005).
The variability between quality of life, nutrition and health, in the importance of life course influences, prompts the question of how other aspects of life at older ages might behave. Montgomery’s work on resilience (Osika et al., 2006; Montgomery et al., 2007; Osika & Montgomery, 2008) suggests that more complex relationships are possible in which, for example, early life advantage can paradoxically be a disadvantage when faced with adversity at older ages (the disappointment paradox).
Of the life course exposures investigated here, material deprivation during childhood and adulthood had the most substantial effects on quality of life at age 50 years. This is a
demonstration of a relationship found previously in cross-sectional data from the English Longitudinal Study of Ageing, where social class differences in quality of life at ages 50-74 years were largest in those unemployed or permanently sick (Blane et al.,
2007). In the presently reported analyses, these relationships were indirect, via contemporaneous financial adequacy and physical functioning.
The work of Morris and colleagues on the Minimum Income for Healthy Living (MIHL) is relevant to both financial adequacy and physical functioning at older ages. Morris found that the UK State Pension in 2007 provided only two-thirds of the Minimum Income for Healthy Living for an older person without disability, and that even the higher UK Pension Credit Guarantee was some £12 pounds per person per week less than MIHL (Morris et al.,
2007). The weekly shortfall in income will be greater for older people with disability and impaired physical functioning. With good reason, Goldblatt and Marmot’s recent policy review of health inequalities in England and Wales emphasised the importance of the Minimum Income for Healthy Living (Marmot Review 2010).
Conclusions
Prospective data reveal life course influences on quality of life at the start of the Third Age. The influence of these longitudinal factors mainly is indirect and weak in comparison with that of contemporaneous circumstances. In this respect quality of life differs from health.
Acknowledgements
D Blane, M Wahrendorf, E Webb, G Netuveli Life course influences on quality of life at age 50 years
References
Blane, D., Berney, L., Davey Smith, G., Gunnell, D., & Holland, P. (1999). Reconstructing the life course: a 60 year follow-up study based on the Boyd Orr cohort. Public Health, 113, 117-124.
Blane, D., Netuveli, G., & Bartley, M. (2007). Does quality of life at older ages vary with socio-economic position? Sociology 41, 717-726.
Blane, D., Higgs, P., Hyde, M., & Wiggins, R. (2004). Life course influences on quality of life in early old age.
Social Science and Medicine 58, 2171-2179.
Bowling, A., Farquhar, M., & Browne, P. (1991). Life satisfaction and associations with social networks and support variables in three samples of elderly people. International Journal of Geriatric Psychiatry 6, 549-566.
Bowling, A. (1995). The most important things in life: comparisons between older and younger population age groups by gender; results from a national survey of the public’s judgements. International Journal of Health Sciences 6, 169-175.
Bowling, A. (1996). The effects of illness on quality of life: findings from a survey of households in Great Britain. Journal of Epidemiology and Community Health 50, 149-155.
Bury, M. (1995). Ageing, gender and sociological theory. In S. Arber, & J. Ginn (Eds.), Connecting Gender and Ageing (pp.15-30).Philadelphia: Open University Press.
Davey Smith, G., Hart, C., Blane, D., Gillis, G., & Hawthorne, V. (1997). Lifetime socioeconomic position and mortality: prospective observational study. British Medical Journal 314, 547-552.
Farquhar, M. (1995). Elderly people’s definitions of quality of life. Social Science and Medicine 41, 1439-1446.
Gilleard, C., & Higgs, P. (2000). Cultures of Ageing. London: Prentice Hall.
Higgs, P., Hyde, M., Wiggins, R., & Blane, D. (2003). Researching quality of life in early old age: the importance of the sociological dimension. Social Policy and Administration 37, 239-252.
Hyde, M., Wiggins, R., Higgs, P., & Blane, D. (2003). A measure of quality of life in early old age: the theory, development and properties of a needs satisfaction model (CASP-19). Aging and Mental Health 7, 186-194.
Jopp, D., & Schmitt, M. (2010). Dealing with negative life events: differential effects of personal resources, coping strategies and control beliefs. European Journal of Ageing 7, 167-180. doi: 10.1007/s10433-010-0160-6.
Knesebeck, Ovd., Wahrendorf, M., Hyde, M., & Siegrist, J. (2007). Socio-economic position and quality of life among older people in 10 European countries: results of the SHARE study. Ageing and Society 27, 269-284.
Kuh, D., Hardy, R., Butterworth, S., Okell, L., Richards, M., Wadsworth, M., Cooper, C., & Sayer, A. (2006). Developmental origins of midlife physical performance: evidence from a British birth cohort.
American Journal of Epidemiology 164, 110-121.
Langenberg, C., Hardy, R., Kuh, D., Brunner, E., & Wadsworth, M. (2003). Central and total obesity in middle aged men and women in relation to lifetime socioeconomic status: evidence from a national birth cohort. Journal of Epidemiology and Community Health 57, 816-822.
Langenberg, C., Hardy, R., Breeze, E., Kuh, D., & Wadsworth, M. (2005). Influence of short stature on the change in pulse pressure, systolic and diastolic blood pressure from age 36 to 53 years : an analysis using multilevel models. International Journal of Epidemiology 34, 905-913.
Langenberg, C., Kuh, D., Wadsworth, M., Brunner, E., & Hardy, R. (2006). Social circumstances and education: life course origins of social inequalities in metabolic risk in a prospective national birth cohort. American Journal of Public Health 96, 2216-2221.
Laslett, P. (1996). A Fresh Map of Life (2nd Edition). London: Macmillan Press.
Marmot Review. (2010). Fair Society, Healthy Lives : strategic review of health inequalities in England post-2010. London: Marmot Review.
Martin, R., Gunnell, D., Pemberton, J., Frankel, S., & Davey Smith, G. (2005). Cohort profile : The Boyd Orr Cohort – an historical cohort study based on the 65 year follow-up of the Carnegie Survey of Diet and Health (1937-39). International Journal of Epidemiology 34, 742-749.
Maynard, M., Gunnell, D., Abraham, L., Ness, A., Bates, C., & Blane, D. (2006). What influences diet at older ages? Prospective and cross-sectional analyses of the Boyd Orr cohort. European Journal of Public Health 16, 315-323.
Muthén, B. (2011). Applications of causally defined direct and indirect effects in mediation analysis using SEM in Mplus. Retrieved from http://www.statmodel.com/download/causalmediation.pdf.
Montgomery, S., Berney, L., & Blane, D. (2000). Pre-pubertal growth and blood pressure in early old age.
Archives of Disease in Childhood 82, 358-363.
891-D Blane, M Wahrendorf, E Webb, G Netuveli Life course influences on quality of life at age 50 years
Morris, J.N., Wilkinson, P., Dangour, A., Deeming, C., & Fletcher, A. (2007). Defining a minimum income for healthy living (MIHL) : older age, England. International Journal of Epidemiology 36, 1300-1307. Netuveli, G., Hildon, Z., Montgomery, S., Wiggins, R., & Blane, D. (2006). Quality of life at older ages:
evidence from English Longitudinal Study of Ageing. Journal of Epidemiology and Community Health
60, 357-363.
Osika, W., Ehlin, A., Montgomery, S. (2006). Does height modify the risk of angina associated with economic adversity? Economics & Human Biology 4, 398-411.
Osika, W., & Montgomery, S. (2008). Economic disadvantage modifies the association of height with low mood in the US, 2004: the disappointment paradox. Economics & Human Biology 6, 95-107.
Ploubidis, G., & DeStavola, B. (2011). Health differentials in the older population of England: an empirical comparison of the materialist, lifestyle and psychosocial hypotheses. BMC Public Health 11:390. Rubin, D. (1987). Multiple Imputation for Non-response in Surveys. New York: J. Wiley & Sons.
Rutter, M., Tizard, J., & Whitmore, K. (1970). Education, Health and Behaviour. London: Longmans.
Siegrist, J., & Wahrendorf, M. (2009). Participation in socially productive activities and quality of life in early old age: findings from SHARE. Journal of European Social Policy 19, 317-326.
Wahrendorf, M., Knesebeck, O., & Siegrist, J. (2006). Social productivity and well-being of older people: baseline results from the SHARE study. European Journal of Ageing 3, 67-73.
Wahrendorf, M., & Siegrist, J. (2010). Are changes in productive activities of older people associated with changes in their well-being?: results from a longitudinal European study. European Journal of Ageing
7, 59-68.
Webb, E., Netuveli, G., McMunn, A., & Blane, D. (2011). Proximal predictors of change in quality of life at older ages. Journal of Epidemiology and Community Health 65, 542-547.
Wiggins, R., Higgs, P., Hyde, M., & Blane, D. (2004). Quality of life in the third age: key predictors of the CASP-19 measure. Aging and Society 24, 693-708.
Wiggins, R., Netuveli, G., Hyde, M., Higgs, P., & Blane, D. (2008). The evaluation of a self-enumerated scale of quality of life (CASP-19) in the context of research on ageing: a combination of exploratory and confirmatory approaches. Social Indicators Research 89, 61-77.
![Figure 1. Path analysis of father’s social class at time of NCDS member’s birth and NCDS member’s quality of life (CASP-12v.2) at age 50 years; results for complete data (N=6552) and imputed data [N= 9790]](https://thumb-us.123doks.com/thumbv2/123dok_us/8070769.2137888/6.893.101.806.231.560/figure-analysis-father-member-quality-results-complete-imputed.webp)
![Figure 2. Path analysis of accumulated material deprivation during NCDS member’s childhood and adolescence and their quality of life (CASP-12v.2) at age 50 years; results for complete data (N=3147) and imputed data [N=9790]](https://thumb-us.123doks.com/thumbv2/123dok_us/8070769.2137888/7.893.91.798.378.767/analysis-accumulated-material-deprivation-childhood-adolescence-complete-imputed.webp)
![Figure 3. Path analysis of family conflict when NCDS member was aged seven years and NCDS member’s quality of life (CASP-12v.2) at age 50 years; results for complete data (N=4619) and imputed data [N=9790]](https://thumb-us.123doks.com/thumbv2/123dok_us/8070769.2137888/8.893.89.795.352.740/figure-analysis-conflict-member-quality-results-complete-imputed.webp)
![Figure 4. Path analysis of family fracture by the time the NCDS member was aged seven years and NCDS member’s quality of life (CASP-12v.2) at age 50 years; results for complete data (N=5919) and imputed data[N=9790]](https://thumb-us.123doks.com/thumbv2/123dok_us/8070769.2137888/9.893.169.665.429.712/figure-analysis-fracture-member-quality-results-complete-imputed.webp)
