An Autonomic Performance Environment for Exascale
Kevin A. Huck1, Allan Porterfield2, Nick Chaimov1, Hartmut Kaiser3, Allen D. Malony1, Thomas Sterling4, Rob Fowler2
c
The Authors 2017. This paper is published with open access at SuperFri.org
Exascale systems will require new approaches to performance observation, analysis, and runtime decision-making to optimize for performance and efficiency. The standard “first-person” model, in which multiple operating system processes and threads observe themselves and record first-person performance profiles or traces for offline analysis, is not adequate to observe and capture interactions at shared resources in highly concurrent, dynamic systems. Further, it does not support mechanisms for runtime adaptation. Our approach, called APEX (Autonomic Performance Environment for eXascale), provides mechanisms for sharing information among the layers of the software stack, including hardware, operating and runtime systems, and application code, both new and legacy. The performance measurement components share information across layers, merging first-person data sets with information collected by third-person tools observing shared hardware and software states at node- and global-levels. Critically, APEX provides a policy engine designed to guide runtime adaptation mechanisms to make algorithmic changes, re-allocate resources, or change scheduling rules when appropriate conditions occur.
Keywords: ParalleX, HPX, exascale, performance measurement, adaptive runtimes.
Introduction
The transition to extreme-scale computing poses new challenges in performance analysis and optimization because of the anticipated high concurrency and dynamic operation that will be required to make extreme-scale systems operate efficiently. Increasingly heterogeneous hard-ware, deeper memory hierarchies, reliability concerns, and constraints posed by power limits will contribute to a dynamic environment in which hardware and software performances may vary considerably during the application’s execution. Furthermore, emerging exascale programming models will emphasize message-driven computation and finer-grained parallelism, resulting in
more asynchronous computation. It is no longer reasonable to expect that a post-mortem
per-formance measurement and analysis methodology will suffice to optimize applications in such an environment.
Rather, there is a strong need for runtime performance observation that merges in real time
first-person (application perspective) withthird-person (resource perspective) introspection, and
forin situ performance analytics to identify bottlenecks and their impact on specific sections of
code. This information can drive online dynamic feedback and adaptation techniques that can be integrated with an exascale software stack. The goal is to create an autonomic capability in the exascale system that can direct the application performance to more productive execution
outcomes. In this paper, we describe our prototype implementation of an Autonomic
Perfor-mance Environment for eXascale (APEX) that is the part of the OpenX integrated software
stack being developed in the DOE XPRESS project [9] (see Section 1). The APEX prototype supports both introspection and policy-driven adaptation for performance and power optimiza-tion objectives. We describe the APEX design and development in Secoptimiza-tion 2. Secoptimiza-tion 3 shows several examples that demonstrate the effects of APEX-enabled execution. This focuses on
mak-1Performance Research Laboratory, University of Oregon, Eugene, OR 97405, USA
2Renaissance Computing Institute, University of North Carolina, Chapel Hill, NC 27517, USA 3The STE
||AR Group, Louisiana State University, Baton Rouge, LA 70803, USA
ing guided adjustments to thread-scheduling controls for different policy objectives. Section 5 discusses the next steps in our research work.
1. XPRESS Project
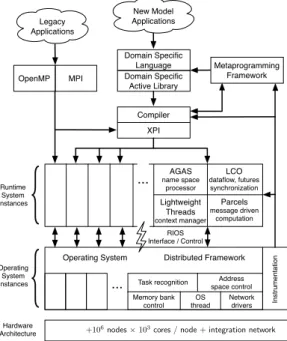
The XPRESS project is organized into four major elements: system software, programming models and languages, applications and cross-cutting issues. The HPX-3 runtime system [3, 18, 35] serves as a starting point as programming tools and runtime system target at the beginning of the XPRESS project. This has been complemented by the development of HPX-5, which is being developed to add functionality for fault tolerance and power management, and to provide a robust open-source runtime system. The LXK lightweight kernel operating system based on the advanced Kitten operating system [7, 31] is being developed in response to the new requirements for billion-way concurrency, introspective management of faults and power, and management of a protected and dynamic global virtual name space. It targets projected future directions of system architectures while running efficiently on near term systems. LXK is co-designed with HPX around the centrepiece of the RIOS interface between the runtime and operating system software. This interface will share information in both directions between the two major software layers for performance, reliability and control of power consumption. The OpenX software stack is shown in fig. 1.
Legacy Applications
New Model Applications
MPI
Metaprogramming Framework Domain Specific
Active Library
Compiler
AGAS
name space processor
LCO
dataflow, futures synchronization
Lightweight Threads
context manager
Parcels
message driven computation ...
OpenMP
XPI
Task recognition Address space control Memory bank
control OS
thread In
st
ru
me
n
ta
ti
o
n
Network drivers
Distributed Framework Operating System
Hardware Architecture Operating
System Instances Runtime
System Instances
RIOS Interface / Control
{
{
Domain Specific Language
+106nodes⇥103cores / node+integration network ...
Figure 1. Major components of the OpenX architecture stack. APEX is the cross-cutting
instrumentationcomponent
models, thus provide interoperability between software modules in both forms, and provide a path for incrementally extending parallelism within the MPI and OpenMP frameworks. APEX provides performance instrumentation interfaces compatible with XPI, DSL, and legacy codes. Essential cross-cutting functions include automatic control and introspection, resilience, power management and heterogeneity. Power-management software in combination with antic-ipated energy-efficient hardware will achieve much greater resource utilization per joule while reducing data movement dramatically, a major source of power consumption through active locality management. APEX represents the initial research prototype for introspection and dy-namic control required for the XPRESS project.
2. APEX Design
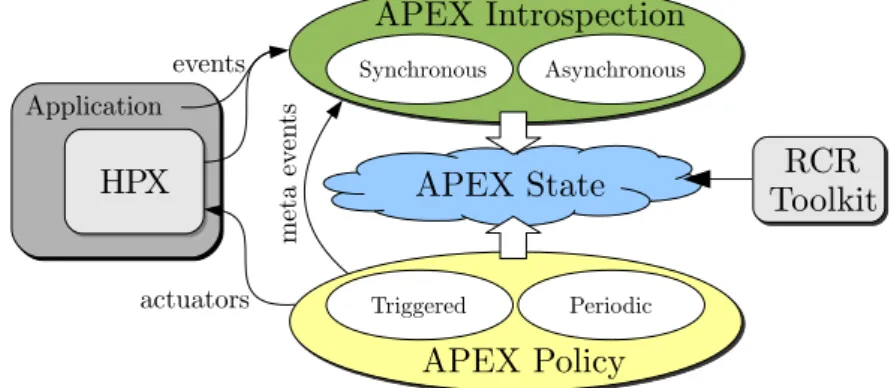
2.1. OverviewAPEX aims to enable autonomic behavior in software by providing the means for applica-tions, runtimes, and operating systems to observe and control their performance. Autonomic behavior requires performance awareness (introspection) and performance control/adaptation. APEX is designed around these two main components. APEX provides introspection from both top-down and bottom-up perspectives, including node-wide resource utilization data, energy consumption, and health information, all accessed in real-time. The introspection results are combined and associated with policy rules in order to provide the feedback control mechanism.
APEX Introspection
APEX Introspection Synchronous
APEX Policy
APEX Policy Asynchronous
Triggered Periodic APEX State
HPX
HPX
Application
RCR Toolkit
RCR Toolkit
events
meta ev
en
ts
actuators
Figure 2. APEX design
2.2. Introspection
APEX collects top-down introspection data from a runtime system, library, or high-level
application through an event-basedinspectorAPI. The software to be controlled is instrumented
with this event API. APEX recognizes several types of logistic events such as initialization,
termination, setting a process rank (e.g.,an MPI rank, or HPX locality ID), and creating a new
thread. For measurement, APEX has instrumented timer-start and timer-stop calls, as well as
sampled counter values (e.g., bytes transferred, queue length, idle rate). These API calls enter
APEX as events. Internally, APEX has several eventlistenersthat perform actions based on the
are also available to trigger specific policy engine rules. Further explanation of this behavior is presented in Section 2.4.
Bottom-up introspection data is collected from the operating system and hardware using
periodic sampling. These measurements do not use events, but some additional OS threads are spawned to periodically read values directly from available sources. On Unix-like systems, the /proc virtual filesystem files provide access to CPU, memory, network, disk, process, and operating system statistics. Resource Centric Reflection (RCR) [21, 22] provides a user-level API to access any counter available through PAPI, PERF EVENTS, or a hardware instruction. RCRdaemon runs on protection ring 0 and supplies information about hardware resources shared
by more than one core (e.g.,energy consumption, Last Level Cache events, or memory-controller
usage) in a data structure that can be read at user-level. RCRdaemon uses a self-describing hierarchical data structure in a shared memory region to transmit protected counter values in an application-agnostic manner. The power interface reads these values and can be used by any application to acquire power/energy information. RCR calipers can be placed around any code region (up to the entire application) to measure energy used by that region. On Cray systems the access to the protection level 0 is denied, but the Cray PM Counters [23] facility is available. RCRdaemon was therefore modified to get its data from this source. The values were then placed into the same data structure previously used. The user API was unchanged. Updates occur at
the same rate as Cray updates /proc.
2.3. Event Listeners
As mentioned in Section 2.2, APEX events are processed by event listeners. Each listener is implemented as a C++ class, and as events pass through APEX, each instantiated listener is given access to the event object. The listeners implement handler methods for each event
type available in the system. Notable event listeners in APEX include the Profiling Listener,
theConcurrency Listener, thePolicy Engine Listener, and theTAU Listener.
The profiling listener implements timer and counter measurement back-end processing
in APEX. The salient events processed by the profiling listener include the timer start,
timer stop, and sample value events. When the profiling listener gets a timer start event, it creates a profiler object, generates a timestamp, and returns a handle to the profiler object.
When the profiling listener gets a timer stop event, it takes a second timestamp, puts the
profiler object in a single-producer-single-consumer (spsc) queue for back-end processing, and returns. Each OS thread in the process has its own spsc queue to avoid contention. Similarly,
when the profiling listener gets a sample value event, it creates a profiler object, puts it in
the spsc queue for back-end processing, and returns. The profiling listener has a background
consumer thread that waits for a signal that indicates that data has been pushed onto one of
the queues. When the consumer thread has been signalled, it clears all of the spsc queues of pending work by removing a profiler object from the queue and updates the per-thread and per-process statistical profile for the running application. The current executing profile can be queried subsequently at runtime through an introspection API. The optional TAU listener is similar to the profiling listener with the exception that all processing is done synchronously through the TAU measurement library in order to generate a detailed profile or trace for offline, post-mortem performance analysis.
The concurrency listener works as follows. The salient events processed by the profiling
timer start event, it pushes the timer ID onto a thread-specific stack, and returns. When the
profiling listener gets atimer stopevent, it pops a timer ID off of the thread-specific stack. The
concurrency listener also has a background consumer thread that periodically examines the top of each thread’s timer stack and builds a histogram reporting the task currently being executed by each thread during that time quantum. At the end of execution, the histograms are written
to files on disk and gnuplot [37] is used to visualize a concurrency graph of the application.
Fig. 3–7 are examples of concurrency graphs. The concurrency listener does not have a role in runtime adaptation and is instantiated only when concurrency graphs are desired.
2.4. The Policy Engine
The most important listener component in APEX is the Policy Engine. The policy engine provides autonomic controls to an application, library, runtime, or operating system using the introspection measurements described in Section 2.2. Policies are rules that decide on outcomes based on the observed state captured by APEX. The rules are encoded as callback functions
that are registered with APEX and are eithertriggeredorperiodic. Triggered policies are invoked
by an APEX event, whereas periodic policies, by definition, are executed at set intervals. The policy rule functions have access to the APEX API in order to request profile values from any measurement collected by APEX. Using these values to make logical decisions, the functions can change the behavior of the application by whatever means available, such as throttling threads, changing task granularity, or triggering data movement such as mesh refinement or repartitioning. In this way, the policy engine enables runtime adaptation using introspection data, engages actuators across stack layers, and can be used to invoke online auto-tuning support.
2.5. Global Performance Views
Thus far in the discussion performance introspection has been limited to local node obser-vations. No performance information from remote nodes or processes is available implicitly to the local policy functions. However, there are situations in which global performance informa-tion is necessary to make runtime adaptainforma-tion decisions for problems such as load balancing. In those cases, APEX provides a skeleton interface for exchanging local information in a dis-tributed application scenario. The global exchange of local performance data in APEX is similar to that provided by TAUg [16], in which TAU performance data collected by an MPI application was exchanged using MPI functions. Rather than be tied directly to a specific communication infrastructure, APEX provides a skeleton interface to be populated using the distributed com-munication library used in the application to be controlled. Examples implemented so far include HPX-3, HPX-5 and MPI. The interface that the runtime has to implement includes two
func-tions: action apex get value() – each node gets local data to be reduced and performs an
optional put(if implementing a push model) andaction apex reduce() – each node performs
an optional get(if implementing a pull model), all remote node data is aggregated at root node,
2.6. HPX Integration
APEX is integrated with operating systems, runtime systems, libraries, and applications by instrumenting the code with calls to the APEX introspection API, as well as by registering desired policy functions and global communication. Because both HPX-3 and HPX-5 are task-based runtime systems, we added the instrumentation in the respective task schedulers, placing timer start/stop calls just before and after task functions are executed, taking special care to
avoid measuring internal lightweight tasks such as “no-op”.Sample value()calls were added to
capture internal runtime statistics (i.e.,number of yields, steals, spins,etc.) and we added other
instrumentation for initialization, thread creation and termination. Where applicable, we wrote policy functions and added the code to register the policy functions to perform adaptation of the runtime system. All the examples described in Section 3 modify runtime behavior in the same way, by setting a cap on the maximum number of active worker threads, so we also modified the HPX thread scheduler loop for worker threads to check the cap value and de-activate the worker thread if the number of active threads is greater than the thread cap. Even though we are measuring nearly every task executed by the runtime, our measurements show that the overhead introduced by APEX does not exceed 2% and is usually less than 1%, depending on the granu-larity of the executed tasks. We believe that this is due to our asynchronous profile-processing combined with the small but sufficient amount of available processing capacity headroom when executing on many-core nodes. Global performance data is exchanged in HPX using the Active Global Address Space (AGAS).
3. Experimental Results
In order to demonstrate the features and capabilities of APEX, we integrated it with two distinct but related runtimes, HPX-3 and HPX-5. We implemented a variety of policy rules, and we present a selection of them here, along with the applications that best demonstrate them. In this section we present the following examples:
• HPX-3 1-D stencil code, runtime optimized for best performance
• HPX-5 Single-source, shortest-path benchmark, runtime optimized for highest throughput
• HPX-5 LULESH kernel, runtime modified to stay under a user-specified power cap
• HPX-3 miniGhost kernel, runtime modified to stay under a user-specified power cap
All of the experiments described below were conducted on Edison, a Cray XC30 system deployed at NERSC [36]. Edison has 5576 nodes with two 12-core Intel “Ivy Bridge” processors operating at 2.4 GHz, with a total of 48 threads per node (24 physical cores w/hyperthreading). The network on Edison is a Cray Aries interconnect with Dragonfly topology, with 23.7 TB/s global bandwidth. As LXK hadn’t been integrated with HPX yet, the applications were executed on the Compute Node Linux (CNL) operating system.
3.1. HPX-3 1-D Stencil Code
future. Within a node, performance initially increases with an increasing number of worker threads, but then decreases.
Fig. 3a shows the runtime (blue line) of the 1D stencil code as function of number of worker threads from 1 to 24, which is the number of physical cores available on Edison nodes. It also shows that runtime is highly correlated with the average thread queue length (red line), which is a counter exposed by the HPX-3 runtime representing the number of tasks waiting to execute on worker threads. APEX can query the thread queue length while the program is executing and adjust dynamically the number of worker threads allocated to minimize runtime.
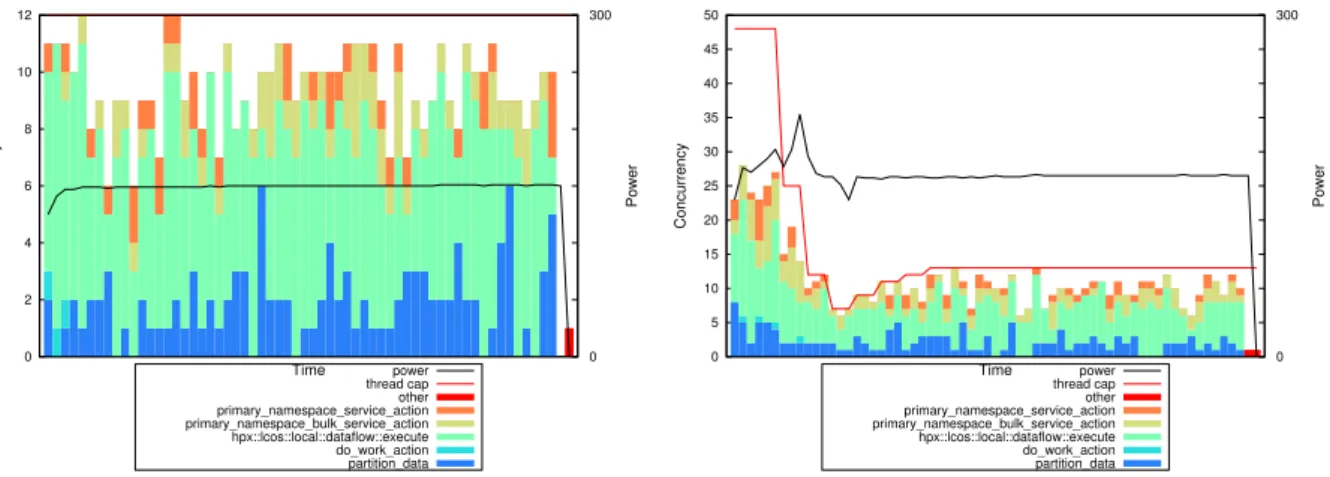
Fig. 3b shows the concurrency graph for the execution of the 1D stencil code run on 100,000,000 elements partitioned into 1000 chunks with 48 worker threads, which is the number of logical cores available on the Edison node with hyperthreading enabled. Actual concurrency is substantially lower, as many tasks wait on dependencies to complete before become eligible to run, and there is a substantial variability in actual concurrency over time. This execution takes 138 seconds to run. Fig. 3c shows the concurrency graph for an execution of the same problem size but with 12 worker threads, which produces the shortest runtime of any number of worker threads. That execution takes 61 seconds to run.
Fig. 3d shows the concurrency graph for the same problem size and an initial number of worker threads of 48, but using discrete hill-climbing search to minimize the average thread
queue length. It converges on 13 worker threads (vs. the optimal value of 12) and acts in an
enough quick way so that the overall runtime is nearly as fast (64 seconds) as starting with the optimal number.
3.2. HPX-5 SSSP benchmark
The Single Source, Shortest Path graph search benchmark (SSSP)5 is a candidate for
in-clusion in the Graph5006 benchmark kernels. Given an initial graph, the SSSP benchmark
computation finds the shortest distance from a given starting vertex to every other vertex in the graph. In the HPX-5 implementation, a large graph is loaded and distributed across localities, a point is selected at random, and the shortest path between it and all other points is found. The search runs for a fixed length of time and terminates when the accumulated time performing searches exceeds the specified length of time. Key constraints of the benchmark are that only one initial vertex search is performed at a time, and no memoization between searches is allowed. The dataset used in this example is the Random4-n.10 dataset, executed for 60 seconds worth of timed searches. For this benchmark, the metric of interest is total throughput, not time to completion. The code was run on 10 nodes, using 24 threads per node (no hyperthreading).
The APEX Policy rule used for optimization of SSSP was the maximization of the number of
calls to handle queue action(), used as proxy for the “throughput” metric. The primary
met-ric for this benchmark is Traversed Edges Per Second (TEPS), and the queue contains vertices to be explored. The policy function adjusts the thread concurrency to maximize throughput,
using the Parallel Rank Order search strategy provided by the auto-tuning and optimization
search frameworkActive Harmony[10]. The initial value for the thread cap was set at 24, with
a minimum value of 6. The policy function was registered to execute on a periodic basis (1Hz), adjusting the thread cap to a new value as specified by the optimization search.
5http://hpx.crest.iu.edu/applications
53 63 73 83 93 103 113 1230 20 40 60 80 100 120 140
1 2 3 4 5 6 7 8 9 10 11 12 13 14 15 16 17 18 19 20 21 22 23 24
Thread Queue Lengt
h
Runtime (s)
Number of Worker Threads
1d_stencil
a) 1D stencil strong scaling. This chart shows the correlation between the execution time (blue line) and the queue lengths (red line) when running with
different numbers of threads on Edison
0 5 10 15 20 25 30 35 40 45 50 0 300 Concurrency Power Time partition_data do_work_action hpx::lcos::local::dataflow::execute primary_namespace_bulk_service_action primary_namespace_service_action other thread cap power
b) 1D Stencil unthrottled. This concurrency chart shows a stacked bar chart with the periodic (1 Hz)
status of each OS thread. The max number of threads is 48, and the instantaneous power for each
sample is the black line
0 2 4 6 8 10 12 0 300 Concurrency Power Time partition_data do_work_action hpx::lcos::local::dataflow::execute primary_namespace_bulk_service_action primary_namespace_service_actionother thread cap power
c) 1D Stencil with ideal number of threads. This concurrency chart shows the periodic (1 Hz) status
of each OS thread. The number of threads is fixed at 12, and the instantaneous power for each sample
is the black line
0 5 10 15 20 25 30 35 40 45 50 0 300 Concurrency Power Time partition_data do_work_action hpx::lcos::local::dataflow::execute primary_namespace_bulk_service_action primary_namespace_service_actionother thread cap power
d) 1D Stencil throttled by APEX. This concurrency chart shows the periodic (1 Hz) status of each OS thread. The number of active threads starts at 48, but is throttled while APEX searches for an optimal
number of active threads to minimize execution time. The evolving thread cap is the red line, and
the instantaneous power draw is the black line
Figure 3. 1D Stencil
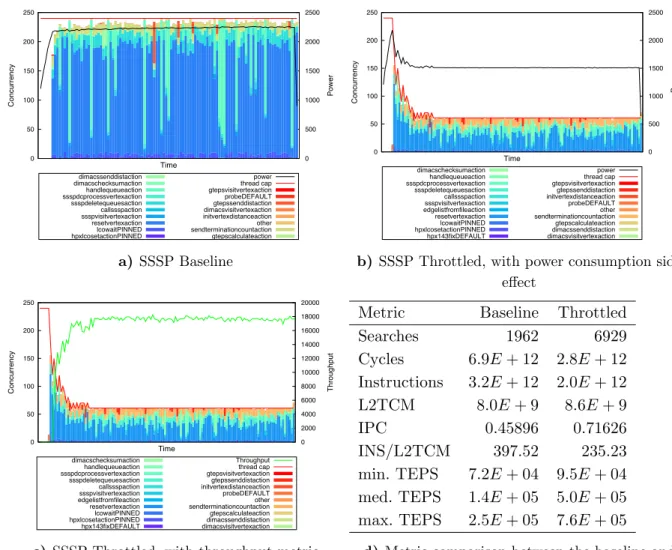
Fig. 4a shows the cumulative concurrency graph across all 10 nodes for the baseline execu-tion. The concurrency charts show a stacked bar chart with the periodic (1Hz) instantaneous status of all threads. The red line indicates the maximum total number of threads (fixed at 240), and the black line is the instantaneous power measurement for each sample. In this run, 1962 searches are performed in 60 seconds. The graph shows that nearly all 240 threads are busy, and power consumption is about 240 W per node.
instantaneous power for each sample is the black line. In this execution, 6929 searches were per-formed in 60 seconds. When the search converges, only 61 (6 threads on 9 nodes, 7 threads on one node) threads are active. As a side-effect, power consumption is much lower, about 150 W per node. Most importantly, the number of searches done in the 60 seconds is several times higher.
Fig. 4c shows the correlation between the throughput (total calls to handle queue action())
and the evolving thread cap.
Tab. 4d shows a comparison of key metrics between the baseline and the runtime optimized executions of SSSP. In the throttled execution, the total cycles and instruction counts are re-duced, while the number of L2 cache misses increases slightly. Because the graph is distributed, visiting remote vertices requires network communication. The network request causes a worker thread to yield the task waiting on the network request to perform other work, rather than block and wait on the result. The yield process is implemented using locks, so increased requests for the network lead to lock contention in the runtime. The yield algorithm also includes a small amount of “busy work”, which explains the reduction in instructions. Essentially, this appli-cation implementation appears to be network-bound, so reducing the number of active worker threads decreases the contention for yielded tasks. As it can be seen in the table, the TEPS metrics are increased considerably by throttling, resulting in greater throughput. It is important to note that the problem is not with the runtime, but with the nature of the implementation. Because the graph is distributed, the threads contend while waiting on remote actions.
0 50 100 150 200 250 0 500 1000 1500 2000 2500 Concurrency Power Time hpxlcosetactionPINNEDlcowaitPINNED resetvertexaction ssspvisitvertexactioncallssspaction ssspdeletequeuesaction ssspdcprocessvertexactionhandlequeueaction dimacschecksumactiondimacssenddistaction gtepscalculateaction sendterminationcountactionother initvertexdistanceactiondimacsvisitvertexaction gtepssenddistactionprobeDEFAULT
gtepsvisitvertexactionthread cap
power
a) SSSP Baseline
0 50 100 150 200 250 0 500 1000 1500 2000 2500 Concurrency Power Time hpx143fixDEFAULT hpxlcosetactionPINNEDlcowaitPINNED resetvertexaction edgelistfromfileactionssspvisitvertexaction callssspaction ssspdeletequeuesaction ssspdcprocessvertexactionhandlequeueaction dimacschecksumaction dimacsvisitvertexactiondimacssenddistaction gtepscalculateaction sendterminationcountactionother probeDEFAULT initvertexdistanceactiongtepssenddistaction gtepsvisitvertexactionthread cap power
b) SSSP Throttled, with power consumption side effect 0 50 100 150 200 250 0 2000 4000 6000 8000 10000 12000 14000 16000 18000 20000 Concurrency Throughput Time hpx143fixDEFAULT hpxlcosetactionPINNEDlcowaitPINNED resetvertexaction edgelistfromfileactionssspvisitvertexaction callssspaction ssspdeletequeuesaction ssspdcprocessvertexactionhandlequeueaction dimacschecksumaction dimacsvisitvertexactiondimacssenddistaction gtepscalculateaction sendterminationcountactionother probeDEFAULT initvertexdistanceactiongtepssenddistaction gtepsvisitvertexactionthread cap Throughput
c) SSSP Throttled, with throughput metric correlation to thread cap
Metric Baseline Throttled
Searches 1962 6929
Cycles 6.9E+ 12 2.8E+ 12
Instructions 3.2E+ 12 2.0E+ 12
L2TCM 8.0E+ 9 8.6E+ 9
IPC 0.45896 0.71626
INS/L2TCM 397.52 235.23
min. TEPS 7.2E+ 04 9.5E+ 04
med. TEPS 1.4E+ 05 5.0E+ 05
max. TEPS 2.5E+ 05 7.6E+ 05
d) Metric comparison between the baseline and throttled executions of SSSP
3.3. HPX-5 LULESH kernel
The Livermore Unstructured Lagrangian Explicit Shock Hydrodynamics (LULESH) bench-mark is one of the proxy applications for the US Department of Energy co-design efforts for exascale. LULESH is an application from the Lawrence Livermore National Laboratory (LLNL) that is used to model and study hydrodynamics, the motion of materials relative to each other when subject to forces. The HPX-5 LULESH implementation was written by the HPX-5 re-searchers at Indiana University. Because LULESH is CPU bound in most implementations, it is an interesting test case to demonstrate what happens when executed under a power cap. As it is CPU bound, reducing the power consumption typically involves using fewer threads or slowing down the CPU clock speed, which will affect performance.
For this example, we developed an APEX policy for maintaining power draw within a high/low range. The policy will periodically check the power draw, and if the current power draw is greater than the high power cap, the thread cap will be reduced. If the power draw is lower than the low power cap, the thread cap will be increased. The policy rule is a simple
hill-climbing algorithm with hysteresis, using a running average of the last N observations. In
our tests, we setN = 3. We modified the HPX-5 thread scheduler algorithm to check the thread
cap on every iteration of the main worker loop. If a thread is not holding any resources and the number of active workers is greater than the current thread cap, the thread goes into an idle state until signaled to resume work. If the number of active workers is less than the cap, an active worker signals an idle thread to resume working. A quiescent node of Edison draws approximately 40W, whereas a fully loaded node draws as much as 300W. We used a high power
cap of 220W and a low cap of 200W. We executed LULESH with 8000 sub-domains, nx= 64,
for 100 iterations on 334 nodes of Edison (8016 total cores).
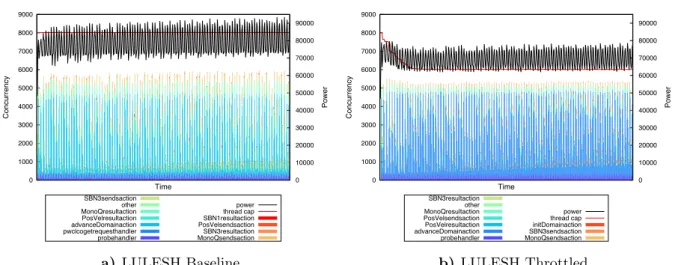
Fig. 5a shows the cumulative concurrency graph across all 334 nodes for the baseline exe-cution. The total runtime of the application is 118 seconds. The red line shows the maximum concurrency, 8000 threads (fixed). The black line shows the cumulative power draw across all 334 nodes. The power consumption has peaks around 9.3kW, about 278W per node. The aver-age power draw per node was around 236W. The total energy usaver-age was measured as 9.327MJ (megajoules). The stacked bar chart shows which tasks were executing when APEX sampled them with a 4Hz period.
Fig. 5b shows the cumulative concurrency graph across all 334 nodes for the throttled execution using the policy engine. The key difference between the two executions is that the total energy draw for the throttled execution was only 8.180MJ (approximately 12.3% less) while the execution time was not affected. The red line shows the thread cap as it is modified by the policy. The black line shows the reflected reduction in power draw with some localized fluctuations. The average power draw per node for this run was 207 W. Once the search had converged, this execution used approximately 3/4 of the number of threads, but runtime was unaffected.
0 1000 2000 3000 4000 5000 6000 7000 8000 9000 0 10000 20000 30000 40000 50000 60000 70000 80000 90000 Concurrency Power Time probehandler pwclcogetrequesthandleradvanceDomainaction PosVelresultaction MonoQresultactionother SBN3sendsaction MonoQsendsactionSBN3resultaction PosVelsendsactionSBN1resultaction thread cappower
a) LULESH Baseline
0 1000 2000 3000 4000 5000 6000 7000 8000 9000 0 10000 20000 30000 40000 50000 60000 70000 80000 90000 Concurrency Power Time probehandler advanceDomainactionPosVelresultaction PosVelsendsactionMonoQresultaction other SBN3resultaction MonoQsendsactionSBN3sendsaction initDomainactionthread cap power
b) LULESH Throttled
Figure 5. LULESH Benchmark
3.4. HPX-3 miniGhost kernel
MiniGhost [5], developed as part of the Mantevo project [14], is a finite difference miniapp simulating heat diffusion over a three-dimensional domain. The original version uses OpenMP intra-node and MPI inter-node. It has been ported to HPX-3 [2]; this version uses HPX for both intra- and inter-node parallelism. The HPX version provides better performance than the original OpenMP version.
Fig. 6 shows that there are diminishing returns from allocating additional worker threads to MiniGhost. This suggests that we can throttle the application by cutting back on the number of worker threads to reduce energy usage while avoiding substantial performance degradation.
0 20 40 60 80 100 120 140 160 180
0 5 10 15 20 25 30 35 40 45
R un ti m e (s )
HPX worker threads Minighost
Figure 6. miniGhost strong scaling
0 5 10 15 20 25 30 35 40 45 50
0 300
Concurrency
Power
Time
continuation::asynchpx_main other thread cap power
a) miniGhost Baseline. This concurrency chart shows a stacked bar chart with the periodic (1Hz) status of each thread. The max number of threads is 48 (red line), and the instantaneous power for
each sample is the black line
0 5 10 15 20 25 30 35 40 45 50
0 300
Concurrency
Power
Time
continuation::asynchpx_main other thread cap power
b) miniGhost Throttled. This concurrency chart shows a stacked bar chart with the periodic (1Hz) status of each thread. The max number of threads starts at 48, but is throttled while APEX searches for an optimal number of active threads to keep under the power cap. The evolving thread cap is the red line and the instantaneous power for each
sample is the black line
Figure 7. miniGhost Benchmark
4. Related Work
Several performance tools use measurement for the purposes of offline performance analysis, including TAU [32], HPCToolkit [1], Scalasca [38], Vampir [20], Extrae [27] and others. All are powerful and capable tools in their own right. These tools, however, were designed for offline performance analysis and tuning, focusing on first-person performance measurement of tied tasks on a per-thread (OS thread) basis. New and emerging exascale programming models present technical challenges that the designers of those measurement systems had not considered, such as untied task execution and migration, runtime thread control and execution, third-person observation, and runtime performance tuning. Also, as these tools are inescapably intrusive, they are not designed to be integrated permanently into an application for continuous performance introspection, but rather to be used in an iterative execute-analyze-tune cycle. In contrast, APEX is designed to perform asynchronous first- and third-person measurement for the sole purpose of supporting runtime introspection and performance adaptation.
One of the most active research areas in HPC is to reduce energy consumption while
main-taining and even improving performance. For example, Curtis-Maury et al. [11] demonstrated
the ability to build a runtime-adaptable optimization that both converges on the best perform-ing configuration and reduces power consumption. This result is due to the observation that some parallel applications have diminishing returns with respect to scalability, and additional
hardware merely consumes more power without improving performance. Rountree et al. [30]
demonstrate the use of dynamic voltage scaling to save energy while minimizing impact on the
performance. Their Adagioapproach attempts to scale computation and communication in
dis-tributed MPI applications using only local information acquired and applied at runtime in order
inherent variation among processors and the range of effects that placing a hard power cap has on applications with different characteristics.
With respect to runtime thread scheduling, Olivier et al. [26] demonstrated that a
hierar-chical, cache-aware thread scheduler performs better than a flat task scheduling in conjunction with load balancing (via task stealing) within cache and/or NUMA domains. While this is a form of runtime adaptation, it is an approach targeting one issue and does not react to runtime measurements, but rather uses thread affinity and memory hierarchy information at startup. Similarly, Charm++ [19, 39] has mechanisms for distributed dynamic load-balancing based on runtime information. Other researchers have used Charm++ as a platform for developing ad-ditional runtime load-balancing strategies [17] both between nodes and within a node using cache/memory hierarchical information. PICS [34] allows runtime adaptivity in Charm++ by
allowing the application to registercontrol points [12] specifying what effect application
parame-ters have on various categories of performance-effecting properties. For example, the application can register that a variable controlling the size of a subproblem will change the grain size and degree of parallelism. Based on runtime performance measurement, the system selects a property to adjust and adjusts registered control points accordingly.
The OmpSs runtime system has demonstrated the ability to schedule an appropriate kernel implementation based on available heterogeneous hardware choices [13, 28]. In this implemen-tation, DGEMM tasks are scheduled on either CPU or GPU resources depending on the input size, available hardware, and prior performance results.
The Open Tool for Parameter Optimization [8] tunes parameters exposed by the OpenMPI runtime. In OpenMPI, many runtime tasks are delegated to modules, which implement differ-ent versions of communication algorithms (such as collectives) and map MPI operations onto lower-level network operations (such as for TCP, InfiniBand, Cray Gemini/Aries, etc.). These modules expose a set of tunable parameters, called MCA parameters, as the result of which a typical installation will have several hundred. OTPO searches for parameters giving the best performance, as measured by latency or bandwidth of network operations.
The AutoTune project [24] is developing the Periscope Tuning Framework, an extension to the earlier Periscope [6] performance analysis and diagnosis tool which allows plugins to provide new functionality. PTF has been used for runtime energy tuning using DVFS and for tuning of MPI runtime parameters [25], and it has been integrated with several parallel pattern libraries to tune parameters such as how many CPU cores and acclelerators to use in heterogenous codes and what scheduling policies to use [4]. APEX differs from PTF in being more deeply integrated with runtimes and in providing tuning capabilities based on a global performance view.
Hoffman et al. [15] have developed an interface for diverse applications to report a
perfor-mance measure in a generic way so that operating systems and runtimes can adapt themselves
to optimize application performance. In their Application Heartbeats framework, applications
5. Conclusion
The quest for exascale brings fundamentally new challenges to performance and productiv-ity. The solutions that will likely usher in the exascale era will require software designers and users to embrace performance heterogeneity and variability. We believe that any successful
im-plementation will have to integrate performance introspection, in situ analysis and adaptation
in an exascale system stack. The XPRESS project has developed a prototype of APEX inte-grated with HPX-3 and HPX-5 for use in OpenX. We have demonstrated APEX with several benchmark examples, and we believe that the APEX framework is generally applicable to other X-stack runtime efforts.
There is considerable work that can be done with respect to APEX. In the short term, we would like to conduct more robust application experiments and to explore behavior larger scales on different platforms. As more applications are developed using HPX, we hope to have a greater opportunity to demonstrate the APEX capabilities for runtime adaptation. With that in mind, new applications will present more and better policy (optimization) rules, both for specific applications and to generalize them in the operating system and runtime libraries. In particular, we are interested in possible policy rules that address heterogeneous HPX-3 code that can be executed on GPGPUs, as well as many-core architectures such as the Intel Phi. We plan to develop more policy rules that specifically address the SLOWER design principles of the ParalleX model [33]. We soon will be exploring the multi-objective optimization opportunities available in the development branch of Active Harmony. With that support, we can tune with respect to both performance and energy efficiency, as well as to any other application-specific metrics. Finally, we believe that APEX has applications outside of the XPRESS project, and that it can be successfully integrated into other runtime systems and parallel execution models with controllable parameters, including OpenMP, MPI, and OmpSs. It can serve as a framework for triggering application-specific optimizations such as adaptive mesh refinement, load balancing, and other dynamic behavior.
Support for this work was provided through the X-Stack Software Research and Scien-tific Discovery through Advanced Computing (SciDAC) programs funded by the U.S. De-partment of Energy, Office of Science, Advanced Scientific Computing Research (and Basic Energy Sciences/Biological and Environmental Research/High Energy Physics/Fusion Energy Sciences/Nuclear Physics) under award numbers DE-SC0008638, DE-SC0008704, DE-FG02-11ER26050 and DE-SC0006925. Sandia National Laboratories is a multi-program laboratory managed and operated by Sandia Corporation, a wholly owned subsidiary of Lockheed Mar-tin Corporation, for the U.S. DOE’s National Nuclear Security Administration under contract DE-AC04-94AL85000. This research used resources of the National Energy Research Scientific Computing Center, a DOE Office of Science User Facility supported by the Office of Science of the U.S. Department of Energy under Contract No. DE-AC02-05CH11231.
References
1. L. Adhianto, S. Banerjee, M. Fagan, M. Krentel, G. Marin, J. Mellor-Crummey, and N. R. Tallent. Hpctoolkit: tools for performance analysis of optimized parallel programs
http://hpctoolkit.org. Concurr. Comput. : Pract. Exper., 22:685–701, April 2010. DOI:
10.1002/cpe.v22:6.
2. Vinay C Amatya. Parallel Processes in HPX: Designing an Infrastructure for Adaptive
Resource Management. PhD thesis, Louisiana State University, 2014.
3. Matthew Anderson, Maciej Brodowicz, Hartmut Kaiser, and Thomas L. Sterling. An
Ap-plication Driven Analysis of the ParalleX Execution Model. CoRR, abs/1109.5201, 2011.
http://arxiv.org/abs/1109.5201.
4. Enes Bajrovic, Siegfried Benkner, Jiri Dokulil, and Martin Sandrieser. Autotuning of
pat-tern runtimes for accelerated parallel systems. In PARCO 2013, September 2013, Munich,
Germany, September 2013.
5. Richard F Barrett, Courtenay T Vaughan, and Michael A Heroux. MiniGhost: a miniapp for exploring boundary exchange strategies using stencil computations in scientific parallel computing. Technical Report SAND2012-10431, 2011.
6. Shajulin Benedict, Ventsislav Petkov, and Michael Gerndt. Periscope: An online-based
distributed performance analysis tool. In Tools for High Performance Computing 2009,
pages 1–16. Springer. DOI: 10.1007/978-3-642-11261-4 1.
7. Ron Brightwell and Kevin Pedretti. An intra-node implementation of OpenSHMEM
us-ing virtual address space mappus-ing. In Fifth Partitioned Global Address Space Conference,
October 2011.
8. Mohamad Chaarawi, Jeffrey M. Squyres, Edgar Gabriel, and Saber Feki. A tool for
opti-mizing runtime parameters of open MPI. In Recent Advances in Parallel Virtual Machine
and Message Passing Interface, number 5205 in Lecture Notes in Computer Science, pages 210–217. Springer Berlin Heidelberg. DOI: 10.1007/978-3-540-87475-1 30.
9. Sandia Corporation. eXascale PRogramming Environment and System Software (XPRESS).
http://xstack.sandia.gov/xpress/, April 2015.
10. Cristian T¸ ˘apu¸s, I-Hsin Chung, and Jeffrey K. Hollingsworth. Active harmony: Towards
automated performance tuning. In 2002 ACM/IEEE Conference on Supercomputing, SC
’02, pages 1–11, Los Alamitos, CA, USA, 2002. IEEE Computer Society Press.
11. Matthew Curtis-Maury, James Dzierwa, Christos D. Antonopoulos, and Dimitrios S. Nikolopoulos. Online power-performance adaptation of multithreaded programs using
hard-ware event-based prediction. In 20th Annual International Conference on Supercomputing,
ICS ’06, pages 157–166, New York, NY, USA, 2006. ACM. DOI: 10.1145/1183401.1183426.
12. Isaac J Dooley. Intelligent runtime tuning of parallel applications with control points. PhD
thesis, University of Illinois at Urbana-Champaign, 2011.
13. Alejandro Duran, Eduard Ayguad´e, Rosa M. Badia, Jes¨us Labarta, Luis Martinell,
Xavier Martorell, and Judit Planas. OmpSs: A proposal for programming
heteroge-neous multi-core architectures. Parallel Processing Letters, 21(02):173–193, 2011. DOI:
10.1142/S0129626411000151.
15. Henry Hoffmann, Jonathan Eastep, Marco D. Santambrogio, Jason E. Miller, and Anant Agarwal. Application heartbeats: A generic interface for specifying program performance
and goals in autonomous computing environments. In 7th International Conference on
Autonomic Computing, ICAC ’10, pages 79–88, New York, NY, USA, 2010. ACM. DOI: 10.1145/1809049.1809065.
16. Kevin A. Huck, Allen D. Malony, Sameer Shende, and Alan Morris. TAUg: Runtime global
performance data access using MPI. In Recent Advances in Parallel Virtual Machine and
Message Passing Interface, volume 4192 ofLecture Notes in Computer Science, pages 313–
321. Springer Berlin Heidelberg, 2006. DOI: 10.1007/11846802 44.
17. E. Jeannot, E. Meneses, G. Mercier, F. Tessier, and Gengbin Zheng. Communication and
topology-aware load balancing in charm++ with treematch. In Cluster Computing
(CLUS-TER), 2013 IEEE International Conference on, pages 1–8, Sept 2013. DOI: 10.1109/CLUS-TER.2013.6702666.
18. Hartmut Kaiser, Maciej Brodowicz, and Thomas Sterling. ParalleX: An advanced
par-allel execution model for scaling-impaired applications. In Parallel Processing
Work-shops, pages 394–401, Los Alamitos, CA, USA, 2009. IEEE Computer Society. DOI:
10.1109/ICPPW.2009.14.
19. Laxmikant V. Kale and Gengbin Zheng. Charm++ and AMPI: Adaptive Runtime
Strategies via Migratable Objects. In Advanced Computational Infrastructures for
Parallel and Distributed Applications, pages 265–282. Wiley-Interscience, 2009. DOI:
10.1002/9780470558027.ch13.
20. Andreas Kn¨upfer, Holger Brunst, Jens Doleschal, Matthias Jurenz, Matthias Lieber, Holger
Mickler, Matthias S M¨uller, and Wolfgang E Nagel. The Vampir performance analysis
tool-set. In Tools for High Performance Computing, pages 139–155. Springer, 2008. DOI:
10.1007/978-3-540-68564-7 9.
21. Anirban Mandal, Rob Fowler, and Allan Porterfield. Modeling memory concurrency for
multi-socket multi-core systems. In 2010 IEEE International Symposium on Performance
Analysis of Systems and Software (ISPASS2010), pages 56–75, White Plains, NY, March 2010. IEEE. DOI: 10.1109/ispass.2010.5452064.
22. Anirban Mandal, Rob Fowler, and Allan Porterfield. System-wide introspection for
accu-rate attribution of performance bottlenecks. In Second International Workshop on
High-perfromance Infrastruture for Scalable Tools, 2012.
23. Steven J. Martin and Matthew Kappel. Cray XC30 Power Monitoring and Management.
In Cray User Group Conference Proceedings, 2014.
24. Renato Miceli, Gilles Civario, Anna Sikora, Eduardo C´esar, Michael Gerndt, Houssam Haitof, Carmen Navarrete, Siegfried Benkner, Martin Sandrieser, Laurent Morin, and Fran¸cois Bodin. AutoTune: A plugin-driven approach to the automatic tuning of
paral-lel applications. In Applied Parallel and Scientific Computing, number 7782 in Lecture
Notes in Computer Science, pages 328–342. Springer Berlin Heidelberg. DOI: 10.1007/978-3-642-36803-5 24.
25. Yury Oleynik, Robert Mijakovi´c, Isa´ıasA. Compr´es Ure˜na, Michael Firbach, and Michael
High Performance Computing 2013, pages 39–51. Springer International Publishing, 2014. DOI: 10.1007/978-3-319-08144-1 4.
26. Stephen L. Olivier, Allan K. Porterfield, Kyle B. Wheeler, and Jan F. Prins. Scheduling
task parallelism on multi-socket multicore systems. In International Workshop on Runtime
and Operating Systems for Supercomputers, ROSS ’11, pages 49–56, New York, NY, USA, 2011. ACM.
27. Vincent Pillet, Jes´us Labarta, Toni Cortes, and Sergi Girona. Paraver: A tool to visualize
and analyze parallel code. In Proceedings of WoTUG-18: Transputer and occam
Develop-ments, volume 44, pages 17–31. mar, 1995.
28. J. Planas, R.M. Badia, E. Ayguade, and J. Labarta. Self-adaptive OmpSs tasks in
het-erogeneous environments. In Parallel Distributed Processing (IPDPS), 2013 IEEE 27th
International Symposium on, pages 138–149, May 2013. DOI: 10.1109/IPDPS.2013.53.
29. Barry Rountree, Dong H Ahn, Bronis R de Supinski, David K Lowenthal, and Martin Schulz. Beyond DVFS: A first look at performance under a hardware-enforced power bound.
In Parallel and Distributed Processing Symposium Workshops & PhD Forum (IPDPSW),
pages 947–953. IEEE, 2012. DOI: 10.1109/ipdpsw.2012.116.
30. Barry Rountree, David K. Lownenthal, Bronis R. de Supinski, Martin Schulz, Vincent W. Freeh, and Tyler Bletsch. Adagio: Making dvs practical for complex hpc applications. In 23rd International Conference on Supercomputing, ICS ’09, pages 460–469, New York, NY, USA, 2009. ACM. DOI: 10.1145/1542275.1542340.
31. Sandia National Laboratories. The Kitten Lightweight Kernel.https://software.sandia.
gov/trac/kitten.
32. S. Shende and A. D. Malony. The TAU Parallel Performance System. International
Jour-nal of High Performance Computing Applications, 20(2):287–331, Summer 2006. DOI: 10.1177/1094342006064482.
33. Thomas Sterling, Daniel Kogler, Matthew Anderson, and Maciej Brodowicz. Slower: A
per-formance model for exascale computing. Supercomputing frontiers and innovations, 1(2):42–
57, 2014. DOI: 10.14529/jsfi140203.
34. Yanhua Sun, Jonathan Lifflander, and Laxmikant V. Kal´e. PICS: A
performance-analysis-based introspective control system to steer parallel applications. InInternational Workshop
on Runtime and Operating Systems for Supercomputers, ROSS ’14, pages 5:1–5:8, New York, NY, USA, 2014. ACM. DOI: 10.1145/2612262.2612266.
35. Alexandre Tabbal, Matthew Anderson, Maciej Brodowicz, Hartmut Kaiser, and Thomas Sterling. Preliminary design examination of the ParalleX system from a software and
hard-ware perspective. SIGMETRICS Performance Evaluation Review, 38:4, Mar 2011.
36. The National Energy Research Scientific Computing Center (NERSC). Edison. https:
//www.nersc.gov/users/computational-systems/edison/, April 2015.
37. Thomas Williams and Colin Kelley. Gnuplot homepage. http://www.gnuplot.info, April
2015.
Pfeifer, and Zoltan Szebenyi. Usage of the scalasca toolset for scalable performance
anal-ysis of large-scale parallel applications. In Tools for High Performance Computing, pages
157–167. Springer Berlin Heidelberg, 2008.
39. Gengbin Zheng, E. Meneses, A. Bhatele, and L.V. Kale. Hierarchical load balancing
for charm++ applications on large supercomputers. In Parallel Processing Workshops
(ICPPW), 2010 39th International Conference on, pages 436–444, Sept 2010. DOI:
10.1109/ICPPW.2010.65.