INTRODUCTION
Developing regional groundwater hydrodynamic model is not only an essential component of the quan-titative and qualitative characteristics of a groundwa-ter system, but also an essential element for production of reliable hydrogeochemical flow-path analyses. This
is of particular importance in the case of complex multi-aquifer system characteristics for Quaternary deposits in northern Poland. Part of the Białystok High Plane described in this article is a good example of such a multi-layered system.
The condition necessary for development of groundwater flow numerical model and for obtaining
Use of numerical methods for identification of
hydro-dynamic field and hydrogeochemical processes in the
Quaternary multi-aquifer system
TOMASZ GRUSZCZYŃSKI, MARZENA SZOSTAKIEWICZ-HOŁOWNIA, WŁODZIMIERZ HUMNICKI, JERZY J. MAŁECKI, DOROTA POROWSKA* and MARCIN STĘPIEŃ
Institute of Hydrogeology and Engineering Geology, Faculty of Geology, University of Warsaw, Al. Żwirki i Wigury 93, PL-02-089 Warszawa, Poland. * E-mail: [email protected]
ABSTRACT:
Gruszczyński, T., Szostakiewicz-Hołownia, M., Humnicki, W., Małecki, J.J., Porowska D. and Stępień M. 2016. Use of numerical methods for identification of hydrodynamic field and hydrogeochemical processes in the Qua-ternary multi-aquifer system. Acta Geologica Polonica, 66(3), 509–523. Warszawa.
The paper presents spatial analysis and numerical methods to describe the hydrodynamic and hydrochemical con-ditions in a groundwater system. The research was conducted in the northern part of the Białystok High Plane, eastern Poland, within a Quaternary multi-aquifer system. Spatial analysis was used for imaging the quasi-con-tinuous structure of the system based on a discrete set of hydrogeological data. A high-resolution regional flow model was used to identify the groundwater discharge and discharge zones of the individual aquifers. Calcula-tions have shown a marked asymmetry of the flow system. Deeply incised river valleys in the Niemen River basin more strongly affect the groundwater than the discharge zones in the valleys of the Vistula River basin. As a re-sult, the underground watershed in deeper aquifers is clearly shifted westward in relation to the morphological watershed. The hydrodynamic conditions of the system determined by numerical methods were used to iden-tify the points along the groundwater flow-path for the hydrochemical study. It was the basis for the identifica-tion of points located along the groundwater flow direcidentifica-tion, which were used in the hydrochemical study. Com-putational schemes of water solution models were calculated for the quasi-equilibrium state of chemical reactions between the solution and the solid and gaseous phases. Presentation of the chemical reactions allowed determining the origin of changes in the concentrations of individual components dissolved in groundwater. It was found that kaolinitization, i.e. chemical weathering of feldspars and plagioclases is the basic process that most affects the groundwater chemistry.
Key words:Quaternary multi-aquifer system; Hydrodynamic field; Hydrogeochemical processes.
510 TOMASZ GRUSZCZYŃSKIET AL.
reliable results is adoption of a proper conceptual model for the groundwater flow system. An early nu-merical model was developed by Małecka et al.(1998) within the framework of the preparation of a hydro-geological documentation to evaluate disposable groundwater resources of the Quaternary aquifer in the Krynka River basin. The model covered an area of 124 km2in the immediate vicinity of Krynki (Małecka et al.1998).
The numerical model presented in this article cov-ers an area of 319 km2and depicts the system structure and its relationship to the surrounding environment in a different way using the boundary conditions. With re-gard to the upper boundary surface, we attempted to take into account the effective infiltration distribution determined by using spatial analysis. The resulting image allowed determining recharge and discharge zones of the system, and the regional approach to the research enabled minimizing the uncertainty associated with presentation of the boundary surface of the model. Prior to the geochemical modelling a detailed ex-amination of the hydrodynamic field facilitated iden-tification of groundwater sampling points representa-tive of hydrodynamic transformations. Identification of chemical reactions allowed determining the cause of changes in the concentration of individual compo-nents dissolved in groundwater.
Quaternary multi-aquifer systems in the Polish Lowlands are usually characterised by strong hetero-geneity resulting from high facies variability in the gla-cial and interglagla-cial periods. Identification of the processes associated with the formation of groundwa-terchemical composition in such systems should take into account an analysis of the hydrodynamic field. Groundwater flow influences hydrochemical patterns because the solute transport (advection, dispersion and diffusion) carries the chemical and biological compo-nents from the recharge area and interacts with the aquifer system (Stuyfzand 1999). Generally, this prob-lem has been widely recognised, but the superposition of the hydrodynamic data and chemical reactions in de-terministic models is a difficult task, and the results of calculation are subject to considerable uncertainty.
This is due to the multi-dimensionality of the object function, unknown distribution of parameters and the associated error propagation. As a result, models com-bining the description of the hydrodynamic field and the chemical reactions are rarely used in hydrogeolog-ical practice. Researchers most often limit their studies to mass transport models that are the solution of the ad-vection-dispersion equation, which, in addition to the migration of solutes in the flow field, also involve the effect of sorption and reactions of dissolution and
biodegradation (e.g. Mao et al. 2006; Jung et al. 2009; Ma et al. 2010; Greskowiak et al. 2011; Yin et al. 2011). Other chemical reactions (e.g. radioactive decay) in this type of models are usually not taken into ac-count. Another approach is to identify the hydrody-namic field based on calculated spatial distributions of groundwater’s chemical composition (Xing et al. 2013; Somaratne and Frizenschaf 2013; Koonce et al. 2010). In such studies, spatial analyses performed in the GIS environment are increasingly more commonly used (e.g. Nur et. al. 2012). The studies also use hydrody-namic models for the identification of flow paths along which the evolution of chemical composition is analysed (Speiran 2010; Rubin et al. 2013). A similar approach was applied in the studies of the heteroge-neous multi-aquifer system in the Białystok High Plane presented herein. The research was conducted using a variety of numerical tools in a fixed sequence. The first stage involved the use of spatial analysis to iden-tify the geometry of the system, its hydrodynamic pa-rameters and input function (effective infiltration dis-tribution). The acquired spatial hydrodynamic data were used in the next stage to develop a numerical flow model. The model was calibrated based on empirical measurements of the hydraulic head and was used to identify the hydrodynamic field. This was the basis for the determination of flow path, along which the evo-lution of groundwater chemical composition was in-terpreted using the chemical equilibrium model. The aim of the study was to test the possibility of simulta-neous use of hydrodynamic models, geospatial GIS analysis and hydrochemical models to reliably identify all of the processes governing the flow and chemistry of groundwater in the complex hydrogeological system.
According to meteorological data of the Institute of Meteorology and Water Management for the period of 1970–2014, the average air temperature in this region varies between -3.6oC in January to 17.7oC in July. The amount of atmospheric precipitation varies throughout the year from the average of 34 mm in January to 86 mm in July, although episodic rainfall events range up to 90.6 mm (25-06-1985). The long-term average at-mospheric precipitation is 593 mm.
The deep basement of the area is the Mazury An-teclise of the East European Precambrian Craton. The overlying Mesozoic (Jurassic and Cretaceous) cover is represented by carbonates, sands and sandstones. The Palaeogene and Neogene are preserved only frag-mentarily, and similarly as the Mesozoic aquifers of the area, they do not represent useful aquifers. The char-acteristic feature of the study area is the lack of con-tinuous and water-abundant aquifers in the lower Pleis-tocene. Due to the low hydrogeological parameters, the underlying Cretaceous multi-aquifer system is not use-ful (Małecki et al.2004). Consequently, it has been de-cided to consider the top of low-permeability
sedi-ments (mainly glacial tills and lacustrine clays) de-posited during the southern Polish Glaciation to be the lower boundary of the model.
The stratigraphic sequence of the model is charac-terised by a complex structure that formed as a result of successive advances and retreats of the Scandina-vian ice sheet (Text-fig. 2). The relief of the area de-veloped as a result of deposition of sediments, mainly in the Upper of the Wartanian glaciations, and ero-sional processes during the late Pleistocene and Holocene. The dynamic sedimentary environment of the Pleistocene contributed to the formation of the groundwater system, which is characterised by a strong heterogeneity. The Quaternary of north-east Poland comprises generally three aquifers: near surface, in-termoraine, and basal.
However, the basal aquifer, commonly associated with the older Pleistocene sediments, has not been documented in the study area. The upper aquifer (near surface) is represented by sands, gravels and glacial boulders. The groundwater table of this unconfined aquifer follows the morphology of the terrain. This
512 TOMASZ GRUSZCZYŃSKIET AL.
aquifer is exploited by hand-dug wells whose depths range from 2 to 20 m, and the water table is at a depth of several centimetres in floodplains to more than 16 m in the upland area. The hand-dug wells that drain the upper aquifer are only an emergency source of water supply, whereas the usable aquifer is the lower, inter-moraine aquifer, that consists of several water-bearing beds remaining in a regional hydraulic connection, as evidenced by their similar hydrochemical parameters (Małecka et al. 1998). The depth to the aquifer varies between 15 and 80 m, and its average thickness is 25 m, at the hydraulic conductivity of 2.8•10-4 m/s. The intermoraine aquifer is artesian within local Late Pleis-tocene erosional structures. The water table in the Krynka Valley area ranges from 0.5 to 2.5 m above ground level (Text-fig. 2). The artesian flow rates vary from 0.11 to 2.60 m3/h in 12 out of 15 wells drilled in the Krynki area in the years 1920–1939.
MATERIALS AND METHODS
The groundwater characterisation is based on the results of archival research from the years 1973–2003 and the results of studies carried out in October 2015. Measurements of the groundwater level were made in 168 wells. The upper aquifer was examined by 65 chemical analyses from 44 different points (springs, hand-dug wells, drilled wells and piezometers), and the lower aquifer – by 25 analyses from 15 points (drilled wells, some of them with artesian flow).
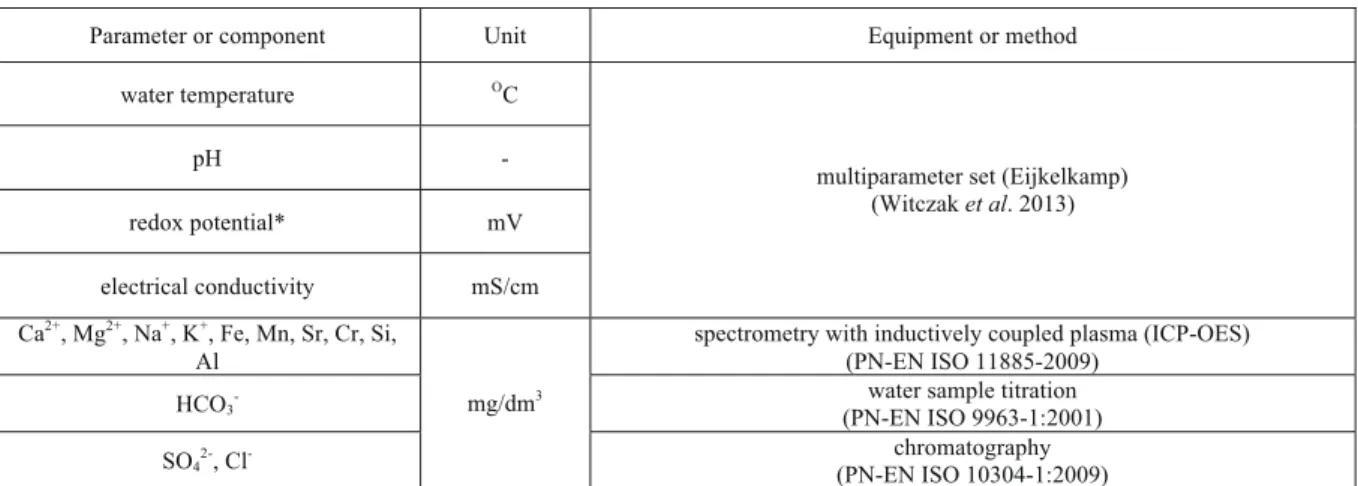
Hydrochem-ical studies carried out in 2015 included analyses of two samples from the upper aquifer and four samples from the lower aquifer. Archival analyses were per-formed at the PGI-NRI Central Chemical Laboratory in Warsaw and the Chemical Laboratory of the Faculty of Geology, University of Warsaw. The most recent analyses were carried out at Laboratoria WESSLING Polska sp. z o.o. in Kraków, in accordance with ac-credited procedures and standards. Applied field and laboratory methods are listed in Table 1. The analyti-cal error, determined based on the balance of anions and cations, did not exceed 4%.
In order to determine mineral phases of the aquifer, four samples of the Pleistocene medium-grained sands were collected for analysis using X-Ray Diffraction (XRD). The study was performed at the laboratory of the Institute of Mineralogy Geochemistry and Petrography on a powder X-ray diffractometer X’Pert PRO MPD (PANalytical BV – the Netherlands) using the Bragg-Brentano method. Analysis of results was performed us-ing X ‘Pert Plus HighScore (ver. 2.2e) software and the ICDD PDF-2 Release 2008 RDB database.
One of the basic information used in the ground-water flow model is spatial distribution of effective in-filtration (Krogulec 2010). A map of effective infiltra-tion was compiled in GIS environment using the following formula:
R=Zo*W*365*0.001 (Herbich 2008)
The map of groundwater renewable resources co-efficient (Rodzoch 2009) and the Detailed Geological Map of Poland (DGMP), map sheets of 302 Wierzch-lesie (Laskowski 2004, 2005), 303 Krynki (Wodyk 2005a, 2005b) and 341 Gródek (Kurek and Preidl 2003, 2004), were used to create the spatial distribu-tion of this parameter. Geological structure of surface deposits located on the Belarusian side has been de-scribed based on the map of Marks and Karabanov (2011) and colour images derived from Landsat 7 ETM+ satellite imaging with a pixel size of 30×30 m (Campbell and Wynne 2011). The geological map presents the surface features for which effective infil-tration index values are assigned as shown in Table 2. The maps of the spatial distribution of effective in-filtration coefficient and renewable groundwater re-sources coefficients were converted to a raster format. After superimposition of rasters the RasterCalculator tool of ESRI ArcGIS software was used to calculate the spatial distribution of the effective infiltration value, subsequently used in the hydrodynamic model.
Calculations of the hydrodynamic field were carried out by the finite difference method using the Modflow program of the Visual Modflow software package. The Δx = Δy = 50 m orthogonal discretization grid was
em-ployed for the calculations. The model space was di-vided into three layers representing two aggregated aquifers and the separating aquitard. The total number of active blocks for the adopted discretization scheme was 383,865. By using geostatistical methods, predic-tion of the top and base surfaces was made, accounting for the variable thickness of the individual layers in the calculations. The upper boundary surface was repre-sented by a digital terrain model (DTM) developed using TopoToRaster method. All procedures related to the interpolation of spatial data were carried out using the ESRI ArcGIS v. 10.2 program equipped with Spa-tial Analyst and Geostatistical Analyst extensions.
The hydrochemical model for the upper aquifer was developed using the PHREEQC program with the phreeq.dat thermodynamic database (Parkhurst and Appelo 2013). Hydrochemical model for the sec-ond aquifer has not been developed because the hy-drodynamic model showed that the time of water flow from the watershed area to the discharge zone is about 300 years, which prevents development of a reliable model on the way from the recharge zone to the dis-charge zone. Because the anthropogenic contamination in the area is minimal, only natural hydrochemical processes were modelled.
Parameter or component Unit Equipment or method
water temperature OC
pH -
redox potential* mV
electrical conductivity mS/cm
multiparameter set (Eijkelkamp) (Witczak et al. 2013)
Ca2+, Mg2+, Na+, K+, Fe, Mn, Sr, Cr, Si, Al
spectrometry with inductively coupled plasma (ICP-OES) (PN-EN ISO 11885-2009)
HCO3-
water sample titration (PN-EN ISO 9963-1:2001)
SO42-, Cl
-mg/dm3
chromatography (PN-EN ISO 10304-1:2009) * The measured Eh values were corrected for the value of reference electrode potential
Surface deposits
Relative effective infiltration index W [-] (Herbich ed. 2008, modified)
Surface waters 0
Till, sand, peat and glaciolacustrine mud 0.2
Clayey mud and mud; peaty mud; muddy soils of endorheic depressions 0.5
Deluvial sand and loam; kame sand and mud 1
Humic sand; sand, gravel and till; sand, gravel and mud, deluvial sand 1.5
Kame sand and gravel 2
Glaciofluvial sand and gravel; sand and gravel with boulders; fluvial sand 3
The input data to the hydrochemical model were the results of chemical analyses from a drilled well which is representative of the watershed area, and from a spring draining water from the discharge zone (as documented by the hydrodynamic model). The XRD determinations of mineral composition of rocks composing the aquifer were also used. The identified assemblage of minerals was supplemented with gyp-sum to control sulphates.
The processes occurring in the aquifer along the groundwater flow path from the watershed zone (a well at Szudziałowo – No. 1) to the discharge zone (the spring at Słójka – No. 2) (Text-fig. 1) were mod-elled using an inverse model that assumes a very low maximum uncertainty equal to 6% for the results of analyses from the Szudziałowo well, and 5% for the spring at Słójka. The values show that, at the time of modelling, the acceptable changes in the con-centration of each groundwater component were within a range of +/-5 or 6%. In practice, the real dif-ferences between the observed and simulated con-centrations are smaller and, in the case under study, they do not exceed 3.7%.
RESULTS AND DISCUSSION
Flow model
The numerical model of hydrodynamic field is use-ful to develop a concept of the system structure and the water flow pattern. The complex framework of the sys-tem forced the need to develop the principles of schema-tisation of hydrogeological space. It was assumed that the
aquifers could be aggregated only when a good hy-draulic connection was found, and the separating beds were discontinuous and of limited thickness. Similarly distinguished aquitards had to be characterised by a con-siderable thickness and continuity. Based on the above criteria, a schematization of the multi-aquifer system was made, which resulted in distinguishing two aggre-gated aquifers separated by an aquitard (Text-fig. 3).
The upper aquifer is represented by glaciofluvial sands of the Middle and Upper stadial of the Wartanian Glacia-tion, and by Late Pleistocene and Holocene alluvials.
The glaciofluvial deposits are commonly interlay-ered with discontinuous tills of the Middle Stadial of the Wartanian Glaciation but water-bearing layers of the stages commonly act as one aquifer. Below the glaciofluvial deposits of the Middle Stadial of the Wartanian Glaciation there is a thick continuous layer of nearly impermeable deposits. These are largely gla-cial tills and glaciolacustrine clays of the Lower Sta-dial of the Wartanian Glaciation. This bed has been documented in all deep boreholes located in the study area and immediate neighbourhood, prompting the authors to consider it as an aquitard.
Below the aquitard, the lower aquifer has been distinguished. It is represented mainly by glaciofluvial sands and gravels representing the Lower Stadial of the Wartanian Glaciation and the Odranian Glaciation. Similarly as the upper aquifer, the lower aquifer in-cludes a discontinuous and thin till bed (Odranian Glaciation). The lower aquifer is confined and char-acterised by highly permeable deposits. Locally arte-sian conditions are observed in deep erosional scours. The basal surface of the multi-aquifer system is marked by nearly impermeable kettle-hole and
glacio-514 TOMASZ GRUSZCZYŃSKIET AL.
lacustrine (ice-dam lake) deposits of the South Polish glaciations.
Text-fig. 4 shows the map of infiltration rates in the study area. The lowest infiltration values are associated with tills, peats, silts and alluvial muds, whereas the highest values are confined to sands and gravels. The mean value is 127 mm/y and represents 21% of the av-erage precipitation in the years 1970–2014.
The upper boundary surface was used to simulate the infiltration recharge. Spatial variability of the
recharge was obtained by the combination of the in-filtration function with the second-type condition (recharge variant). The RIVER-type boundary con-ditions were used for all watercourses bordering the interfluve areas. This allowed including the stream bed seepage resistance of riverbed in the calcula-tions. The RIVER conditions were also used in rep-resentation of all watercourses and major irrigation canals.
The General Head Boundary (G.H.B.) conditions were used for representation of lake reservoirs (larger ponds and small water reservoirs) and for the inflow through the northern boundary of the area. The zero-flow boundary conditions were assigned for the bottom aquifer, i.e. on top of the surface of the low perme-ability Lower Pleistocene tills and glaciolacustrine sediments, and Upper Cretaceous rocks represented mainly by marly-clayey facies. The model calibration process was carried out using averaged values of groundwater head from 168 survey points. Table 3 presents statistics of the calibration data.
TOMASZ GRUSZCZYŃSKIET AL.
516
Error pattern Value
Residual mean -0.264 m
Absolute residual mean 1.15 m
Standard error of estimate 0.11 m
Root mean squared (RMS) 1.5 m
Normalized RMS 3.33 %
Correlation coefficient 0.99
Max. residual -5.75 m
Min. residual 0.027 m
Tab. 3. Modelling errors after calibration process (n = 168)
The calibrated model allowed determining the spa-tial distribution of hydraulic head in the individual aquifers. The water table of the upper aquifer defi-nitely corresponds to the hydrographic network of the area (Text-fig. 5).
The groundwater flow direction is toward the main watercourses, whose valleys are regarded as discharge zones. Locally, the groundwater flow system is modified by the presence of minor watercourses (tributaries of the main rivers), whereby it is possible to mark out ground-water sub-basins of the first aquifer. It is striking that there is a different course of the underground watersheds
relative to the corresponding morphological watersheds. This is mainly due to the difference in the elevations of river valley bottoms in the Neman and Vistula river sys-tems. It is also striking the clear change in the eastward groundwater flow gradient near the edge of the upland area. The increase in the hydraulic gradient in this zone is associated with higher flow resistance. This is due to both the reduction in thickness of the wedging-out aquifers and the relative increase in the proportion of poorly permeable deposits in the aggregated aquifer system.
A different spatial distribution of the hydraulic
head was obtained for the lower aquifer (Text-fig. 6). The limited recharge rate of the aquifer (determined by the magnitude of percolation rate through the aquitard) in combination with high permeability of the sedi-ments result in substantially lower values of hydraulic gradient. The groundwater flow pattern follows the valleys of main rivers, while the role of their tributar-ies is strongly limited. Consequently, no clear rela-tionships between the hydrodynamic system and the morphological sub-basins are observed. In contrast, there is a clearly visible first-order underground wa-tershed, the course of which is definitely different from the corresponding pattern of the morphological watershed.
The spatial distribution of pressures in conjunction with a given distribution of permeability provided a ba-sis for the characteristics of the flow system. The cal-culated differences in the hydraulic heads in both aquifers allowed determining the extent of recharge and discharge zones of the lower aquifer. The calcu-lated differences in the pressures as well as the per-meability across the aquitard, established at the stage of model calibration, allowed for the characterisation of the water exchange between the aquifers. The high-est recharge rate of the lower aquifer is associated with the watershed zone in the upland area, whereas the highest discharge rate of the artesian aquifer
through the aquitard is related to the deeply incised Świsłocz valley.
Groundwater chemistry
The interpretation is based on 65 general analyses from the upper aquifer and 25 analyses from the lower aquifer (from the years 1974–1999) (Table 4).
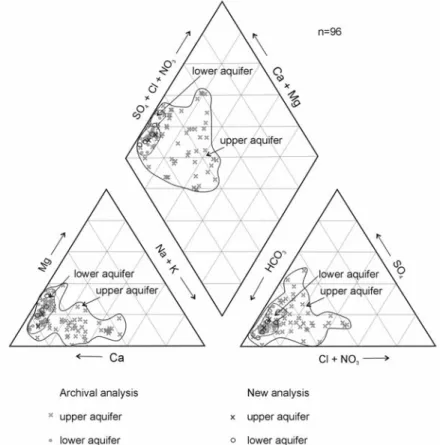
Groundwater chemical composition in the upper (shallow) and lower (deeper) aquifers is graphically de-picted on Text-fig. 7. Both Table 4 and Text-fig. 7 clearly demonstrate hydrochemical uniformity of groundwater in the lower aquifer and heterogeneity of the groundwater in the upper aquifer. We attribute this heterogeneity (higher values for electric conductivity, and higher concentrations of chlorides, sulphates, ni-trates, sodium and potassium) to anthropogenic influ-ence occurring primarily in wells located in the larger villages (Text-fig. 1).
This interpretation, together with the results of hy-drodynamic modelling, made it possible to select the fol-lowing objects for further study (September 2015): the well in Szudziałowo (No. 1), the spring in Słójka (No. 2), the well in Słójka (No. 3) and wells in Krynki (Nos. 4–6) which drain water representing chemical composition controlled by geogenic processes only (Table 5, Text-fig. 1).
TOMASZ GRUSZCZYŃSKIET AL.
518
Upper aquifer (n=65)
Lower aquifer (n=25) Component
Min. Average Max. Min. Average Max.
pH pH 6.17 7.36 8.68 6.78 7.65 8.81
Electrical conductivity µS/cm 164 709 1902 231 321 444
Total Dissolved Solids 133 589 1263 312 402 460
HCO3– 54.9 317.1 681.5 213.6 257.7 308.2
SO42– 2.0 67.2 277.7 1.0 31.4 71.2
Cl– 0.3 46.2 280.1 0.9 10.2 26.2
NO3– 0.1 7.8 54.2 0.2 2.8 14.3
Ca2+ 26.3 105.2 236.9 56.0 75.1 87.0
Mg2+ 0.1 16.7 39.4 6.3 15.7 27.0
Na+ 1.0 39.9 150.8 0.6 5.3 10.1
K+ 0.3 19.7 124.3 0.6 2.3 5.4
Fe 0.00 0.32 2.18 0.00 0.25 1.10
Mn
mg/dm3
0.00 0.07 0.24 0.00 0.04 0.24
Analysis of mineral phases composing the upper aquifer
The dominant mineral phase composing the aquifer matrix is quartz, with its content in all samples rang-ing up to 90%. All of the samples additionally contain dolomite (up to 3%), calcite (up to 1.5%), as well as
plagioclases and potassium feldspars (up to 3%). The deposits also contain amphiboles (riebeckite, magne-sioriebeckite) and phyllosilicate minerals (muscovite, biotite, clinochlore). Clay minerals of the illite and kaolinite group were found in two samples. In the XRD method the limit of detection of the individual mineral phases is variable (from a fraction of percent
Upper aquifer Lower aquifer
Component Unit
Szudzia owo well (1*)
S ójka spring
(2*)
S ójka well (3*)
Krynki well (4*)
Krynki well (5*)
Krynki well (6*)
Na+
7.8 7.4 4.2 4.2 6.2 2.2
K+ 1.3 8.0 1.1 1.2 2.1 1.0
Ca2+
93.6 107.0 83.6 72.3 78.2 64.9
Mg2+
16.5 10.9 13.7 14.6 17.9 20.0
Cl
12.6 14.5 18.6 10.4 11.2 10.3
SO4 2
- 34.8 55.7 38.4 21.2 42.7 14.0
HCO3
292.8 308.8 227.9 237.4 261.6 260.8
Fe <0.01 0.03 <0.01 <0.01 <0.01 <0.01
Mn <0.01 1.50 <0.01 <0.01 0.16 0.02
SiO2 11.1 3.0 3.6 14.1 12.8 2.6
Total Dissolved Solids
mg/dm3
460 512 388 361 420 373
Electrical conductivity µS/cm 740 772 649 590 649 582
pH pH 7.54 7.74 7.98 7.65 7.49 7.60
Redox potential mV 223 166 205 191 58 139
Hydrochemical type of water HCO3–Ca–Mg HCO3–Ca HCO3–Ca–Mg
* numbering as in Fig. 1
Text-fig. 7. Ionic composition of the groundwater
even to several percent, depending on the size of crys-tallites, their chemical composition, type, structure, etc.). It should be borne in mind that the analysed de-posits can also contain slight amounts of other miner-als, however their contribution to the chemical com-position is highly limited.
Hydrochemical modelling
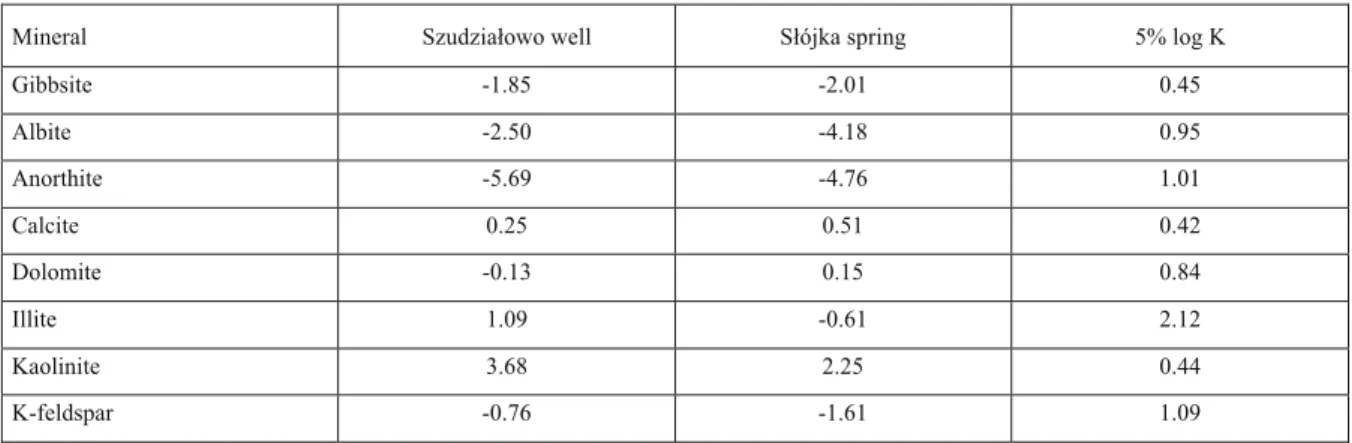
The first stage of hydrochemical modelling is the de-velopment of a general conceptual model defining the ex-pected hydrochemical processes occurring in the studied aquifer. The present model has been developed by analysing the chemistry of groundwater from a well in Szudziałowo and a spring in Słójka, the mineral compo-sition of the aquifer, and the water saturation index with respect to the minerals found in the aquifer (Table 6).
It is assumed that negative values of the ground-water saturation index with respect to a given min-eral (SI) may indicate its potential dissolution. In contrast, positive values indicate its tendency to-ward precipitation. The SI value of zero in the labo-ratory proves an equilibrium state between the liquid and the mineral phase. However, in the case of wa-ter present in the natural environment, it is assumed that the state of thermodynamic equilibrium between the mineral and the water corresponds to the SI value in the range of ± 5% log K, where K is the equilib-rium constant of reaction under given conditions (Appelo and Postma 1993; Zhu and Anderson 2002) (Table 6).
Negative values of saturation indices with respect to anorthite, albite and K-feldspars pointed to their de-composition that resulted in the formation of clay min-erals (kaolinite and illite) (formula 1). In contrast, the values of saturation indices with respect to carbonates (dolomite and calcite), especially in the recharge zone, demonstrated an equilibrium of the solution with these
minerals during its percolation through the partial sat-uration zone or through the overburden of glacial tills, outside the modelled system. This observation is in ac-cordance with the results of studies conducted by Małecki (1998) and Małecki and Matyjasik (2002) on the role of the partial saturation zone for the evolution of groundwater’s chemical composition. Thus it has been assumed that carbonates were not subjected to dissolution or precipitation during the groundwater flow from the watershed zone to the discharge zone.
6KAlSi3O8+ 4 H2O + 4 CO2→ K2Al4(Si6Al2O20)(OH4) + 12 SiO2+ 4 K++4 HCO3
-/1/ (Allen 2000)
The groundwater’s chemical composition can also be modified by ion exchange processes. The significance of these processes for changes in chemical composition of groundwater during its percolation through the first aquifer was determined based on changes in the sorp-tion complex composisorp-tion that is in equilibrium with waters sampled in the well in Szudziałowo and the spring in Słójka. The fractions of the individual ions in the sorption complex have been estimated based on the PHREEQC geochemical modelling using an implicit scheme. By analyzing the modelling results, it has been found that the fractions of the individual macrocom-ponents in the sorption complex of both survey points were similar. Calcium was dominant; magnesium was subordinate, while sodium and potassium were close to zero. This demonstrates both the stability of the com-position of the complex and the negligible significance of ion exchange processes in the analyzed aquifer char-acterized by the dominance (approximately 90%) of quartz in all fractions (Text-fig. 7).
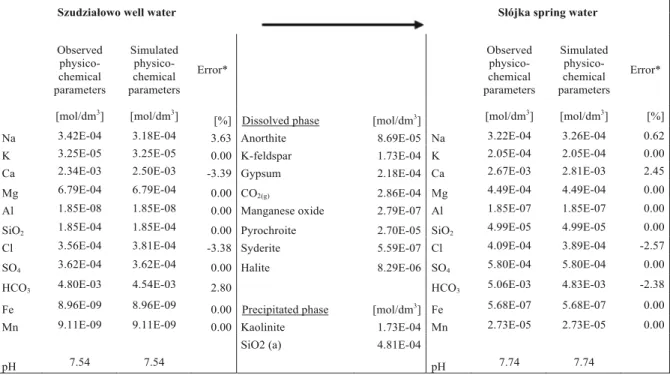
An inverse model was developed for detailed and quantitative identification of the processes occurring in the aquifer. Results of analyses of groundwater from
TOMASZ GRUSZCZYŃSKIET AL.
520
Mineral Szudzia owo well S ójka spring 5% log K
Gibbsite -1.85 -2.01 0.45
Albite -2.50 -4.18 0.95
Anorthite -5.69 -4.76 1.01
Calcite 0.25 0.51 0.42
Dolomite -0.13 0.15 0.84
Illite 1.09 -0.61 2.12
Kaolinite 3.68 2.25 0.44
K-feldspar -0.76 -1.61 1.09
*K - the equilibrium constant of reaction under given conditions
the wells drilled in Szudziałowo and from the spring at Słójka, as well as mineral and gas phases including plagioclase, potassium feldspar, amorphous silica, alu-minum hydroxides, illite, kaolinite, gypsum, halite, muscovite, carbonates (calcite, dolomite, siderite), and gaseous carbon dioxide were used as input data for the model. It was assumed that the aqueous solution is in the quasi-equilibrium state with the solid and gas phases, defined by the values of saturation index of the solution with respect to the analyzed mineral phases. The model calculations were performed based on the phreeqc.dat thermodynamic database that contains „pure“ mineral phases (with no admixtures of other chemical elements).
The model simulation confirmed the theoretical considerations. As the groundwater flowed from the recharge zone to the discharge zone, the groundwater chemistry was being modified and evolved mainly due to the hydrolysis of potassium feldspars and
cal-cium plagioclase (anorthite), resulting in the formation of kaolinite and amorphous silica. Other processes such as dissolution of gypsum or iron and manganese oxides and hydroxides, and the dissolution of carbon dioxide, were of much lesser importance (Table 8).
CONCLUSIONS
Interpretation of changes in groundwater chemical composition in multi-aquifer systems should be pre-ceded by hydrodynamic modelling.
The tested groundwater system is recharged by rainwater infiltration, distribution of which shows a spatial diversity. The lowest values of infiltration rate (up to 20 mm/year) were found in the northern part of the study area, where tills, peat and alluvial muds are exposed at the surface. In contrast, the highest values (up to 234 mm/year) are associated
Sampling point and date of analysis Component [ - ]
Szudzia owo well No. 1 September 2015
Szudzia owo well No. 1 September 1985*
S ójka spring No. 2 September 2015
CaX2 0.842 0.875 0.891
MgX2 0.154 0.125 0.094
NaX 0.003 0.003
KX 0.001 0.009
*
Ma ecki et al. (2004)
Tab. 7. The calculated equivalent of the sorption complex
Szudzia owo well water S ójka spring water
Observed physico-chemical parameters
Simulated physico-chemical parameters
Error*
Observed physico-chemical parameters
Simulated physico-chemical parameters
Error*
[mol/dm3] [mol/dm3] [%] Dissolved phase [mol/dm3
] [mol/dm3] [mol/dm3] [%]
Na 3.42E-04 3.18E-04 3.63 Anorthite 8.69E-05 Na 3.22E-04 3.26E-04 0.62
K 3.25E-05 3.25E-05 0.00 K-feldspar 1.73E-04 K 2.05E-04 2.05E-04 0.00
Ca 2.34E-03 2.50E-03 -3.39 Gypsum 2.18E-04 Ca 2.67E-03 2.81E-03 2.45
Mg 6.79E-04 6.79E-04 0.00 CO2(g) 2.86E-04 Mg 4.49E-04 4.49E-04 0.00
Al 1.85E-08 1.85E-08 0.00 Manganese oxide 2.79E-07 Al 1.85E-07 1.85E-07 0.00
SiO2 1.85E-04 1.85E-04 0.00 Pyrochroite 2.70E-05 SiO2 4.99E-05 4.99E-05 0.00
Cl 3.56E-04 3.81E-04 -3.38 Syderite 5.59E-07 Cl 4.09E-04 3.89E-04 -2.57
SO4 3.62E-04 3.62E-04 0.00 Halite 8.29E-06 SO4 5.80E-04 5.80E-04 0.00
HCO3 4.80E-03 4.54E-03 2.80 HCO3 5.06E-03 4.83E-03 -2.38
Fe 8.96E-09 8.96E-09 0.00 Precipitated phase [mol/dm3] Fe 5.68E-07 5.68E-07 0.00
Mn 9.11E-09 9.11E-09 0.00 Kaolinite 1.73E-04 Mn 2.73E-05 2.73E-05 0.00
SiO2 (a) 4.81E-04
pH 7.54 7.54 pH 7.74 7.74
*Calculated as (observed data-simulated data)/(observed data+simulated data) 100%
with the occurrence of sands and gravels in the south-ern part of the area.
The calculated groundwater table of the upper aquifer follows the hydrographic network and the mor-phology of the terrain. The lower aquifer is charac-terised by a different distribution of its hydraulic head, referring to the valleys of major rivers. It shows no clear relationships between the potentiometric surface position and the morphology of the terrain.
The upper aquifer shows a significant variability of hydrochemical types of water, resulting from the vari-able contents of chloride, sulphate and sodium ions, while the chemical composition of water of the lower aquifer is less diversified.
The water chemistry of the upper aquifer has been modified primarily by the hydrolysis of potassium feldspars and plagioclases. The mineral composition of the aquifer was characterised by the dominance of quartz in all fractions and caused the limited signifi-cance of sorption processes for the evolution of the chemistry of this aquifer. This was confirmed by the re-sults of hydrochemical modelling using an implicit scheme.
Acknowledgements
The authors are grateful to Professors Yoram Eckstein and Andrzej J. Witkowski, the journal reviewers, for all their suggestions that greatly improved the final version of this paper. The research has been supported by the Faculty of Geology of the University of Warsaw.
REFERENCES
Allen P.A. 2000. Earth Surface Processes. National Scientific Publishers PWN; Warsaw.
Appelo, C.A.J. and Postma, D. 1993. Geochemistry ground-water and pollution. Brookfield; Rotterdam, 1–536. Campbell, J.B., Wynne, R.H. 2011. Introduction to Remote
Sensing, 683 p. The Guilford Press; New York. [Fifth Edition]
Czekaj, J., Jakóbczyk-Karpierz, S., Rubin, H., Sitek, S. and Witkowski, A.J. (in press). Identification of nitrate sources in groundwater and potential impact on drinking water reservoir (Goczałkowice reservoir, Poland),
Physics and Chemistry of the Earth, http://dx.doi.org/ 10.1016/j.pce.2015.11.005
Greskowiak, J., Hay, M.B., Prommer, H., Liu, C., Post, V.E.A., Ma, R., Davis, J.A., Zheng, C. and Zachara, J. M. 2011. Simulating adsorption of U(VI) under transient ground-water flow and hydrochemistry: Physical versus chemical
nonequilibrium model, Water Resources Research, 47, W08501, doi:10.1029/2010WR010118. 14 pp.
Herbich, P. (Ed.). 2008. Wskazania metodyczne do opra-cowania warstw informacyjnych bazy danych GIS Mapy hydrogeologicznej Polski 1:50 000 „Pierwszy poziom wodonośny – wrażliwość na zanieczyszczenie i jakość wód”. PIG-PIB. Warszawa.
Jung, H.B., Charette, M.A. and Zheng, Y. 2009. A field, lab-oratory and modeling study of reactive transport of groundwater arsenic in a coastal aquifer, Environmental Science and Technology. 43, 5333–5338.
Krogulec, E. 2010. Evaluation of infiltration rates within the Vistula River valley, central Poland. Acta Geologica Polonica, 60, 617–628.
Kurek, S. and Preidl, M. 2003. Explanation for Detailed Geological Map of Poland 1 : 50 000 - sheet Gródek, Ed. PGI-NRI, Warsaw. 1–47.
Kurek, S. and Preidl, M. 2004. Detailed Geological Map of Poland 1 : 50 000 - sheet Gródek, Ed. PGI-NRI, War-saw.
Koonce, J.E., Yu, Z., Farnham, I.M., and Stetzenbach, K.J. 2006. Geochemical interpretation of groundwater flow in the southern Great Basin. Geosphere,2, 88–101 Laskowski, K. 2004. Explanation for Detailed Geological
Map of Poland 1 : 50 000 - sheet Wierzchlesie, Ed. PGI-NRI, Warsaw. 1–29.
Laskowski, K. 2005. Detailed Geological Map of Poland 1 : 50 000 - sheet Wierzchlesie, Ed. PGI-NRI, Warsaw. Ma, R., Zheng, C., Prommer, H., Greskowiak, J., Liu, C.,
Zachara, J. and Rockhold, M. 2010. A field-scale reac-tive transport model for U(VI) migration influenced by coupled multirate mass transfer and surface complexa-tion reaccomplexa-tions, Water Resources Research, 46, W05509, doi:10.1029/2009WR008168. 17pp.
Małecka D., Małecki J.J. and Michalak J. 1998. Dokumen-tacja hydrogeologiczna ustalenia dyspozycyjnych za-sobów wód podziemnych czwartorzędowego piętra wodonośnego zlewni rzeki Krynki, Archiwum Wydz. Geol. UW, Warszawa, 1–62.
Małecki, J.J. and Matyjasik, M. 2002. Vadose zone – chal-lenges in hydrochemistry. Acta Geologica Polonica.52, 440–458.
Małecki, J.J. 1995. Role of the zone of aeration in the for-mation of groundwater chemical composition. Geolog-ical Quarterly, 39, 439–448.
Małecki, J.J., Małecka, D. and Porowska, D. 2004. Hydro-geological Map of Poland 1 : 50 000 - sheet Wierzchle-sie, Ed. PGI-NRI, Warsaw.
Małecki, J.J. 1998. Role of the aeration zone in forming chemical composition of shallow ground waters, based on cases of selected hydrogeochemical environments, Bi-uletyn Państwowego Instytutu Geologicznego, 381, 1– 219. [In Polish]
TOMASZ GRUSZCZYŃSKIET AL.
Mao, X., Prommer, H., Barry, D.A., Langevin, C.D., Pan-teleit, B. and Li, L. 2006. Three-dimensional model for multi-component reactive transport with variable density groundwater flow, Environmental Modelling & Soft-ware, 21, 615–628.
Marks, L. and Karabanov A. (Ed.) 2011. Mapa geologiczna północnej części obszaru przygranicznego Polski i Bi-ałorusi. 1 : 250 000. PIG-PIB. Warszawa.
Nur, A., Jackson, M.I., Solomon, N.Y. 2012. Groundwater Flow Patterns and Hydrochemical Facies Distribution Using Geographical Information System (GIS) in Damaturu, Northeast Nigeria. International Journal of Geosciences, 3, 1096–1106.
Parkhurst, D.L. and Appelo, C.A.J. 2013. Description of In-put and Examples for PHREEQC Version 3–A ComIn-puter Program for Speciation. Batch-Reaction. One-Dimen-sional Transport. and Inverse Geochemical Calculations U.S. Geological Survey Techniques and Methods. book 6. chap. A43. 497 p. available only at http://pubs.usgs. gov/tm/06/a43/.
PN-EN ISO 10304-1:2009. Jakość wody. Oznaczanie roz-puszczonych anionów za pomocą chromatografii jonowej. Część 1: Oznaczanie bromków, chlorków, fluorków, azotanów, azotynów, fosforanów i siar-czanów.
PN-EN ISO 11885-2009. Jakość wody. Oznaczanie wybranych pierwiastków metodą optycznej spektrometrii emisyjnej z plazmą wzbudzoną indukcyjnie (ICP-OES). PN-EN ISO 9963-1:2001. Jakość wody. Oznaczanie zasad-owości. Część 1: Oznaczanie zasadowości ogólnej i za-sadowości wobec fenoloftaleiny.
Rodzoch, A. 2009. Map of groundwater renewable resources coefficient of the first aquifer, 1 : 800 000. “HYDRO-EKO”, Warsaw.
Rubin, H., Rubin, K., Witkowski, A.J. and Wróbel, J. 2013. Assessment of the impact of Zinc Smelter “Miasteczko Śląskie” on groundwater quality of the Triassic
carbon-ate aquifer within Lubliniec–Myszków Major Ground-water Basin. Biuletyn Państwowego Instytutu Geolog-icznego, 456, 525–531. [In Polish]
Somaratne, N. and Frizenschaf, J. 2013. Geological Control upon Groundwater Flow and Major Ion Chemistry with Influence on Basin Management in a Coastal Aquifer, South Australia. Journal of Water Resource and Protec-tion, 5, 1170–1177.
Speiran, G.K. 2010. Effects of groundwater-flow paths on ni-trate concentrations across two Riparian Forest Corri-dors. Journal of the American Water Resources Associ-ation, 46, 246–260.
Stuyfzand, P.J. 1999. Patterns in groundwater chemistry re-sulting from groundwater flow. Hydrogeology Journal,
7, 15–27.
Witczak, S., Kania, J. and Kmiecik, E. 2013. Katalog wybranych fizycznych i chemicznych wskaźników zanieczyszczeń wód podziemnych i metod ich oznaczania. Institute of Environmental Protection, Warsaw, 1–717. Wodyk, K. 2005a. Detailed Geological Map of Poland
1 : 50 000 - sheet Krynki, Ed. PGI-NRI, Warsaw. Wodyk, K. 2005b. Explanation for Detailed Geological Map
of Poland 1 : 50 000 - sheet Krynki, Ed. PGI-NRI, War-saw. 1–36.
Xing, L., Guo, H. and Zhan, Y. 2013. Groundwater hydro-chemical characteristics and processes along flow paths in the North China Plain. Journal of Asian Earth Sci-ences, 70-71, 250–264.
Yin, J, Haggerty, R., Stoliker, D.L., Kent, D.B., Istok, J.D., Greskowiak, J. and Zachara J.M. 2011. Transient ground-water chemistry near a river: Effects on U(VI) transport in laboratory column experiments, Water Resources
Re-search, 47, W04502, doi:10.1029/2010WR009369.
11pp.
Zhu, Ch. and Anderson, G. 2002. Environmental Applica-tions of Geochemical Modeling. Cambrige University Press. Cambrige University Press. 1–284.
Manuscript submitted: 20thMarch 2016