IMAGE ANALYSIS CHARACTERIZATION OF HIGHLY ORIENTED
FREEZE-DRYING POROUS MATERIALS
S
ILVIAB
LACHER1,3, V
ÉRONIQUEM
AQUET2,3, R
OBERTJ
ÉRÔME2,3 ANDJ
EANP
AULP
IRARD11
Department of Chemical Engineering, 2Center for Education and Research on Macromolecules, 3Interfacultary Center for Biomaterials, University of Liège, Sart-Tilman, B6, 4000 Liège, Belgium
e-mail: [email protected]
(Accepted February 15, 2002)
ABSTRACT
Image analysis has been used as a potential tool for the characterization of the texture of ultramacroporous foams prepared by freeze-drying. It has been shown that this technique actually provides valuable information on the structure of this kind of material. Image analysis of SEM micrographs of transverse sections at two different magnifications gave information on both the macroporosity (10 µm < width < 100 µm) and ultramacroporosity (width > 100 µm). Moreover, the foam anisotropy has been determined by image analysis of longitudinal sections.
Keywords: foams, freeze-drying, image analysis, porous polymer.
INTRODUCTION
Porous polymer scaffolds are promising materials for tissue engineering because they offer a temporary environment for cell seeding and subsequent transplantation into the host (Maquet et al., 1997). The porosity and structure of these scaffolds are key characteristics for the success of this strategy. Pores larger than 10 µm are essential for sustaining cell infiltration, whereas a pore smaller than 10 µm contribute to cell attachment and create a large surface area for the growth of tissue layers. Some of us have shown that highly oriented porous scaffolds have a great potential as temporary implants for supporting axonal regeneration in case of lesioned rat sciatic nerve (Maquet et al., 2000) and spinal cord (Maquet
et al., 2001). Mercury porosimetry is currently used to measure pore volume and pore size distribution of porous biomaterials. However, this technique is limited to pore size in the 7.5 nm - 75 µm range, and shrinkage of the sample due to mercury penetration under high pressure can lead to incorrect pore size distribution. In this study, image analysis is presented as a non-destructive method for the texture
implemented to investigate the influence of the cooling rate on the pore size distribution and pore morphology.
MATERIALS AND METHODS
BLACHER S ET AL: Image analyse of porous materials
1024 × 1024 pixels with 256 gray levels. Five images of different areas of the same sample were analyzed.
RESULTS AND DISCUSSION
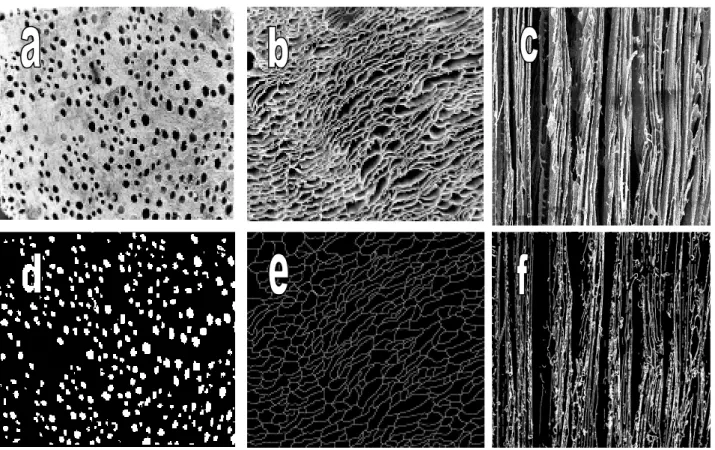
Typical SEM micrographs of transverse and longitudinal sections for PCLA foams are shown in Figs. 1a-c. From the transverse sections, two levels of porosity can be observed: ultramacropores with diameter ≥ 100 µm and macropores (10 - 20 µm). Gray level image transformations and binary image processing of both transverse and longitudinal sections are schematized in Fig. 2.
It must be noted that most of these transformations are parameter dependent. As a rule, if all the images are digitized under the same conditions, parameters are fixed once and for all, and the image binary processing is then completely automatic. In this study, the processing parameters have been changed for each set of images, because of brightness and contrast variations. However, this approach could be refined using a less parameter dependent segmentation strategy based, for example, on the extraction of minima rather than on the use of thresholds. Figs. 1d-f illustrate the result o1d-f 1d-filtering and binary image processing. Binary images illustrated in Figs. 1e and 1f take only the pore boundaries into account.
Original Image
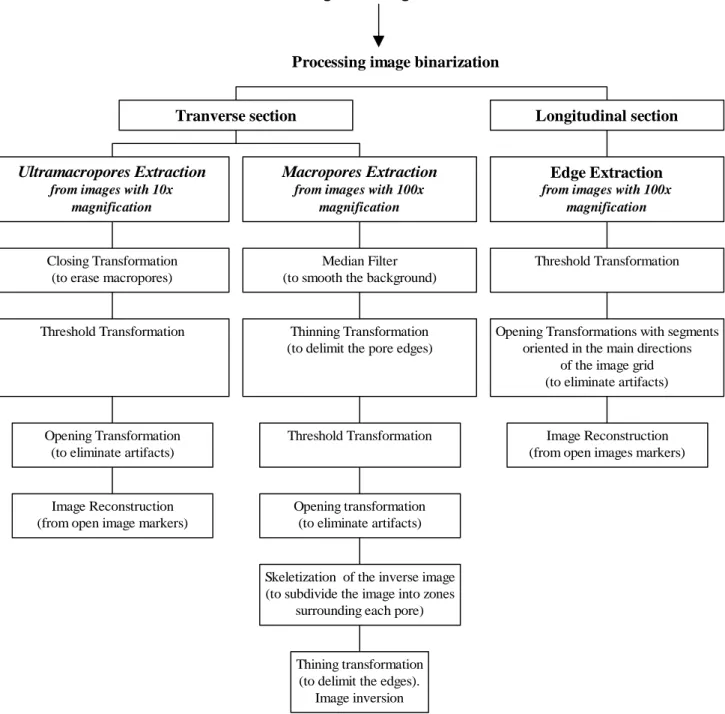
Fig. 2. Processing image binarization scheme to extract ultramacropores, macropores and pore orientations.
From transverse section images with a 10× magnification, the following characteristic sizes have been calculated: (a) the ultramacropore density δM =
Number of pixels characteristic of the ultramacropores/ Number of pixels of the whole image, (b) the equivalent circular diameter of the ultramacropores
underscored by the covariance function C(x,λ)(Serra, 1982; Coster et al., 1985).
From transverse section images recorded with a 100× magnification, three characteristic sizes have been determined: (a) the macropore density δm = Number
Processing image binarization
Image Reconstruction (from open image markers)
Opening Transformation (to eliminate artifacts) Threshold Transformation
Closing Transformation (to erase macropores)
Ultramacropores Extraction
from images with 10x magnification
Thining transformation (to delimit the edges).
Image inversion Skeletization of the inverse image (to subdivide the image into zones
surrounding each pore) Opening transformation (to eliminate artifacts) Threshold Transformation
Thinning Transformation (to delimit the pore edges)
Median Filter (to smooth the background)
Macropores Extraction
from images with 100x magnification
Tranverse section
Image Reconstruction (from open images markers) Opening Transformations with segments
oriented in the main directions of the image grid (to eliminate artifacts) Threshold Transformation
Edge Extraction
from images with 100x magnification
BLACHER S ET AL: Image analyse of porous materials
From longitudinal section images recorded with a 100× magnification, the rose of directions (Serra, 1982; Coster et al., 1985) has been used to characterize the pore orientations.
Mean values and standard deviations for δM ,D,
λ, δm , A, and C are reported in Table 1 for PCLA
foams prepared at the two considered cooling rates. The third (sk) and the fourth (k) moments of the D and A distributions were also calculated.
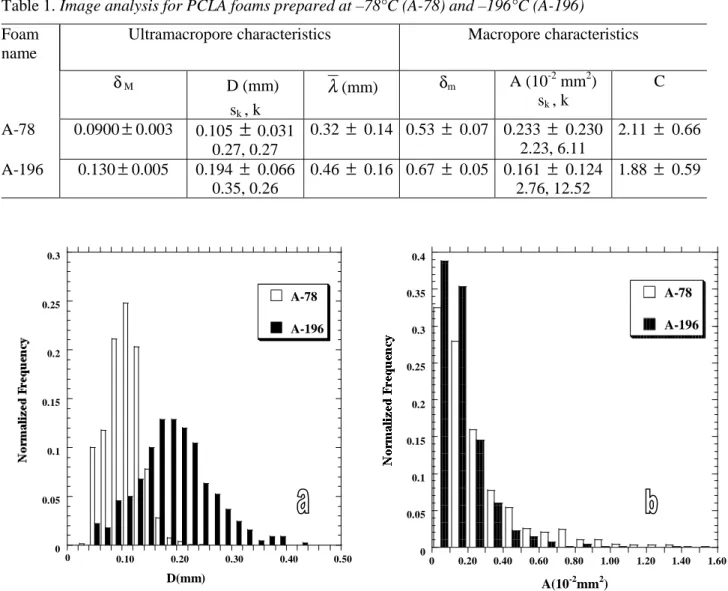
Table 1 shows that the density, mean diameter and average interdistance of the ultramacropores increase with the cooling rate. Whatever of the cooling rate is, the diameter distribution of the ultramacropores follows an almost gaussian law (low values of sk and k) (see Fig. 3a). However, the maximum of the D distribution shifts to larger diameter when the freezing temperature was increased. Comparison of the ultra- and macropore density (δM
and δm in Table 1) shows that the macropores
essentially contribute to the foam porosity. The macropore area obeys a log-normal distribution (Fig. 3b). Upon increasing the freezing temperature, the A size distribution becomes more asymmetric and broader and the mean value of A decreases. The macropore factor shape decreases when the cooling rate is increased indicating that macropores formed at higher cooling rate are more circular.
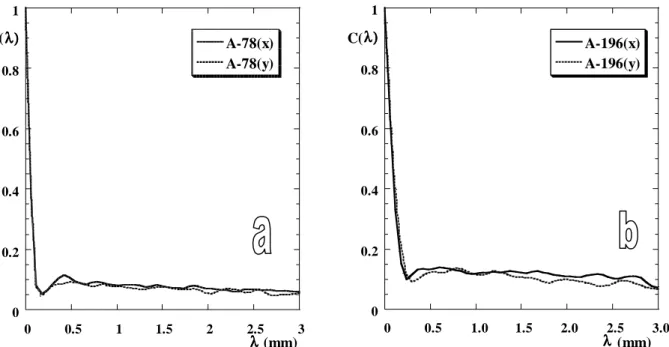
In order to study the state of distribution of the ultramacropores, the covariance function has been calculated (Figs. 4a-b). For both PCLA foams prepared at -78°C and -196°C, the covariance function in the two directions x, y does not show any significant difference. Moreover, at long distances, all curves show very damped oscillations, indicating an isotrope and almost homogeneous distribution of the ultramacropores in the polymer foam. The first local maximum at about 0.4 mm corresponds to the most frequent distance between two ultramacropores.
Table 1. Image analysis for PCLA foams prepared at –78°C (A-78) and –196°C (A-196)
Ultramacropore characteristics Macropore characteristics Foam
name
δ M D (mm)
sk , k
λ
(mm) δm A (10-2
mm2) sk , k
C
A-78 0.0900
±
0.003 0.105±
0.031 0.27, 0.270.32
±
0.14 0.53±
0.07 0.233±
0.230 2.23, 6.112.11
±
0.66A-196 0.130
±
0.005 0.194±
0.066 0.35, 0.260.46
±
0.16 0.67±
0.05 0.161±
0.124 2.76, 12.521.88
±
0.59Fig. 3. (a) Diameter distribution of the ultramacropores and (b) area size distribution of the macropores.
0 0.05 0.1 0.15 0.2 0.25 0.3 0.35 0.4
0 0.20 0.40 0.60 0.80 1.00 1.20 1.40 1.60 A-78
A-196
A(10-2mm2) 0 0.05 0.1 0.15 0.2 0.25 0.3
0.10 0.20 0.30 0.40 0.50
A-78
A-196
Fig. 4. Covariance function of the ultramacroporous structure, for PCLA foams prepared at 78°C (a) and -196°C (b).
Fig. 5. Rose of directions from the longitudinal section of PCLA foams.
Fig. 5 shows the rose of directions calculated from the longitudinal sections of PCLA foams prepared at –78°C and 196°C. For the two different
CONCLUSION
0 0.2 0.4 0.6 0.8 1
0 0.5 1 1.5 2 2.5 3
A-78(x) A-78(y) C(
λλλλ λ)
λ) λ) λ)
(mm)
0 0.2 0.4 0.6 0.8 1
0 0.5 1.0 1.5 2.0 2.5 3.0
A-196(x) A-196(y) C(
λλλλ λ)
λ) λ) λ)
BLACHER S ET AL: Image analyse of porous materials
conditions and has the advantage to be non-destructive for the pore structure. SEM images of longitudinal and transverse sections have been recorded at different magnifications. The relation between the ultramacropore and macropore size and morphology was found to be dependent on the processing parameters. Indeed, the ultramacropore size and density increase with the cooling rate, whereas the macropores become smaller and more circular. The ultramacropore distribution within the macroporous matrix is homogeneous whatever the cooling rate. A key parameter for polymer scaffold is the pore orientation, which is firstly studied in this domain. For PCLA porous foams, the higher the cooling rate, the larger the pore anisotropy.
REFERENCES
Blacher S, Maquet V, Pirard R, Pirard J-P, Jérôme R (2001). Image analysis, impedance spectroscopy and mercury porosimetry characterisation of freeze-drying porous materials. Colloids and Surfaces A: Physicochemical and Engineering Aspects 187-188:375-83.
Coster M, Chermant JL (1985). Précis d’analyse d’images. Paris: CNRS.
Maquet V, Blacher S, Pirard J-P, Jérôme R (2000). Characterization of porous polylactide foams by image analysis and impedance spectroscopy. Langmuir 16:10463-70.
Maquet V, Jérôme R (1997). Design of Macroporous Biodegradable Polymer Scaffolds for Cell Transplantation In: Porous Materials for Tissue Engineering, Vol. 250. Uetikon-Zuerich: Trans Tech Publications Ltd, 15-42.
Maquet V, Martin D, Malgrange B, Franzen R, Schoenen J, Moonen G, Jérôme R (2000). Peripheral nerve regeneration using bioresorbable macroporous polylactide scaffolds. J Biomed Mat Res 52:639-51. Maquet V, Martin D, Scholtes F, Franzen R, Schoenen J,
Moonen G, Jérôme R (2001). Poly(D,L-lactide) foams modified by poly(ethylene oxide)-block-poly(D,L-lactide) copolymers and a-FGF: in vitro and in vivo evaluation for spinal cord regeneration. Biomaterials 22:1137-46.