NAFLD IN WISTAR RATS AFTER FRUCTOSE CONSUMPTION
-ULTRASOUND, BIOCHEMICAL AND HISTOLOGICAL CHANGES
SANDEVA GERGANA1*, SANDEVA ROSITSA1, TSONEVA VANYA2, NANCHEVA-KOLEVA KRASIMIRA2, GULUBOVA MAYA1 1Trakia University, Stara Zagora, Bulgaria 2University Hospital, Stara Zagora, Bulgaria
Keywords: NAFLD, metabolic syndrome, fructose, Wistar rats
ABSTRACT
The aim of the study was to model hepatic steatosis as a manifestation of metabolic syndrome in male Wistar rats after an 8-week administration of 15% fructose. Ultrasonographic evaluation of the experimental group showed evidence of non-alcoholic fatty liver disease (NAFLD). Alanine aminotransferase (ALT), aspartate aminotransferase (AST) and uric acid were significantly elevated in sera from the treated rats. Histological examination found development of hepatic steatosis in rats of the fructose group compared with controls. The current study showed the risk associated with fructose overconsumption in food and beverages for the development of metabolic syndrome and related fatty liver disease, gout, type 2 diabetes, arterial hypertension and other disorders.
INTRODUCTION
Successful treatment of chronic viral hepatitis and the pandemic of obesity and type 2 diabetes lead to the current unfortunate result that NAFLD became a leading cause for chronic liver disorder in humans (Vanni et al., 2010; Weston et al., 2005). As a hepatic manifestation of metabolic syndrome liver steatosis leads to non-alcoholic steatohepatitis (NASH) with or without cirrhosis and hepatocellular carcinoma (Farrell and Larter,2006).
Overconsumption of fructose (HFCS - high fructose corn syrup, in Bulgaria used under the name glucose-fructose syrup) instead of sucrose in recent decades also contributed for the increased incidence of metabolic syndrome and type 2 diabetes. The abuse of this sweetener through consumption of highly processed foods and beverages causes inflammation in the liver resulting in development of NAFLD (Bray et al., 2004; Bocarsly et al., 2010; Tappy and Le, 2010; Stanhope et al., 2008; Stanhope et al., 2009).
NAFLD pathogenesis was initially proposed by Day and James (1998). Insulin resistance causes lipid accumulation in hepatocytes and leads to development of fatty liver. Oxidative stress, lipid oxidation, and chronic inflammation result in NASH. Fatty liver develops when de novo synthesis exceeds the oxidation and re-secretion of triglycerides through several mechanisms (Fujita et al., 2009; Musso et al., 2009; Schwarz et al., 2003):
Increased free fatty acids (FFA) supply due to increased lipolysis from both visceral/subcutaneous adipose tissue as a result of IR;
Increased intake of dietary fat sources of FFA;
Increased de novo lipogenesis;
Alteration in the synthesis or secretion of lipoproteins and reduction in mitochondrial fatty acids (FA) β-oxidation.
track ultrasound, biochemical and histological changes.
MATERIALS AND METHODS
Fourteen male Wistar rats initially weighing circa 250 g were studied for 8 weeks. The control group C (n = 7) received drinking water and standard rodent chow. The experimental (fructose) group F (n = 7) received solution of 15% fructose in drinking water and the same food ad libitum. The rats were kept in the accredited Vivarium at the Medical Faculty, Trakia University at 25±1°C with a photoperiod light/dark of 12/12 hours and free access to water and food. The containers with water and 15% fructose solution were supplemented every two days, once a week the amount consumed by both groups was calculated and the average intake of fructose in g/100 g body weight per day for the experimental group was determined. All animals’ weight was measured at the start of the experiment and at the end of each week. At the beginning and the end of the experimental period the length of the rats (distance nose-anus) was measured and the Lee Index was calculated. Lee Index in rats is equivalent to the body mass index (BMI) in humans.
Lee Index= 3√body weight (g)/length (cm) × 1000
The experiment was conducted in compliance with the requirements of national legislation and the European Directive 2010/63/EU on the protection of animals used for scientific purposes.
In sera from venous blood collected from the tail vein at the beginning and from the abdominal aorta at the end of the experimental period glucose, lipid parameters (triglycerides, total cholesterol, HDL and LDL cholesterol), and levels of uric acid, alanine aminotransferase (ALT), aspartate aminotransferase (AST) and gamma-glutamyl transpeptidase (GGT) were examined using an automatic analyzer Mindray BS300. The results were analyzed by Student's t-test on Statsoft Statistica v.8.
During the seventh week ultrasound on the liver of animals was performed after anesthesia with ketamine and xylazine. The study was conducted with ultrasound equipment Diagnostic Ultrasound System (model DC-6V Shenzhen Mindray Bio-medical, Electronics Co, Ltd, China).
At the end of the experiment the rats were euthanized with a lethal dose of the same anesthetics. Depots of retroperitoneal, mesenteric (visceral) and subcutaneous adipose tissue of the back were removed and measured in mg/100 g body weight. The liver weight was measured and liver-to-body weight ratio in grams was calculated. Histological samples from the livers stained with haematoxylin-eosin were prepared and observed under a microscope Leica DM 2500 Microsystems at x200 magnification.
RESULTS AND DISCUSSIONS
Figure 1. Mean body weight (g) of fructose-fed and control rats
Bocarsly et al. (2010), Martines et al. (2010), and Lindqvist et al. (2008) found similar changes in body weight and liver weight/body weight in fructose-fed rats. According to Теff et al. (2004) a cause for these changes could be the reduction of plasma insulin and leptin and the elevation of ghrelin due to fructose consumption thus increasing long-term caloric intake. No change in circulating ghrelin was observed after food intake in obese people, whereas in lean individuals it decreased by 40% half an hour after a meal. Therefore the continuous postprandial ghrelin secretion in obese individuals leads to increased food intake.
Table 1 shows mean levels of some biochemical and morphological parameters of the fructose-fed group of rats compared with controls. Significant difference was found in the mesenteric fat depot weight (mg/100g bw). No differences were observed between the two groups in retroperitoneal and subcutaneous posterior fat depot weight. An increase in visceral fat depots in fructose-fed rats found Stanhope et al. (2008).
The Lee index in fructose rats compared with controls showed no significant changes (p = 0.0503). This was probably due to the greater length of the rats from the fructose group at the end of the experiment, as suggested by other researchers (Cinti,
2005). Liver weight/body weight ratio of the fructose group was significantly higher than the control group.
Table 1.
Biochemical and morphological parameters (mean values and SD) of fructose-fed and control rats
Group Parameter
Control (C) Fructose (F)
Mean SD Mean SD
Serum glucose (mM) 5.43 0.75 9.79* 2.48
Serum total cholesterol (mM) 1.75 0.12 2.1 0.42
Serum HDL-cholesterol (mM) 0.5 0.08 0.39* 0.05
Serum LDL-cholesterol (mM) 0.73 0.07 0.85* 0.04
250 300 350 400
Week 0 Week 1 Week 2 Week 3 Week 4 Week 5 Week 6 Week 7 Week 8
Fructose
* significant difference vs. controls (p < 0.05)
Serum glucose, triglycerides, and LDL cholesterol of the fructose-fed rats were also significantly elevated compared with the control group, while HDL cholesterol was significantly lower. Such changes in the lipid profile at 4-week administration of 60% fructose in 3-month-old male Wistar rats established De Moura et al. (2009). Increased de novo lipogenesis in the liver leads to enlargement of visceral fat tissue and worsened plasma lipid profile, hence increased atherogenic risk and lipotoxicity.
Table 1 shows that significant elevation compared with the control group was found also for uric acid and liver transaminases (AST, ALT), but not for GGT. Increased uric acid is considered a minor criterion in the definition of metabolic syndrome and explains the higher incidence of gout, renal calculosis and type 2 diabetes in those patients due to the creation of pre-receptor insulin resistance. Uric acid inhibits the synthesis of the vasodilator nitric oxide and of the enzyme nitric oxide synthase, decreases blood flow and is considered one of the causes for fructose-induced hypertension. According to Douard and Ferraris (2013) expression of the glucose transporter protein (GLUT 5), increased intestinal salt reabsorption and reduced renal salt excretion all contribute to this type of hypertension. Brown et al. (2008) reported significantly increased blood pressure, heart rate, and cardiac output in healthy young volunteers after ingestion of fructose-sweetened drink.
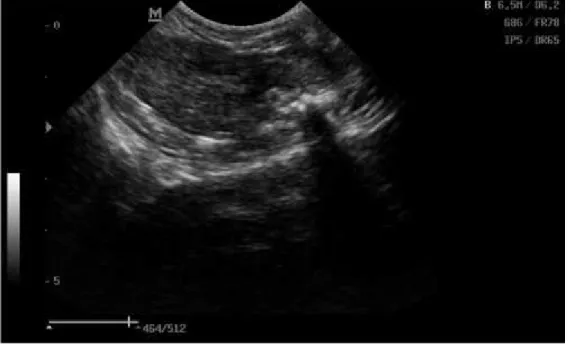
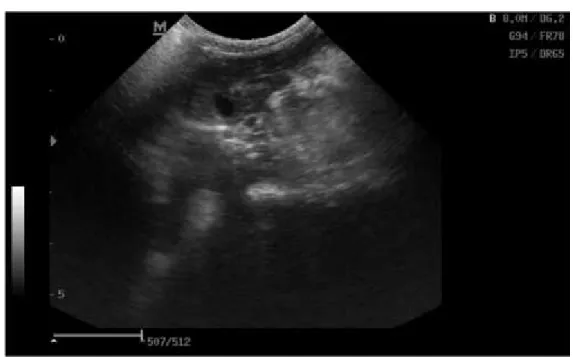
Ultrasonographic and histological examination confirmed the development of fatty liver in animals from the fructose group. Ultrasound images of transverse section of the liver of fructosefed rats showed hyperechogenic liver with rough granular structure -Figure 2(A). In control rats the ultrasound image was normal with clearly defined gallbladder - Figure 2(B).
(B)
Figure 2. Ultrasound image of the liver of laboratory rats (transverse section). A: Fructose group B: Control group
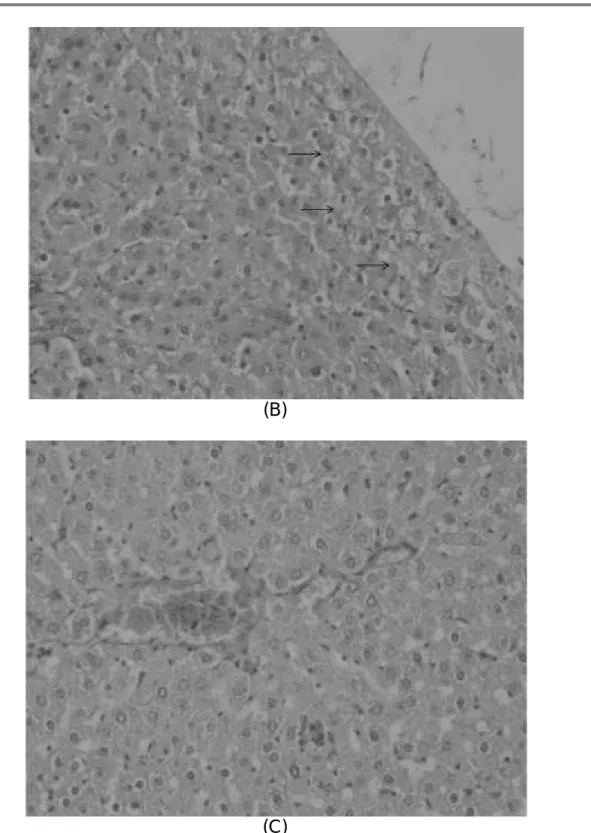
Figure 3 shows samples of histological studies using haematoxylin eosin staining of liver tissue. In livers of fructose-fed rats with light vacuoles (emptied oil drops) in the cytoplasm of hepatocytes: (A) and (B), and normal hepatocytes with part of the vena centralis of a control rat (C). Similar histological changes found Martines et al. (2010). Their results indicated the presence of a greater amount of lipid clusters in the livers of rats drinking 15% fructose solution.
(B)
(C)
Figure 3. Histological samples of liver tissue of laboratory rats (haematoxylin eosin staining at x200 magnification).
A and B: Fructose group C: Control group
CONCLUSIONS
The development of metabolic syndrome and hepatic steatosis in experimental rats after 8-week consumption of 15% fructose solution demonstrates the need to limit the intake of this sweetener as an opportunity to reduce the current global epidemic of obesity, type 2 diabetes, nonalcoholic liver steatosis, gout and other chronic diseases.
ACKNOWLEDGEMENTS
BIBLIOGRAPHY
1. Bocarsly, M.E., Powell, E.S., Avena, N.M., Hoebel, B.G., 2010 - High-fructose corn syrup causes characteristics of obesity in rats: increased body weight, body fat and triglyceride levels, Pharmacol Biochem Behav, vol.97(1), 101-106.
2. Bray, G.A., Nielsen, S.J., Popkin, B.M., 2004 - Consumption of high-fructose corn syrup in beverages may play a role in the epidemic of obesity, AmJ Clin Nutr, vol.79(4), 537-543.
3. Brown, C.M., Dulloo, A.G., Yepuri, G., Montani, J.P., 2008 - Fructose ingestion acutely elevates blood pressure in healthy young humans, Am J Physiol Regul Integr Comp Physiol, vol. 294(3),730-737.
4. Cinti, S., 2005 - The adipose organ. Prostaglandins Leukot Essent Fatty Acids, vol.73(1), 9-15.
5. Day, C.P., James, O.F., 1998 - Steatohepatitis: a tale of two “hits”? Gastroenterol, vol.114, 842-845.
6. De Maura, R.F., Ribeiro, C., de Oliveira, J.A., Stevanato, E., de Mello, M.A., 2009 -Metabolic syndrome signs in Wistar rats submitted to different high-fructose ingestion protocols, Br J Nutr, vol.101(8), 1178-1184.
7.Douard, V., Ferraris, R.P., 2013 -The role of fructose transporters in diseases linked to excessive fructose intake,J Physiol,vol.591(2), 401-414.
8. Farrell, G.C., Larter, C.Z., 2006 - Nonalcoholic fatty liver disease: from steatosis to cirrhosis, Hepatol,vol.43, 99-112.
9.Fujita, K., Nozaki, Y., Wada, K., Yoneda, M., Fujimoto, Y., Fujitake, M., et al., 2009
-Dysfunctional very-lowdensity lipoprotein synthesis and release is a key factor in nonalcoholic steatohepatitis pathogenesis, Hepatol,vol.50, 772-780.
10. Lindqvist, A., Baelemans, A., Erlanson-Albertsson, C., 2008 - Effects of sucrose, glucose and fructose on peripheral and central appetite signals, Regul Pept, vol.150(1-3), 26-32.
11. Martines, C., Gonzales, E., Garcia, R.S., Salas, G. et al., 2010 - Effects on body mass of laboratory rats after ingestion of drinking water with sucrose, fructose, aspartame, and sucralose additives, OOJ,vol.2, 116-124.
12. Musso, G., Gambino, R., Cassader, M., 2009 - Recent insights into hepatic lipid metabolism in non-alcoholic fatty liver disease (NAFLD), Prog Lipid Res,vol.48, 1-26. 13. Schadinger, S.E., Bucher, N.L., Schreiber, B.M., Farmer, S.R., 2005
-PPARgamma2 regulates lipogenesis and lipid accumulation in steatotic hepatocytes, Am J Physiol Endocrinol Metab,vol.288, 1195-1205.
14. Schwarz, J.M., Linfoot, P., Dare, D., Aghajanian, K., 2003 - Hepatic de novo lipogenesis in normoinsulinemic and hyperinsulinemic subjects consuming high-fat, low-carbohydrate and low-fat, high-low-carbohydrate isoenergetic diets, Am J Clin Nutr,vol.77, 43-50.
15. Shimomura, I., Bashmakov, Y., Hordon, J.D., 1999 - Increased levels of nuclear SREBP-1c associated with fatty livers in two mouse models of diabetes mellitus, J Biol Chem, 274:30028-32.
16. Stanhope, K.L., Griffen, S.C., Bair, B.R., Swarbrick, M.M., Keim, N.L., Havel, P.J., 2008 -Twenty-four Hour Endocrine and Metabolic Profiles Following Consumption of High Fructose Corn Syrup-, Sucrose- Fructose-,and Glucose-Sweetened Beverages with Meals, Am J Clin Nutr,vol.87(5), 1194-1203.
women, J Clin Endocrinol Metab,vol.89(6), 2963-2972.
20. Vanni, E., Bugianesi, E., Kotronen, A., De Minicis, S., Yki-Järvinen, H., Svegliati-Baroni, G., 2010 - From the metabolic syndrome to NAFLD or vice versa? Dig Liver Dis,
vol.42, 320-330.
21. Weston, S.R., Leyden, W., Murphy, R., Bass, N.M., Bell, B.P., Manos, M.M., 2005