S O F T W A R E
Open Access
Optimized watershed delineation library for
server-side and client-side web applications
Muhammed Sit
1*, Yusuf Sermet
2and Ibrahim Demir
3Abstract
The advancements and new techniques in information technologies are making it possible to acquire large-scale spatial data through satellites, radars and sensor networks. The collection of vast amounts of environmental data increased the demand for applications which can manage and process large-scale and high-resolution data sets in real-time. One of the important tasks for organizing and customizing hydrological data sets is the delineation of watersheds on demand. Watershed delineation is a process for creating a boundary that represents the
contributing area for a specific control point or water outlet, with the intent of characterization and analysis of portions of a study area. Although many GIS tools and software are available for watershed analysis on desktop systems, there is a need for optimized libraries for client-side and server-side web applications for creating a dynamic and interactive environment for exploring hydrological data. In this project, we developed and
demonstrated several watershed delineation techniques on the web, with seven different use cases implemented on the client-side using JavaScript, WebAssembly, and WebGL and on the server-side using Python, Go, C, and Node.js. We also developed a client-side GPGPU (General Purpose Graphical Processing Unit) algorithm to analyze high-resolution terrain data for watershed delineation by benefiting from the parallelizable nature of GPUs. The web-based real-time analysis of watershed segmentation can be helpful for decision-makers and stakeholders while eliminating the need of installing complex software packages and dealing with large-scale data sets.
Keywords:Catchment delineation, GPGPU, Data compression, Web-based visualization
Introduction
Ever expanding sensor networks that collects high-reso-lution spatial datasets provide many opportunities for hydrological sciences [9], while bringing challenges in large-scale data handling and processing [25]. There are many challenging tasks that employ sensor networks re-garding organization and customization of the datasets [8] within a watershed for users dealing with the data. The watershed (i.e. drainage basin or catchment area) of a location represents the land area in which any precipi-tation eventually flows into the same outlet. Thus, delin-eation of the watershed can be defined as finding the catchment area of a point [2]. Watershed delineation helps users identify the surface water features within a watershed and understand the downstream impacts when planning and implementing water quality and
quantity related protection and mitigation actions. Watershed delineation is used extensively in many infor-mation systems [6] and visualization applications [7]. Since hydrologic modeling efforts vastly assume that watershed delineation is done accurately, the perform-ance of watershed delineation tools becomes more important. Providing the most accurate results [3], man-ual watershed delineation is done by finding water divides on topographic maps [2] while its automation is an ongoing research interest in the field of hydrology. Since topography takes a crucial role in hydrological modeling, the key aspects of the modeling efforts start with the representation of geography in the digital envir-onment. Thus, all watershed delineation tools and librar-ies depend on the generation of digitally expressed topography data. Creation of this data broadly achieved by flow routing algorithms. Several cumulatively devel-oped flow routing algorithms are employed for generat-ing the data required for watershed delineation in both software packages and within standalone applications.
© The Author(s). 2019Open AccessThis article is distributed under the terms of the Creative Commons Attribution 4.0 International License (http://creativecommons.org/licenses/by/4.0/), which permits unrestricted use, distribution, and reproduction in any medium, provided you give appropriate credit to the original author(s) and the source, provide a link to the Creative Commons license, and indicate if changes were made.
* Correspondence:[email protected]
1Department of Computer Science, University of Iowa, Iowa City, Iowa, USA
used within this study is generated by taking advantage of the D8 algorithm.
Current implementations
Early examples [15, 20, 24] of automated watershed delineation start with advancements in DEM data gener-ation. Jones et al. [16] utilized triangle-based terrain models in watershed delineation. Nelson et al. [23] pre-sented an algorithm that is centered upon triangulated irregular networks to delineate watersheds by finding their boundaries. Tarboton [26] introduced an approach in watershed delineation exploiting flow directions as the steepest downward slope. In [19], Lin et al. studied a GIS-based watershed analysis system, WinBasin. While WinBasin provides a system with incorporated flow dir-ection calculation algorithm, it also finds the watershed using flow direction matrix. Chu et al. [5] introduced an alternative way of delineating watersheds precisely by taking complex land surfaces such as flats and combined puddles into account. Haag and Shokoufandeh [14], pre-sented an algorithm to delineate watershed boundaries by, rather than discovering the internal area, marching around the edges of its corresponding region namely using Haag Shokoufandehs March (HSM) algorithm. Again Haag et al. [13] presented a new algorithm with a similar but faster approach called Watershed Marching Algorithm (WMA) in order to delineate watersheds from 2D flow direction grids. Even though they employed differentiable approaches, all these algorithms share the concept of accumulation of cell contributions across a landscape while obtaining this information from flow direction grids [3].
Various tools within geographic information systems (GIS) have been developed in order to automate this process. One of the most used watershed delineation tools comes within the Spatial Analyst extension of Arc-GIS which is a commercial product. Being an open source alternative to ArcGIS, QGIS provides a free-to-use watershed delineation tool named as Watershed Basins Algorithm. While this option enables researchers to run delineation on their own data, it’s not easily accessible considering that it needs the installation of a comprehensive GIS software package into the system. Another free solution is the Geographic Resources
on the web is the environmental Resources Assessment and Management Systems (eRAMS). eRAMS provides a cloud-based watershed delineation tool while widely de-pending on GDAL package’s capabilities. Considering GDAL is a software package that is not supported to run on browsers, eRAMS handles all processing on server-side including the watershed delineation. Other tools that are not as popular as those already mentioned also provide a suitable environment for watershed delineation on-demand but lack the integration to other systems [12,21]. Albeit some studies present web-based systems [4] to delineate watersheds, they still handle this task on server-side rather than utilizing client’s computing power.
The contribution of this study is providing an opti-mized data format and watershed delineation algorithm for web applications. The presented algorithm is devel-oped, tested, and benchmarked is various languages for both server-side (i.e. Python, Go, C, Node.js) and client-side (i.e. JavaScript, WebGL, WebAssembly) applications as an open source software package. An alternative par-allelizable delineation algorithm is developed using WebGL to benefit from the power of Graphical Proces-sor Units (GPU) as a general-purpose application. All implementations are open source and ready to use in web systems. All server-side implementations can easily run through the command line as both standalone tools and integrated scripts into other programmed systems. The client-side implementations can run on browsers as standalone applications and be reproduced in other web-based systems.
Implementation
or item in the matrix represents the direction of the flow to one of the eight directions. Numbers 1, 2, 3, 4, 6, 7, 8 and 9 represent the flow to northwest, north, northeast, west, east, southwest, south and southeast respectively (Fig. 2). Potential sink in the landscape can be handled at the flow direction step. If the flow direction data con-tains sinks, algorithm skips cells with no drainage or flow information and process neighboring cells. This might allow sinks to be included within the watershed area depending on the sink location.
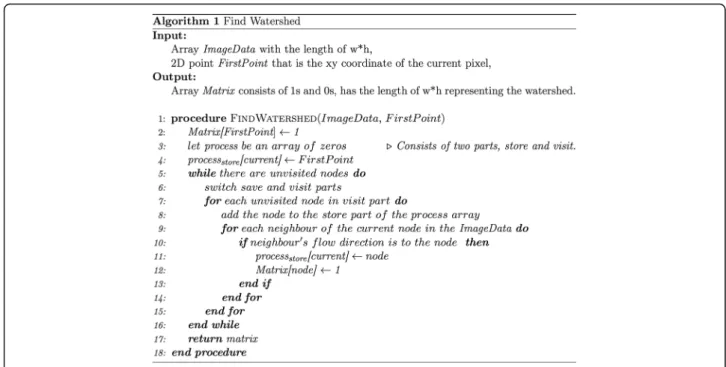
The main watershed delineation algorithm consists of two separate functions. The first function handles find-ing the watershed area with the time complexity of O (wh) where w and h are the weight and the height of the data matrix, respectively (Fig. 3). The second function finds the watershed border using the output of the first algorithm in O(n) time where n is the number of edge cells within the watershed (Fig. 4). Watershed finding algorithm is similar to the breadth-first search (BFS)
though intensively optimized to specialize for watershed delineation. Rather than adding to the queue and con-suming nodes to visit from the queue, this algorithm presents a two-way visit and store mechanism within an array. In each iteration, the visit and store parts of the array are switched, and new nodes are explored by this mechanism as iteration continues. The algorithm uses direction arrays to ease understanding flows within the data. In order to find the border around the computed watershed area, the output array is fed to the border de-lineation algorithm. Border dede-lineation algorithm is a special implementation of marching algorithm. It simply walks around the watershed found by the previous step. First, it takes the initial point (outlet) on the watershed as the baseline, and walks around the watershed until it returns to the first point to finish calculating the border iteratively.
Data encoding
The flow routing data that is used for experiments in this study consists of 5900 × 3680 cells for the State of Iowa within a rectangular buffer zone. Data is generated using the 90-m resolution DEM data and takes approxi-mately 150 MB of space on the disk as a raster file. Espe-cially for client-side solutions this amount of data creates a huge overhead when conveyed to the client-side on the web. In order to reduce the transferred data amount between the server and the client, the flow route matrix needs to be optimized in file size. Since the data was in matrix structure and only consisted of numbers (1–9), it is possible to encode all data in an image. For this purpose, we employed lossless Portable Network Graphics (PNG) format and stored the whole data in a
Fig. 1Overview of the watershed delineation implementations
single-color channel of an image (Fig.5). Each data point in the actual flow route matrix was embedded into each pixel’s red channel and the file size was reduced to 5.3 MB. This new format as an image doesn’t bring an ex-tensive decompression overhead in computation since the image files have optimized native support in web standards to access individual pixels. Our experiments have shown that the overhead is minimal considering conveying the whole raw data takes much more time with an average internet connection than uncompressing it programmatically. Thus, the tradeoff in this may be drawn in favor of this compression for client-side
solutions. As in image format, web applications cache the data in the browser which avoid download in future usages. In the case of server-side implementations, while it’s still possible to use this data, it may not be feasible due to the decompression workload. Thus, the data in-corporation is better done through either as a binary file or embedded data into the actual code, rather than a compressed image type. Server-side implementation re-quires transferring the output data (watershed boundary, < 100 KB) for each request, which after certain number of requests exceeds the raw image data (DEM, 5 MB) transfer for client-side implementation.
Fig. 3Pseudo code for watershed finding algorithm
Client-side implementations
As mentioned in the Introduction section, watershed de-lineation solutions provided in the literature requires a server when provided as a service. One-time watershed delineation task is not computationally expensive. How-ever, it is not a trivial task to handle this process on ser-ver-side when the application is served on-demand and accessed by thousands of users. Doing such computation on demand for every user is computationally expensive for service providers. This workload that server-side watershed delineation tools handle can be surpassed by handing over the task to the client-side. One drawback might be conveying whole data to the client-side which can be overcome by encoding the data as an image for lower DEM resolutions as mentioned above. Considering the client computers are powerful enough to handle such task and the algorithm is lightweight when it runs for a limited number of times, it can be argued that this is a good practice to handle watershed delineation in cli-ent-side rather than server-side when data size stays manageable after image encoding. The transferred data will be cached on the client-side which eliminates future data transfers from server.
JavaScript implementation
The JavaScript implementation of the watershed delinea-tion tool depends on the embedded data from image. When the system is running, the script first opens the image and then puts the data into a typed array. This unsigned integer array then fed into the implemented al-gorithm and the output is either reported on the console or saved as a geospatial file, Keyhole Markup Language (KML). Currently, we provide three types of JavaScript implementations. One of them is a pure JS code snippet and can be run through Node.js API in which the details will be given in server-side implementations sub-section. Rest of the implementations are designed for client-side and they come with an accompanying HTML file that serves the output border array to the client (Fig. 6). These two client-side solutions have a core difference,
that is, while one of them is written in pure JavaScript, the other one utilizes WebAssembly to move the com-putations to a lower level technology. This change is expected to provide better time-wise performance. WebAssembly is a low-level computational technology and a web-standard that complements JavaScript to speed up tasks that JavaScript falls short of in terms of computation speed. It should be also noted that the watershed delineation tool’s WebAssembly implementa-tion was compiled using the Emscripten [10] environ-ment from the C impleenviron-mentation that will be explained in the server-side implementations subsection.
GPU-based implementation
Since the elevation data is encoded as an image, it pro-vides the unique opportunity to use GPUs by feeding data into textures. Though GPUs are initially designed to facilitate the image creation process due to their highly parallel structure, it is proven to be a powerful tool for complex scientific computations. To alter the default process to implement a general-purpose applica-tion to work with GPUs, one should evaluate the graph-ics pipeline (i.e. rendering pipeline) considering the application’s needs. Graphics pipeline is a conceptual model that defines the workflow for a GPU to render a 3D object into a 2D representation. The nature of the pipeline depends on the architecture of the underlying hardware as well as the design choices for the intended graphical outcome. Thus, there is not a universally agreed-upon pipeline. However, certain graphical APIs have been created to increase the abstraction and present a more unified interface for GPU manipulation. These APIs include Direct3D, Metal, Vulkan, OpenGL, and WebGL, which is a derivation of OpenGL for use via browsers. In this work, we have implemented the watershed delineation algorithm in WebGL due to its widespread support by industry leaders and the commu-nity, its ability to provide a convenient way to use a cli-ent-side GPU, and its compatibility with all major browsers via web and mobile. Although the presented
approach is built with consideration of the graphical API supported by WebGL, it can easily be modified to work with other APIs.
There are two types of shaders available in WebGL, namely vertex and fragment shaders. Vertex shaders are responsible for generating the clip space coordi-nates. Fragment shaders allow the application of a procedure to access each pixel in parallel every cycle in order to calculate and assign its color. The 90 m DEM data used in this project is represented as an image with a 5900 × 3680 pixel resolution, meaning that the number of times the fragment shader will be run per frame is 21,712,000, which proves the sensitiv-ity of the code’s efficiency. Some of the best practices include avoiding or minimizing the use of loops and branches in shaders. Another challenge is that only the color value of the current pixel can be manipu-lated from shader since otherwise would break the parallelism, though other pixels’colors can be read.
Parallelization of algorithms is a major challenge since they usually will have sequential components. The amount of speedup actually depends on the paralleliz-able portion of the algorithm as expressed in Amdahl’s Law [1]. Thus, the presented approach for watershed de-lineation was adapted in a way to maximize overall speedup by minimizing the execution time of parts that cannot benefit from the computational power brought by the GPU. There are two main components of this cli-ent-side module including the preprocessing of DEM data in JavaScript, and watershed delineation in WebGL, where former is sequential, and latter is the parallelizable component.
Initial implementation
After the image-encoded DEM data is loaded to client-side, a WebGL program is created, linked with the Vertex and Fragment shaders, and bound with the loaded image that is processed into a WebGL Texture.
The starting point of the watershed delineation process, which has been selected dynamically by the user, is enu-merated as 10 and updated in the image before it is pro-vided to the WebGL program.
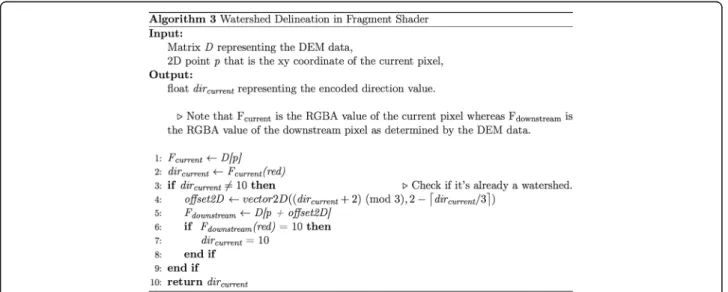
The main algorithm is coded in the fragment shader and runs for every pixel independently. Since the frag-ment shader limits us to modify any other pixel’s color other than itself, the algorithm’s perspective is changed in a way that may seem semantically counter-intuitive. As a reminder, each pixel is encoded with the direction information of water flow. The algorithm reads the current pixel’s value, which then points out to the neigh-boring pixel that represents its downstream. If that pixel is encoded with value 10, meaning that it is part of the watershed, the current pixel is updated as 10 as well. This process continues until there are no pixel updates in a cycle, which suggests that the watershed is com-pletely delineated within the scope and resolution of the provided DEM data. Pseudocode of this process is de-scribed in Fig.7 and can be observed to have O(1) time complexity.
Optimizations and improvements
Described approach has been successfully implemented and demonstrated that the client-side GPUs can be uti-lized to delineate watersheds. However, the performance improvements were necessary to make it a viable solu-tion for practical use. Various modificasolu-tions have been made to better use the language by respecting its limita-tions and benefiting from its advantages. These include the use of low precision floats, eliminating if conditions by developing simple mathematical equations and cach-ing results of the procedures that are computationally costly or fundamentally slow. Additionally, several
architectural optimizations have been designed and im-plemented that result in significant speedups and worth-while trade-offs.
As the DEM data is only expressed via the red channel of the image, remaining channels (i.e. gba - green, blue, alpha) have the potential to be utilized in order to de-crease the time spent in the fragment shader. One approach is to decrease the texture’s dimensions by a factor of 2 (i.e. reduce the texture to the quarter of its size) by placing the neighboring pixels in the gba color channels. This means treating each channel as if it is a different pixel. By reducing the size of the texture, and thus the number of fragment shader executions per cycle, it decreases the overall runtime significantly. How-ever, the overhead added to the fragment shader to handle this new architecture prevent it to be a viable solution.
Another approach is checking a few steps ahead rather than just the immediate neighbor. However, to check N steps ahead in one cycle basically requires sequentially running the same shader code N times. Thus, the trade-off does not prove to be efficient. A critical design choice when coding the fragment shader is to minimize the de-pendencies and sequential logic. We have utilized the
gba color channels to store the direction values of its three downstream pixels. Fragment shader can calculate all downstream coordinates and read their values with-out having to wait for the sequential process. Instead, it reads the downstream values in parallel to form a length-4 vector and calculates whether any of them is la-beled as the watershed, thanks to the power of GPUs in vector arithmetic.
A watershed usually grows in certain directions by na-ture. For the first cycle, only the neighbors within the
updated to expand to cover the newly discovered water-shed parts and to shrink to eliminate the non-expanding routes of the watershed.
Server-side implementations
Besides the client-side implementations, we propose four different server-side implementations (i.e. Python, C, Go, Node.js) of the algorithms described in Figs. 3 and 4. All of these implementations have the same functionality and behavior. They can be used through the command line and can be integrated to other programmable resources using either the intended languages’ command line interfaces or importing the package inline. In addition to the encoded PNG file, the serside programs also accept the binary ver-sion of the DEM data as input. When proper input is given through the command line, the output should be the generated KML or coordinates of the intended watershed. It should be noted that these implementa-tions can still be extended for the data that is encoded on raw text, but we do not provide the re-quired application interfaces for such usage.
Python implementation was coded using Python ver-sion 3.6.5. If encoded PNG is intended as the input file, watershed delineation tool needs a Python package (i.e.
Pillow) for decoding. Other than decoding package,
Python implementation does not have any dependencies. Usage through command line interface can be achieved by“python watershed.py” (Fig.8). Besides the command line interface, Python implementation can be imported
the PNG Reference Library (i.e. libpng) that is used for reading the data from the encoded image. Unlike Python, C implementation needs to be compiled. While GCC is used as the first choice of a C compiler during this study, Clang is also tested for compatibility pur-poses. Compilation can be made with the command“gcc
-o watershed.out watershed.c”which produces an
execut-able named as watershed.out. After the compilation, the compiled executable can be run on the command line by“./watershed.out”.
Go implementation does not have any non-core library dependencies and needs to be compiled to an executable similar to C. This implementation was built on top of Go 1.11 and it can be compiled using GC (official Go Compiler). Compilation can be done by“go build” com-mand in the directory that the filewatershed.gois stored. After the compilation, the command line tool can be used in a similar fashion with the C implementation. Al-though running a Go program on the command line is straightforward, importing it into other Go programs requires package formatting, which is provided in the repository along with an example Go program to dem-onstrate its usage.
The JavaScript implementation presented in this art-icle can be used in the server-side as well with a few minor changes. In order to achieve the server-side com-patibility and to have a JavaScript runtime environment, Node.js was employed and a command line tool was created. Importing the server-side JavaScript implemen-tation to external JavaScript programs is also possible
using the regular Node.js API. Usage sample is provided in the git repository.
Even though this study presents a software package for real-time watershed delineation implemented in a variety of programming languages, there are still other pro-gramming languages researchers and programmers may have employed in their projects. It is possible and feas-ible to use presented implementations with other lan-guages. In order to provide a proof of concept, we included sample programs written in PHP and Ruby in the repository to show that it is possible to use any of the aforementioned implementations within other pro-gramming languages. These sample snippets simply use the employed programming language’s command line API to call one of the already implemented watershed delineation tools in either Python, C, JavaScript or Go.
Results
The aim of this study is to provide easy to use watershed delineation tools for both server-side and client-side web applications. The performance evaluations of the imple-mentations are reported in this section. Elapsed time reports in Table2were measured on two different com-puters; the client computer that is powered by Intel(R) Core (TM) i7-6800K CPU @ 3.40GHz and 32 GB 2800 MHz RAM, and the server that runs on Intel(R) Xeon(R) E5–2699 v4 @ 2.20GHz CPUs. The results for server-side implementations were obtained using a bash script that measures the elapsed time of the entire run for each implementation. On the client-side, we employed Google Chrome Version 70.0.3538.110 which was the up to date version of Google Chrome at the time of these experiments. Besides the CPU based runs,
we also included performance report for WebGL imple-mentation with the same client system that employs an NVIDIA GTX 1080 as the GPU. It should be noted that the performance of client-side implementations for the same system may differ with a different choice of browser and version. These tests were done for a se-lected point (X = 4777, Y = 897) on flow direction matrix that generates one of the largest watersheds in the state of Iowa with 90 m DEM resolution.
Reported results on Table 2 show that the fastest implementation on server-side is the one that is written in C. While Go version performs fair, it doesn’t provide a solution that would outperform C implementation when C compiler is run with max-imum optimization settings. The server-side run of the JavaScript implementation provides a feasible option and the Python implementation performs significantly worse than others. On client-side, the comparison between pure JavaScript implementation and WebAssembly powered version clearly shows that when WebAssembly is employed, client-side JavaScript becomes significantly more effective. Besides the conventional methods, GPU powered WebGL implementation also performs in a conveni-ent manner.
Conclusions
In this study, a custom watershed delineation algorithm that uses flow direction as inputs was proposed for conventional programming systems. Implementations of this algorithm for both server-side and client-side in Python, C, Go and JavaScript were also presented. Besides these implementations and the algorithm, as a core contribution, we also proposed a WebGL powered client-side approach in watershed delineation. After discussing the algorithmic chal-lenges and watershed delineation tool’s appearance from user’s perspective, the performance comparison of implementations was presented. All of the imple-mentations presented here are open sourced and can be accessed on Github a public git repository. It should be noted that this repository has GNU Gen-eral Public License v3 (GNU GPLv3) license and must be distributed with the same license if changes are made on the code.
As a future enhancement, we aim to incorporate lower-level technologies for client-side JavaScript as they become stable. It is possible to use the server-side tools with programming languages other than the ones that have watershed delineation tool imple-mented by using their command line or shell APIs. We plan to implement the tool in other scripting languages that are widely used in web development such as PHP and Ruby as well.
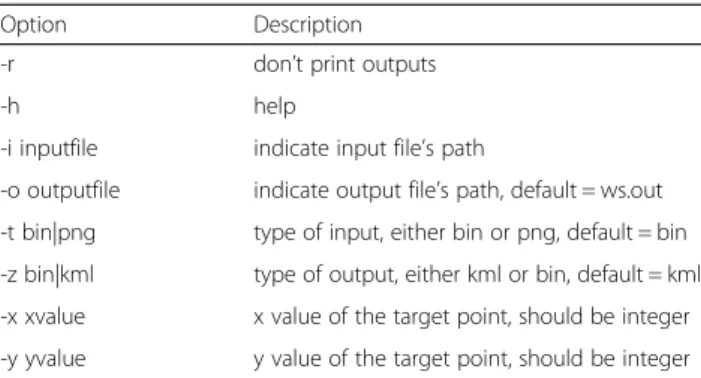
Table 1Command line manual for Python, JavaScript, Go and C implementations
Option Description
-r don’t print outputs
-h help
-i inputfile indicate input file’s path
-o outputfile indicate output file’s path, default = ws.out
-t bin|png type of input, either bin or png, default = bin
-z bin|kml type of output, either kml or bin, default = kml
-x xvalue x value of the target point, should be integer
-y yvalue y value of the target point, should be integer
Table 2Average run-times (in milliseconds) of watershed delineation for the selected point
Server-Side Client-Side
Python C Go Node.js JavaScript WebAssembly WebGL
License:GNU GPL.
Any restrictions to use by non-academics: License
needed.
Abbreviations
API:Application Programming Interface; BFS: Breadth-first search; DEM: Digital Elevation Model; eRAMS: The environmental Resources Assessment and Management Systems; GIS: Geographic Information System; GNU GPLv3: GNU General Public License v3; GPGPU: General Purpose Graphical Processing Unit; GPU: Graphical Processing Unit;
GRASS: Geographic Resources Analysis Support System; HSM: Haag Shokoufandehs’March; KML: Keyhole Markup Language; PNG: Portable Network Graphics; WMA: Watershed Marching Algorithm
Acknowledgements
The work reported in this study has been possible with the support and work of many members of the Iowa Flood Center at the IIHR Hydroscience and Engineering, University of Iowa.
Authors’contributions
MS implemented server-side versions of the watershed delineation tool. YS created WebGL powered version of the tool. ID developed the watershed delineation algorithm and implemented and optimized the client-side Java-Script code. All authors read and approved the final manuscript.
Funding Not applicable.
Availability of data and materials
All materials and data used throughout this study are available in the watershed-delineation repository, https://github.com/uihilab/watershed-delineation.
Competing interests
The authors declare that they have no competing interests.
Author details
1Department of Computer Science, University of Iowa, Iowa City, Iowa, USA. 2
Department of Electrical and Computer Engineering, University of Iowa, Iowa City, Iowa, USA.3Department of Civil and Environmental Engineering,
University of Iowa, Iowa City, Iowa, USA.
Received: 4 December 2018 Accepted: 25 July 2019
References
1. Amdahl GM. Validity of the single processor approach to achieving large scale computing capabilities. In Proceedings of the AFIPS Spring Joint Computer Conference. ACM. 1967. p. 483–5.
2. Bajjali W. Watershed delineation. In: Bajjali W, editor. ArcGIS for environmental and water issues. Cham: Springer; 2018. p. 235–45. 3. Baker ME, Weller DE, Jordan TE. Comparison of automated watershed
delineations. Photogramm Eng Remote Sens. 2006;72(2):159–68.
4. Choi JY, Engel BA. Real-time watershed delineation system using web-GIS. J Comput Civ Eng. 2003;17(3):189–96.
5. Chu X, Zhang J, Chi Y, Yang J. An improved method for watershed delineation and computation of surface depression storage. In: Potter KW,
2018;16(3):393–400.
10. Emscripten. Kripken.https://github.com/kripken/emscripten/. Accessed Nov 26 2018.
11. Fairfield J, Leymarie P. Drainage networks from grid digital elevation models. Water Resour Res. 1991;27(5):709–17.
12. Garbrecht J, Campbell J. An automated digital landscape analysis tool for topographic evaluation, drainage identification, watershed segmentation and subcatchment parameterization: TOPAZ user manual: USDA, Agricultural Research Service, Grazinglands Research Laboratory; 1997. 13. Haag S, Shakibajahromi B, Shokoufandeh A. A new rapid watershed
delineation algorithm for 2D flow direction grids. Environ Model Softw. 2018;109:420–8.
14. Haag S, Shokoufandeh A. A Watershed Delineation Algorithm for 2D Flow Direction Grids. arXiv preprint arXiv:1708.00354. 2017.
15. Jenson SK, Domingue JO. Extracting topographic structure from digital elevation data for geographic information system analysis. Photogramm Eng Remote Sens. 1988;54(11):1593–600.
16. Jones NL, Wright SG, Maidment DR. Watershed delineation with triangle-based terrain models. J Hydraul Eng. 1990;116(10):1232–51.
17. Jones R. Algorithms for using a DEM for mapping catchment areas of stream sediment samples. Comput Geosci. 2002;28(9):1051–60. 18. Krajewski WF, Ceynar D, Demir I, Goska R, Kruger A, Langel C, et al.
Real-time flood forecasting and information system for the state of Iowa. Bull Am Meteorol Soc. 2017;98(3):539–54.
19. Lin WT, Chou WC, Lin CY, Huang PH, Tsai JS. WinBasin: using improved algorithms and the GIS technique for automated watershed modelling analysis from digital elevation models. Int J Geogr Inf Sci. 2008;22(1):47–69. 20. Mark DM. Part 4: mathematical, algorithmic and data structure issues:
automated detection of drainage networks from digital elevation models. Cartographica. 1984;21(2–3):168–78.
21. Martz LW, Garbrecht J. Automated extraction of drainage network and watershed data from digital elevation models 1. J Am Water Resour Assoc. 1993;29(6):901–8.
22. Martz LW, Garbrecht J. The treatment of flat areas and depressions in automated drainage analysis of raster digital elevation models. Hydrol Process. 1998;12(6):843–55.
23. Nelson EJ, Jones NL, Miller AW. Algorithm for precise drainage-basin delineation. J Hydraul Eng. 1994;120(3):298–312.
24. O'Callaghan JF, Mark DM. The extraction of drainage networks from digital elevation data. Comput Vision Graphics Image Process. 1984;28(3):323–44. 25. Sermet Y, Demir I. An intelligent system on knowledge generation and
communication about flooding. Environ Model Softw. 2018;108:51–60. 26. Tarboton DG. A new method for the determination of flow directions
and upslope areas in grid digital elevation models. Water Resour Res. 1997;33(2):309–19.
Publisher’s Note

![Fig. 6 Interface of Client-side JavaScript implementation on IFIS [ 18 ]. This figure shows the interface of a operational version of the client-side JavaScript implementation](https://thumb-us.123doks.com/thumbv2/123dok_us/7904836.2104593/6.892.84.809.132.669/interface-client-javascript-implementation-interface-operational-javascript-implementation.webp)