Open Access
Original investigation
Plasma levels of soluble tumor necrosis factor-
α
receptors are
related to total and LDL-cholesterol in lean, but not in obese
subjects
Marek Straczkowski, Irina Kowalska*, Agnieszka Nikolajuk,
Agnieszka Adamska, Malgorzata Karolczuk-Zarachowicz,
Monika Karczewska-Kupczewska, Agnieszka Kozlowska and Maria Gorska
Address: Department of Endocrinology, Diabetology and Internal Medicine, Medical University of Bialystok, M.C. Sklodowskiej 24a, 15-276 Bialystok, Poland
Email: Marek Straczkowski - mstraczkowski@poczta.onet.pl; Irina Kowalska* - irinak@poczta.onet.pl;
Agnieszka Nikolajuk - agstepien@poczta.onet.pl; Agnieszka Adamska - ak001@wp.pl; Malgorzata Karolczuk-Zarachowicz - megkarol@wp.pl; Monika Karczewska-Kupczewska - monika3101@wp.pl; Agnieszka Kozlowska - agakoz@poczta.onet.pl; Maria Gorska - mgorska25@wp.pl * Corresponding author
Abstract
Background: Tumor necrosis factor-α (TNFα) is a mediator of insulin resistance. Plasma levels of soluble TNFα receptors (sTNFR1 and sTNFR2) probably reflect paracrine action of the cytokine. TNFα is also a regulator of lipid metabolism, however, data about impact of obesity on the relationships between TNFα and plasma lipids remain controversial.
Aim: The purpose of the present study was to examine the associations of TNFα system with plasma lipids in lean and obese subjects with normal glucose metabolism.
Methods: We examined 63 subjects, 33 lean (BMI<25 kg × m-2) and 30 with marked overweight
or obesity (BMI>27.8 kg × m-2). Anthropometric and biochemical parameters were measured. Oral
glucose tolerance test and euglycemic hyperinsulinemic clamp were also performed.
Results: Obese subjects were markedly more insulin resistant and had higher levels of both TNFα receptors. Total (TC) and LDL-cholesterol (LDL-C), triglycerides (TG) and non-esterified fatty acids (NEFA) were also higher in the obese group. In obese subjects, both receptors were significantly related to TG and HDL-cholesterol (HDL-C), while sTNFR2 was also associated with NEFA. All those correlations disappeared after controlling for insulin sensitivity. In lean subjects, both receptors were related to TC, HDL-C and LDL-C. In that group, sTNFR1 predicted values of all those parameters independently of BMI, plasma glucose and insulin, and insulin sensitivity.
Conclusion: We conclude that TNFα receptors are associated with plasma lipids in different way in lean and in obese subjects. TNFα system is probably important in determining cholesterol levels in lean subjects, while in obese this effect might be masked by other metabolic abnormalities.
Published: 27 June 2006
Cardiovascular Diabetology 2006, 5:14 doi:10.1186/1475-2840-5-14
Received: 04 May 2006 Accepted: 27 June 2006
This article is available from: http://www.cardiab.com/content/5/1/14
© 2006 Straczkowski et al; licensee BioMed Central Ltd.
Background
Tumor necrosis factor-α (TNFα) is a cytokine involved in regulation of the whole-body carbohydrate and lipid metabolism. One of the main metabolic effects of TNFα action is the development of insulin resistance [1]. In insulin resistant states, the cytokine acts mostly in an auto- and paracrine manner in adipose tissue [2] and skel-etal muscle [3]. Two cell surface TNFα receptors were described in humans, TNFR1 (p60) and TNFR2 (p80), soluble forms of those receptors (sTNFR1 and sTNFR2) are present in plasma and it is supposed that their concen-trations, especially sTNFR2, might reflect local action of TNFα in tissues [4]. Soluble TNFR might neutralize TNFα at high levels, but they also might stabilize its bioactivity, help sequester TNFα to its membrane receptors and thus increase the effects of the cytokine [5]. Adipose tissue TNFR2 mRNA and protein and plasma levels of sTNFR2 are increased in obesity and related to insulin resistance [4,6], in those studies no differences in TNFR1 levels were observed. In contrast, other authors reported an increase in adipose tissue expression [7] and plasma levels [8] of both receptors in obese subjects. Plasma TNFα values are usually low and do not give the precise information about its auto- and paracrine action. It is propose that sTNFR2 might serve as the best predictor of local TNFα system activity [4].
There are data that TNFα might also be an important fac-tor determining plasma cholesterol levels. The cytokine induces an increase in serum cholesterol and in hepatic hydro-3-methyl-glutaryl coenzyme A reductase activity in mice [9]. TNFα also induces maturation of sterol regula-tory element binding protein-1 (SREBP-1), an important transcription factor in cholesterol biosynthesis [10]. There is an evidence that TNFR2 gene polymorphism is associ-ated with hypercholesterolemia [11] and coronary artery disease [12]. However, data about plasma TNFα receptors as determinants of total and LDL-cholesterol levels and about impact of obesity on the relationships between TNFα system and plasma lipids remain controversial [13,14].
The aim of the present study was to examine the associa-tions of TNFα system with plasma lipids in lean and obese subjects.
Methods
SubjectsA total of 63 subjects, 33 lean (BMI<25 kg × m-2, 14 men
and 19 women) and 30 with marked overweight or obes-ity (BMI>27.8 kg × m-2, 12 men and 18 women) were
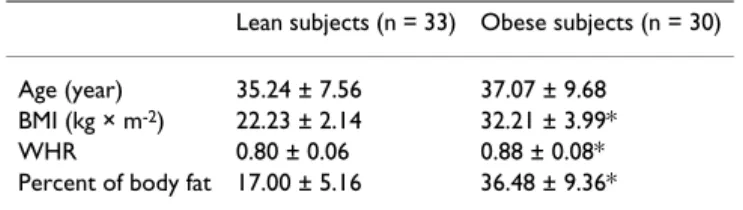
recruited for the present study. The subjects were recruited actively from Outpatient Clinic of Department of Endo-crinology, Diabetology and Internal Medicine of Medical University of Białystok. The basal characteristics of the studied groups are presented in Table 1. All the subjects were non-smokers, without ischaemic heart disease, hypertension, peripheral vascular disease, infections or any other serious medical problems. Only subjects with-out family history of type 2 diabetes were recruited for the present study. Before participating in the study, physical examination and resting electrocardiography were per-formed. All subjects underwent an oral glucose tolerance test (OGTT) and all had normal glucose tolerance accord-ing to WHO criteria. All subjects gave written informed consent before entering the study. The study protocol was approved by the Ethics Committee of Medical Academy, Białystok.
Anthropometry
All analyses were performed after an overnight fast. The BMI was calculated as body weight × height -2 (kg/m2).
The waist-to hip ratio (WHR) was also estimated. The waist circumference was measured at the smallest circum-ference between the rib cage and the iliac crest, with the subject in the standing position. The hip circumference was measured at the widest circumference between the waist and the thighs. Percent of body fat was estimated by bioelectric impedance analysis using the Tanita TBF-511 Body Fat Analyzer (Tanita Corp., Tokyo, Japan), fat mass (FM) and fat-free mass (FFM) were calculated.
Insulin sensitivity
Insulin sensitivity was evaluated by the euglycemic hyper-insulinemic clamp technique according to DeFronzo et al [15], as described previously [16,17]. On the morning of the study, two venous catheters were inserted into antecu-bital veins, one for the infusion of insulin and glucose and the other in the contralateral hand for blood sampling, that hand was heated to approximately 60°C. Insulin (Actrapid HM, Novo Nordisk, Copenhagen, Denmark) was given as a primed-continuous intravenous infusion for 2 hours at 40 mU × m-2 × min-1, resulting in constant
hyperinsulinemia of approximately 550 pmol/l. Arterial-ized blood glucose was obtained every 5 minutes and 20% dextrose (1.11 mol/l) infusion was adjusted to main-tain plasma glucose levels at 5.0 mmol/l. The glucose Table 1: Anthropometric parameters in the studied groups
(mean ± SD).
Lean subjects (n = 33) Obese subjects (n = 30)
Age (year) 35.24 ± 7.56 37.07 ± 9.68 BMI (kg × m-2) 22.23 ± 2.14 32.21 ± 3.99*
WHR 0.80 ± 0.06 0.88 ± 0.08*
Percent of body fat 17.00 ± 5.16 36.48 ± 9.36*
infusion rate approached stable values during final 40 minutes of the study and the rate of whole-body glucose uptake (M value) was calculated as the mean glucose infu-sion rate from 80 to 120 min, corrected for glucose space and normalized per kilogram of fat-free mass (M/FFM).
Other analyses
Fasting blood samples were also taken from the antecu-bital vein for the determination of glycated hemoglobin (HbA1c), plasma lipids, TNFα, sTNFR1 and sTNFR2. For the determination of plasma TNF system samples were frozen at -70°C.
Analytical procedures
Plasma glucose was measured immediately by the enzy-matic method using glucose analyzer (YSI 2300 STAT Plus, Yellow Spring Instuments, OH). Plasma insulin was measured with the Medgenix Enzyme Amplified Sensitiv-ity Immunosorbent Assay (EASIA) test (BioSource Europe, Nivelles, Belgium). The minimum detectable concentration was 1.05 pg/l and the intra-assay and inter-assay coefficients of variation (CVs) were below 5.5% and 10%, respectively. In that method, human and animal proinsulins present no cross-reaction. HbA1c were meas-ured by the high-performance liquid chromatography method (Bio-Rad, Muenchen, Germany). Plasma total (TC) and HDL-cholesterol (HDL-C) and triglycerides (TG) were assessed by the enzymatic methods (Cormay, Warsaw, Poland). Plasma LDL-cholesterol (LDL-C) was calculated from the Friedewald's formula. Plasma non-esterified fatty acids (NEFA) were measured by colorimet-ric method [18].
Plasma TNFα concentrations were measured by the Immunoassay Kit (BioSource International, Camarillo,
CA, USA) with the minimum detectable concentration 1.7 pg/ml and with the intra-assay and inter-assay CVs below 5.2% and 8.5%, respectively. Plasma sTNFR1 and sTNFR2 were determined with the EASIA kits (BioSource Europe). The minimum detectable concentration was 0.05 ng/ml for sTNFR1 and 0.1 ng/ml for sTNFR2. The intra-assay and inter-assay CVs for both receptors were below 6.5% and 9%, respectively. sTNFR1 EASIA does not cross react with sTNFR2 and TNFα does not interfere with the assay.
Statistical analysis
The statistics were performed with the STATISTICA 5.0 program (StatSoft, Krakow, Poland). Differences between the groups were evaluated with an unpaired Student's t-test. Relationships between variables were estimated with Pearson correlation coefficient analysis and with multiple regression analysis. Variables, which did not have normal distribution (insulin, TG) were log-transformed before analyses. The level of significance was accepted at p value less than 0.05.
Results
Biochemical parameters of the studied groups are pre-sented in Table 2. Obese subjects had higher levels of HbA1c, plasma glucose (both p < 0.001) and insulin (p < 0.005). The obese group was also markedly more insulin resistant (p < 0.005) and had higher levels of sTNFR1 (p < 0.0005) and sTNFR2 (p < 0.02). Plasma TNFα did not dif-fer between the studied groups.
Plasma TC, LDL-C (both p < 0.0001), TG (p < 0.005) and NEFA (p < 0.00005) were also higher in the obese group. No difference in HDL-C levels was observed between the studied groups. When we analysed all the studied popula-tion, we observed significant correlations of both sTNFR1 Table 2: Biochemical parameters in the studied groups (mean ± SD).
Lean subjects (n = 33) Obese subjects (n = 30)
HbA1c (%) 5.34 ± 0.41 5.78 ± 0.50*
Plasma glucose (mmol/l) 4.86 ± 0.48 5.35 ± 0.57*
Plasma insulin (pmol/l) 65.84 ± 32.14 105.33 ± 68.60*
M/FFM (µmol × kg-1 × min-1) 50.50 ± 14.64 39.37 ± 12.44*
Plasma TC (mmol/l) 4.43 ± 0.78 5.52 ± 1.08*
Plasma TG (mmol/l) 1.02 ± 0.52 1.64 ± 0.93*
Plasma HDL-C (mmol/l) 1.37 ± 0.32 1.23 ± 0.41
Plasma LDL-C (mmol/l) 2.59 ± 0.81 3.52 ± 0.96*
Plasma NEFA (mmol/l) 0.347 ± 0.116 0.504 ± 0.155*
Plasma TNFα (pg/ml) 4.89 ± 1.53 5.22 ± 2.69
Plasma sTNFR1 (ng/ml) 1.94 ± 0.37 2.36 ± 0.44*
Plasma sTNFR2 (ng/ml) 4.12 ± 0.79 4.74 ± 1.20*
HbA1c, glycated hemoglobin; M/FFM, whole-body glucose uptake normalized per kg of fat-free mass; TC, total cholesterol; TG, triglycerides; HDL-C, HDL-cholesterol; LDL-HDL-C, LDL-cholesterol; NEFA, non-esterified fatty acids; TNFα, tumor necrosis factor α; sTNFR1, soluble TNFα receptor 1; sTNFR2, soluble TNFα receptor 2.
and sTNFR2 with TC (r = 0.38, p < 0.005 and r = 0.31, p < 0.02), TG (r = 0.49, p < 0.0005 and r = 0.42, p < 0.001), HDL-C (r = -0.49, p < 0.0005 and r = -0.39, p < 0.005), LDL-C (r = 0.41, p < 0.001 and r = 0.32, p < 0.02) and NEFA (r = 0.48, p < 0.0005 and r = 0.40, p < 0.001, respec-tively). The correlations between TNFα system and plasma lipids were different among groups when lean and obese subjects were analysed separately.
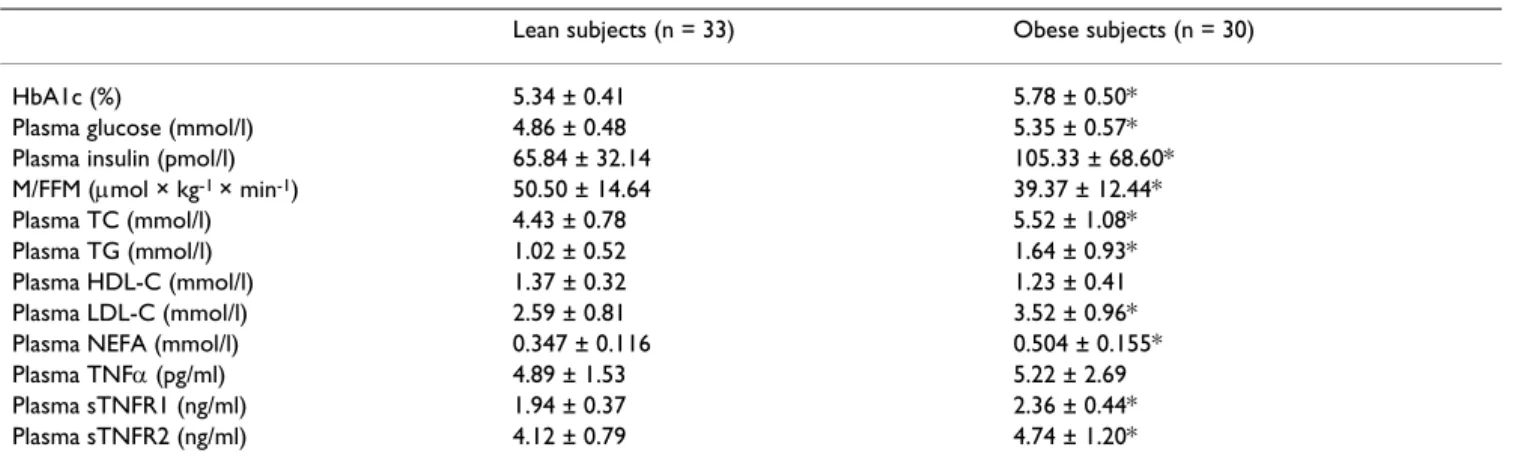
In obese subjects, both receptors were significantly related to TG and HDL-C (Fig. 1), while sTNFR2 was also associ-ated with NEFA (r = 0.43, p < 0.05). All those correlations disappeared after controlling for insulin sensitivity.
In lean subjects, both receptors were related to TC, HDL-C and LDL-HDL-C (Fig. 2). All the relationships were stronger for sTNFR1 than for sTNFR2. The correlations with TG and NEFA did not reach the level of significance. Multiple regression analysis revealed that sTNFR1, but not sTNFR2, predicted plasma levels of TC (R2 = 0.24, p < 0.005),
HDL-C (R2 = 0.23, p < 0.005) and LDL-C (R2 = 0.33, p < 0.0005)
independently of BMI, plasma glucose, insulin, and insu-lin sensitivity.
Discussion
We demonstrated an increase in both sTNFR1 and sTNFR2 in the obese group. This is in agreement with our
previous results [19], although in a smaller study we were able to detect an increase only in sTNFR2 [20]. The present study shows that soluble forms of TNFα receptors are related to plasma lipids in different way in lean and in obese subjects.
In the obese, both receptors were associated positively with TG and negatively with HDL-C, thus contributing to lipoprotein profile typical for the insulin resistance syn-drome. The relationships between TNFα receptors and plasma lipids in the obese group disappeared after con-trolling for insulin sensitivity, suggesting that lipid abnor-malities associated with TNFα system in obesity might be fully explained by TNFα-associated insulin resistance. In contrast, in the lean group sTNFR1 and sTNFR2 were related to TC, HDL-C and LDL-C, relationships of sTNFR1 were independent of insulin sensitivity and other exam-ined parameters.
The present study does not show any cause-effect relation-ships. It was reported that accumulation of cholesteryl esters in macrophages exposed to LDL-immune com-plexes is related to increase in TNFα synthesis and release [21]. Hypercholesterolemic rabbits [22] and LDL-receptor knockout mice [23] present increased TNFα secretion. However, in a situation when an increase in TNFα or its receptors might be secondary to hypercholesterolemia,
Relationships between soluble TNFα receptors and plasma lipids in obese subjects
Figure 1
Relationships between soluble TNFα receptors and plasma lipids in obese subjects. Relationships of: A. sTNFR1 and TG, B. sTNFR1 and HDL-C, C. sTNFR2 and TG, D. sTNFR2 and HDL-C.
r=0.42, p=0.022
1 1.5 2 2.5 3
1 1.5 2 2.5 3 3.5
s TNFR1 (mg /ml)
logT
G
A
r=-0.46, p=0.011
0 0.5 1 1.5 2 2.5
1 1.5 2 2.5 3 3.5
s TNFR1 (ng /ml)
HD
L
-C
(m
m
o
l/l)
B
r=0.39, =0.033
1 1.5 2 2.5 3
1 2 3 4 5 6 7 8
s TNFR2 (ng/ml)
logT
G
C
r=-0.36, p=0.048
0 0.5 1 1.5 2 2.5
1 2 3 4 5 6 7 8
s TNFR2 (ng/ml)
H
D
L
-C
(m
m
o
l/l)
one may expect a significant relationships between TNFα system and cholesterol rather in the obese group, present-ing higher lipid levels and higher risk of accelerated atherogenesis. Therefore, it seems unlikely that the above reports might help explaining findings of the present study. It is more probable that soluble TNFRs might reflect TNFα influence on cholesterol metabolism. The possible mechanism might be associated with an increase in hepatic hydro-3-methyl-glutaryl coenzyme A reductase activity [9] and/or maturation of SREBP-1 [10].
In recent studies, a microsatellite marker with 5 alleles in intron 4 of TNFR2 gene was reported [24]. This locus was associated with familial combined hyperlipidemia [24], hypertension, hypercholesterolemia [11] and coronary artery disease [12]. The genotypic effect on plasma sTNFR2 levels was also found [11,12]. It is suggested, that
the effects of TNFα on lipid metabolism are influenced by TNFR2 genotype [11]. No data about TNFR1 gene poly-morphism and lipid abnormalities are available.
Data about plasma TNFα receptors as determinants of total and LDL-cholesterol levels and about impact of obesity on the relationships between TNFα system and plasma lipids remain controversial. Both sTNFR1 and sTNFR2 were related to TC, TG and LDL-C in myotonic dystrophy patients [25]. It was also observed that both receptors were independent determinants of TC and LDL-C in healthy subjects, when lean and obese subjects were analysed together [13]. Plasma sTNFR2, but not sTNFR1, was associated with HDL2-cholesterol. In a large study conducted on 268 men in a wide range of BMI, both sTNFRs were related to TC and HDL-C [14]. In that study, however, TNFα receptors were not independent
predic-Relationships between soluble TNFα receptors and plasma lipids in lean subjects
Figure 2
Relationships between soluble TNFα receptors and plasma lipids in lean subjects. Relationships of : A. sTNFR1 and TC, B. sTNFR1 and HDL-C, C. sTNFR1 and LDL-C, D. sTNFR2 and TC, E. sTNFR2 and HDL-C, F. sTNFR2 and LDL-C.
r=0.49, p=0.003
2 3 4 5 6 7
1 1.5 2 2.5 3
s TNFR1 (ng/ml)
T
C
(
m
m
o
l/l)
A
r=-0.48, p=0.004
0 0.5 1 1.5 2 2.5
1 1.5 2 2.5 3
s TNFR1 (ng/ml)
H
D
L
-C
(
m
m
o
l/l
)
B
r=0.58, p=0.00041
1 1.52 2.53 3.54 4.5
1 1.5 2 2.5 3
s TNFR1 (ng/ml)
L
D
L
-C
(
m
m
o
l/l)
C
r=0.34, p=0.05
2 3 4 5 6 7
2 3 4 5 6
s TNFR2 (ng/ml)
T
C
(
m
m
o
l/l)
D
r=-0.34, p=0.05
0 0.5 1 1.5 2 2.5
2 3 4 5 6
s TNFR2 (ng/ml)
H
D
L
-C
(
m
m
o
l/l)
E
r=0.39, p=0.024
1 1.52 2.53 3.54 4.5
2 3 4 5 6
s TNFR2 (ng/ml)
L
D
L
-C
(
m
m
o
l/l)
tors of plasma lipids and, in contrast to insulin, did not significantly change an association between BMI and car-diovascular risk factors [14].
Our data show, that TNFα is especially important in deter-mining plasma total cholesterol and its fractions in lean subjects. This effect is probably independent of insulin sensitivity. We observed that lean normoglycemic insulin-resistant offspring of type 2 diabetic subjects had higher plasma levels of sTNFR2 [26], and these levels are associ-ated with lower plasma adiponectin in that group [27]. When we analysed offspring and control group together, we observed similar correlations to those reported here. To exclude the effect of diabetes-prone genotype, only subjects with no family history of type 2 diabetes were recruited for the present study. Our findings provide fur-ther evidence that TNFα system might be involved in the pathogenesis of metabolic syndrome even before the onset of obesity and indicate that its metabolic actions may extend beyond inducing insulin resistance.
In obese subjects probably there are other factors, genetic or environmental (for instance nutrition), associated with the accumulation of body fat, that are more important in determining TC and its fractions than TNFα itself. It is likely that those factors could mask the TNFα effect on cholesterol metabolism. Insulin resistance, which is asso-ciated with TNFα overactivity in obesity, might also influ-ence lipid metabolism. Alternatively, TNFα may induce accelerated atherogenesis in obesity by other mecha-nisms. We demonstrated that plasma sTNFR2 increase in parallel with soluble intercellular adhesion molecule-1 (sICAM-1) [28] and interleukin 8 [29] in obese subjects. In the study of Elkind et al [30], both receptors predicted maximal carotid plaque thickness independently of LDL-C and other parameters, like BMI, diabetes or hyperten-sion.
Conclusion
We conclude that TNFα receptors are associated with plasma lipids in different way in lean and in obese sub-jects. TNFα system is probably important in determining cholesterol levels in lean subjects, while in obese this effect might be mediated by other metabolic abnormali-ties.
Abbreviations
Tumor necrosis factor α (TNFα)
Soluble tumor necrosis α receptor 1 (sTNFR1)
Soluble tumor necrosis α receptor 2 (sTNFR2)
Body mass index (BMI)
Total cholesterol (TC)
LDL – cholesterol (LDL-C)
Triglycerydes (TG)
Non – esterified fatty acids (NEFA)
HDL – cholesterol (HDL – C)
Sterol regulatory element binding protein 1 (SREBP)
Oral glucose tolerance test (OGTT)
Waist – to hip ratio (WHR)
Fat mass (FM)
Fat – free mass (FFM)
Hemoglobin A1c (HbA1c)
Soluble intercellular adhesion molecule – 1 (sICAM – 1)
Intra-assay and inter-assay coefficients of variation (CVs)
Competing interests
The author(s) declare that they have no competing inter-ests.
Authors' contributions
Marek Straczkowski and Irina Kowalska conceived and designed the study as well as statistical analysis and wrote the manuscript; Agnieszka Nikolajuk participated in the clamp studies and performed immunoassays; Agnieszka Adamska, Monika Karczewska – Kupczewska, Malgorzata Karolczuk-Zarachowicz, Agnieszka Kozlowska partici-pated in clinical part of the studies as well as in a clamp studies; Maria Gorska participated in design and coordi-nation of the study.
All authors read and approved the final manuscript.
References
1. Hotamisligil GS, Spiegelman BM: Tumor necrosis factor α: a key
component of the obesity-diabetes link. Diabetes 1994,
43:1271-1278.
2. Hotamisligil GS, Arner P, Caro JF, Atkinson RL, Spiegelman BM:
Increased adipose tissue expression of tumor necrosis
fac-tor-α in human obesity and insulin resistance. J Clin Invest 1995,
95:2409-2415.
3. Saghizadeh M, Ong JM, Garvey WT, Henry RR, Kern PA: The
expression of TNFα by human muscle. Relationship to
insu-lin resistance. J Clin Invest 1996, 97:1111-1116.
4. Hotamisligil GS, Arner P, Atkinson RL, Spiegelman BM: Differential regulation of the p80 tumor necrosis factor receptor in
human obesity and insulin resistance. Diabetes 1997,
Publish with BioMed Central and every scientist can read your work free of charge "BioMed Central will be the most significant development for disseminating the results of biomedical researc h in our lifetime."
Sir Paul Nurse, Cancer Research UK
Your research papers will be:
available free of charge to the entire biomedical community
peer reviewed and published immediately upon acceptance
cited in PubMed and archived on PubMed Central
yours — you keep the copyright
Submit your manuscript here:
http://www.biomedcentral.com/info/publishing_adv.asp
BioMedcentral
5. Aderka D, Engelmann H, Maor Y, Brakebusch C, Wallach D: Stabili-zation of the bioactivity of tumor necrosis factor by its
solu-ble receptors. J Exp Med 1992, 175:323-329.
6. Fernandez-Real JM, Broch M, Ricart W, Casamitjana R, Gutierrez C, Vendrell J, Richart C: Plasma levels of the soluble fraction of
tumor necrosis factor receptor 2 and insulin resistance.
Dia-betes 1998, 47:1757-1762.
7. Hube F, Birgel M, Lee YM, Hauner H: Expression pattern of tumor necrosis factor receptors in subcutaneous and omen-tal human adipose tissue: role of obesity and
non-insulin-dependent diabetes mellitus. Eur J Clin Invest 1999, 29:672-678.
8. Hauner H, Bender M, Haastert B, Hube F: Plasma concentrations
of soluble TNFα receptors in obese subjects. Int J Obesity 1998,
22:1239-1243.
9. Memon RA, Grunfeld C, Moser AH, Feingold KR: Tumor necrosis factor mediates the effects of endotoxin on cholesterol and
triglyceride metabolism in mice. Endocrinology 1993,
132:2246-2253.
10. Lawler JF Jr, Yin M, Diehl AM, Roberts E, Chatterjee S: Tumor necrosis factor-alpha stimulates the maturation of sterol regulatory element binding protein-1 in human hepatocytes
through the action of neutral sphingomyelinase. J Biol Chem
1998, 273:5053-5059.
11. Glenn CL, Wang WY, Benjafield AV, Morris BJ: Linkage and asso-ciation of tumor necrosis factor receptor 2 locus with hyper-tension, hypercholesterolemia and plasma shed receptor. Hum Mol Genet 2000, 9:1943-1949.
12. Benjafield AV, Wang XL, Morris BJ: Tumor necrosis factor recep-tor 2 gene (TNFRSF1B) in genetic basis of coronary artery
disease. J Mol Med 2001, 79:109-115.
13. Fernandez-Real JM, Gutierrez C, Ricart W, Castineira MJ, Vendrell J, Richart C: Plasma levels of the soluble fraction of TNFα receptors 1 and 2 are independent determinants of total and
LDL-cholesterol concentrations in healthy subjects.
Athero-sclerosis 1999, 146:321-327.
14. Chu NF, Spiegelman D, Hotamisligil GS, Rifai N, Stampfer M, Rimm
EB: Plasma insulin, leptin, and soluble TNF receptors levels in
relation to obesity-related atherogenic and thrombogenic
cardiovascular disease risk factors among men. Atherosclerosis
2001, 157:495-503.
15. DeFronzo RA, Tobin JD, Andres R: Glucose clamp technique: a
method for quantifying insulin secretion and resistance. Am
J Physiol 1979, 237:E214-E223.
16. Straczkowski M, Kowalska I, Nikolajuk A, Dzienis-Straczkowska S, Kinalska I, Baranowski M, Zendzian-Piotrowska M, Brzezinska Z, Gor-ski J: Relationship between insulin sensitivity and
sphingomy-elin signaling pathway in human skeletal muscle. Diabetes
2004, 53:1215-1221.
17. Straczkowski M, Kowalska I, Nikolajuk A, Krukowska A, Gorska M:
Plasma interleukin 10 concentration is positively related to
insulin sensitivity in young healthy individuals. Diabetes Care
2005, 28:2036-2037.
18. Duncombe WS: The colorimetric microdetermination of
non-esterified fatty acids in plasma. Clin Chim Acta 1964, 9:122-135.
19. Dzienis-Straczkowska S, Straczkowski M, Szelachowska M, Stepien A, Kowalska I, Kinalska I: Soluble tumor necrosis factor-α recep-tors in young obese subjects with normal and impaired
glu-cose tolerance. Diabetes Care 2003, 26:875-880.
20. Straczkowski M, Kowalska I, Dzienis-Straczkowska S, Stepien A, Skib-inska E, Szelachowska M, Kinalska I: Changes in tumor necrosis
factor-α system and insulin sensitivity during an exercise
training program in obese women with normal and impaired
glucose tolerance. Eur J Endocrinol 2001, 145:273-280.
21. Lopes-Virella M, Virella G: Cytokines, modified lipoproteins and
arteriosclerosis in diabetes. Diabetes 1996, 45(Suppl 3):40-44.
22. Brito BE, Romano EL, Grunfeld C: Increased lipopolysaccharide-induced tumour necrosis factor levels and death in
hyperc-holesterolemic rabbits. Clin Exp Immunol 1995, 101:357-361.
23. Henninger DD, Gerritsen ME, Granger DN: LDL receptor knock-out mice exhibit exaggerated microvascular responses to
inflammatory stimuli. Circ Res 1997, 81:274-281.
24. Geurts JMW, Janssen R, van Greevenbroek M, van der Kallen C, Can-tor R, Bu X, et al.: Identification of TNFRSF1B as a novel
modi-fier gene in familial combined hyperlipidemia. Hum Mol Genet
2000, 9:2067-2074.
25. Fernandez-Real JM, Molina A, Broch M, Ricart W, Gutierrez C, Casamitjana R, et al.: Tumor necrosis factor system activity is associated with insulin resistance and dyslipidemia in
myot-onic dystrophy. Diabetes 1999, 48:1108-1112.
26. Straczkowski M, Kowalska I, Stepien A, Dzienis-Straczkowska S, Szelachowska M, Kinalska I: Increased plasma soluble tumor
necrosis factor-α receptor 2 level in lean nondiabetic
off-spring of type 2 diabetic subjects. Diabetes Care 2002,
25:1824-1828.
27. Kowalska I, Straczkowski M, Nikolajuk A, Krukowska , Kinalska I, Gorska M: Plasma adiponectin concentration and TNFα sys-tem activity in lean nondiabetic offspring of type 2 diabetic
subjects. Eur J Endocrinol 2006, 154:319-324.
28. Straczkowski M, Lewczuk P, Dzienis-Straczkowska S, Kowalska I, Stepien A, Kinalska I: Elevated soluble intercellular adhesion molecule-1 levels in obesity: relationship to insulin resistance
and tumor necrosis factor-α system activity. Metabolism 2002,
51:75-78.
29. Straczkowski M, Dzienis-Straczkowska S, Stepien A, Kowalska I, Szelachowska M, Kinalska I: Plasma interleukin-8 concentrations are increased in obese subjects and related to fat mass and
tumor necrosis factor-α system. J Clin Endocrinol Metab 2002,
87(10):4602-4606.
30. Elkind MS, Cheng J, Boden-Albala B, Rundek T, Thomas J, Chen H, et
al.: Tumor necrosis factor receptor levels are associated with