Corresponding Author: Integrated Design Research Group (IDeA), Faculty of Mechanical Engineering, Universiti Teknikal Malaysia Melaka, Melaka, Malaysia
563
The Self-Reported Seat Discomfort Survey on Economy Class Aircraft Passenger in the
Netherlands
1Chee Fai Tan, 2W. Chen, 2G.W.M. Rauterberg, 1M.R. Said
1Integrated Design Group, Faculty of Mechanical Engineering, Universiti Teknikal Malaysia Melaka, Melaka, Malaysia
2Designed Intelligence Group, Department of Industrial Design, Eindhoven University of Technology, Eindhoven, the Netherlands
Abstract: The economy class aircraft passengers who experience long hour sitting during air travel has experienced significant body discomfort at neck, shoulder, lower back, upper leg and lower leg. The questionnaire was set out to study the relationship between different body back part discomfort and travel time of economy class aircraft passenger in order to rank the discomfort level for each body back part. There were one hundred and four anonymous self administered surveys were completed at Schiphol International Airport, the Netherlands. In line with the survey hypothesis, findings confirmed that the body discomfort of aircraft passenger after five hours travel is higher than after one hour travel. The body discomfort of economy class aircraft passenger is associated with flight duration. Further studies concerning how to best provide comfort to long haul economy class aircraft passengers are needed. The survey presented in this paper will beneficial the aircraft passenger seat designers to facilitate future design and evaluate seats that able to reduce body discomfort during long haul air travel.
Key words: Body discomfort, economy class, aircraft passenger, questionnaire.
INTRODUCTION
Air travel is becoming increasingly accessible to people both through the availability of cheap flights and because the airlines now are able to cater for individuals of all ages and disabilities. However, long haul air travel is not a natural activity for human. Many aircraft passengers experience different degree of physiological and psychological discomfort and even stress during flying. The aircraft passenger’s health may endanger by excessive stress that may cause passenger to become aggressive and over-reaction (Brundrett, 2001). A number of health problems can affect aircraft passengers. During the departure process, the aircraft passenger may experience anxiety that cause by overcrowded airport and complicated airport departure procedures. After the boarding into aircraft cabin, the aircraft passenger may experience discomfort that cause by environmental conditions such as humidity, pressure and noise. Besides, some aircraft passengers also feel discomfort during sitting where the passenger may affect by the seat location, seat position and sitting duration. During the long haul air travel across different time zone and irregular meal times may continuously affect the aircraft passenger health (WHO, 2007).
Comfort is an attribute that today’s passenger demand more and more. The aircraft passenger’s comfort depends on different features and the environment during air travel. Seat discomfort is a subjective issue because it is the customer who makes the final determination and customer evaluations are based on their opinions having experienced the seat (Runkle, 1994). The aircraft passenger seat has an important role to play in fulfilling the passenger comfort expectations. The seat is one of the important features of the vehicle and is the place where the passenger spends most of time during air travel. The aviation industry is highly competitive and therefore airlines try to maximize the number of seats (Quigley et al., 2001). Often this results in a very limited amount of seating space for passengers, especially in economy class Hinninghofen and Enck, 2006).
Long haul air economy class aircraft passengers are at risk of body discomfort for long sitting and experience discomfort at different body parts. This study was set out to examine the relationship between body discomfort and travel time for economy class aircraft passengers. There were 104 anonymous questionnaires completed at Schiphol International Airport, the Netherlands, from October through November 2008.
Seat Comfort and Discomfort:
564
(1997) noted that there is a difference between seating comfort and discomfort in office chairs. They described how comfort is related to emotional aspects like feeling safe and luxury. Their findings described that the physical aspects like feeling pressure and muscle pain is related to body discomfort.
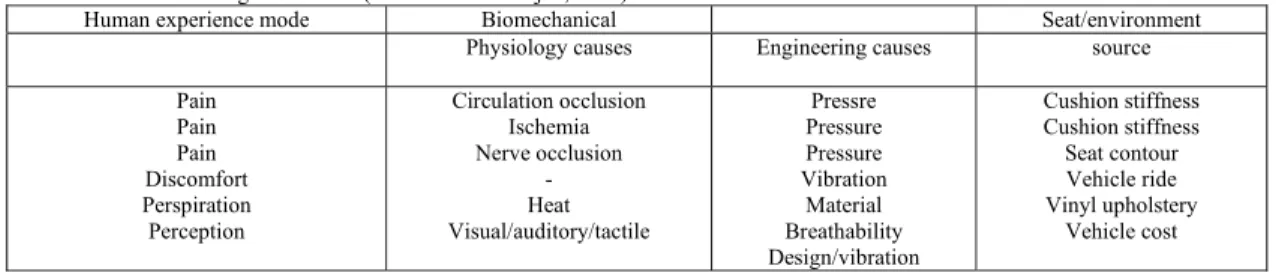
The concepts of comfort and discomfort in sitting are under debate. There is no widely accepted definition, although it is beyond dispute that comfort and discomfort are feelings or emotions that are subjective in nature (De Looze et al., 2003). Seating discomfort has been examined from a number of different perspectives. The problem with evaluating comfort in regards to pressure or any other factor is that, comfort is subjective and not easy to quantify. Seating discomfort varies from subject to subject and depends on the task at hand. Comfort, however, is a vague concept and subjective in nature. It is generally defined as lack of discomfort (Shen and Vertiz, 1997). Discomfort feelings, as described by Helander and Zhang (1997), is affected by biomechanical factors and fatigue. The sources of such discomfort are listed in Table 1.
Table 1: Causes of Seating Discomfort (Viano and Andrzejak, 1992).
Human experience mode Biomechanical Seat/environment
Physiology causes Engineering causes source
Pain Pain Pain Discomfort Perspiration Perception
Circulation occlusion Ischemia Nerve occlusion
- Heat Visual/auditory/tactile
Pressre Pressure Pressure Vibration
Material Breathability Design/vibration
Cushion stiffness Cushion stiffness Seat contour Vehicle ride Vinyl upholstery
Vehicle cost
Zhang (1996) presented a model that illustrates the interaction of comfort and discomfort as shown in Fig. 1. Transition from discomfort to comfort and vice versa are possible in the intersection of the axes. Hence, if discomfort is increased, such as with a longer time within task and fatigue, comfort will decrease. Its means that good biomechanics may not increase the level of comfort, it is likely that poor biomechanics turns comfort into discomfort.
Fig. 1: Hypothetical model of discomfort and comfort (Diagram reprinted from Zhang, 1996)
Subjective Measurement of Seat Comfort:
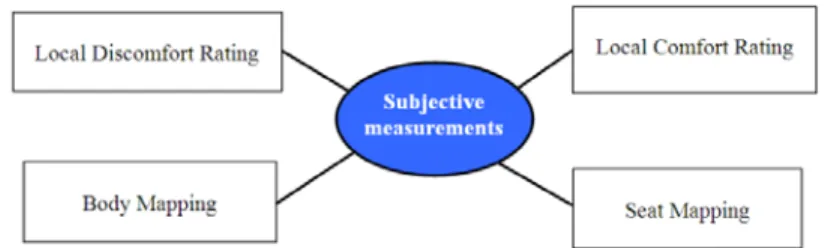
Kolich (2008) described that due to the lack of proven analytical metrics, vehicle manufacturers have opted to rely on subjective evaluations as the main indicator of seat comfort. The vehicle manufacturers developed elaborative subjective evaluation protocols that involved highly structured questionnaires. The questionnaires direct occupants to assign feelings of discomfort to a specific region of seat. The questionnaires, which typically contain numeric scales (e.g. 1 = very uncomfortable to 10 = very comfortable), produce subjective ratings that are translated into performance requirements/specifications (Mehta and Tewari, 2000). A properly designed questionnaire is paramount because it gives researchers an instrument from which to establish theories (Falou et al., 2003). Fig. 2 shows the overview of studies in relation to subjective measurements for seat comfort and discomfort.
Local discomfort ratings are used to measure the discomfort of subjects while sitting. According to Kolich (2008), many researchers have adopted Hertzberg (1972) definition because, in the current environment, it is more straightforward to quantify discomfort than to measure comfort. The local discomfort rating scale can be rate on a scale such as 1 to 10 or -10 to 10. Shen and Parsons (1997) used the category partitioning scale (CP50) for rating seated pressure intensity and perceived discomfort. There are sixteen studies related with local discomfort rating. Whereas there are six studies related to local comfort rating.
565
Fig. 2: Overview of studies related to subjective measurements for seat comfort and discomfort.
Method:
Questionnaire Development:
The objective of the questionnaire is to investigate the seating discomfort for economy class aircraft passengers over travel time. The questionnaire consists of three sections: (1) questions about the respondents’ air travel frequency per year, common flight duration and the travel class; (2) questions about their discomfort level for each body part after one hour and five hours flight; (3) questions about demographic background of respondents.
The questionnaire begins with a short, self-explanatory introduction in which the purpose and background of the survey are explained; it is also emphasized that data will be treated with confidentiality and analyzed in an anonymous manner. An example how to answer the question correctly is shown in the introduction part.
The respondents were asked to report on travel frequency in a four point scale (1 = 1 time, 2 = 2-5 times, 3 = 6-10 time, 4 = 11 times or more), common flight duration in a four point scale (1 = less than one hour, 2 = 2-5 hours, 3 = 6-10 hours, 4 = 11 hours or more) and the travel class in a three point scale (1 = economy class, 2 = business class, 3 = first class). The questionnaire was devised to identify the body part discomfort, to indicate the discomfort level for each defined body part after one hour and after five hours travel. In order to identify the body part discomfort level, a body mapping method is used. The body map and scales as shown in Fig. 3 were used for discomfort assessment. In this method, the perception of discomfort is referred to a defined part of the body. The subject is asked for the discomfort experiences during flight for each defined body part. Each subject is asked to assess the discomfort level using a five point Likert type scale. The scales are graded from ‘extremely discomfort’ to ‘normal’.
566
The Administration and Sampling of Questionnaire:
The questionnaire was completed by 104 aircraft passengers who were randomly sampled at Schiphol International Airport in the Netherlands. During the investigation, the investigator was approached the aircraft passengers and explained the purpose of the investigation in each occasion. The questionnaire with female body map was distributed to female respondents and the questionnaire with male body map was distributed to male respondents. Approximately 90% of invited aircraft passengers accepted to participate. Each aircraft passenger took between three to five minutes for self-completion.
RESULTS AND DISCUSSION
Demographics:
There were 104 respondents (50 females and 54 males) who completed the questionnaire. A wide range of ages was represented (17 to 75 years). The mean body mass index (BMI) (Mean (M) = 24.09, Standard deviation (SD) = 4.93) of the respondents was 24.09 kg/m2. The demographic details of the respondents are summarized in Table 2.
Table 2: Demographic details for 104 aircraft passengers who participated in the study.
Variable Range M SD Number of Data Points (N)
Age (years) 17-75 34.5 0 15.50 104
Weight (kg) 44-165 74.90 17.20 104
Height (m) 1.48-1.94 1.76 9.60 104
BMI (kg/m2) 18.4-58.5 24.10 4.90 104
Travel Information:
The travel frequency (M = 1.67, SD = 0.78) was categorized into ‘1 time’, ‘2-5 times’, ‘6-10 times’ and ‘11 times or more in a year’. Most respondents (46%) travelled at least ‘1 time’ in a year; 40% had travelled for ‘2-5 times’ per year, 10% had travelled for ‘6-10 times’ in a year and 3% indicated that they had travelled for ‘11 times or more’ in a year.
The travel duration (M = 2.63, SD = 0.85) of the respondents is measured between the origin airport and the final destination of the flight. For example, the average travel time of direct flight from Amsterdam Schiphol International Airport, the Netherlands to Kuala Lumpur International Airport, Malaysia is about 12 hours. Most of the respondents (46%) travelled ‘2 to 5 hours’ with aircraft, 32% between ‘6-10 hours’, 18% travelled ‘11 hours or more’ and only 3% travelled ‘less than one hour’. In the aircraft cabin, the seats were categorized into ‘first class’, ‘business class’ and ‘economy class’. From the result, 98 percent of respondents choose economy class as their first choice and two percent respondents travelled with ‘business class’. Due to none of the respondent travel in ‘first class’ and the small sample size of ‘business class’, they were not included for further analysis.
Factor Analysis on Body Part Discomfort Level:
A factor analysis on body part discomfort level was conducted for 104 respondents in relation to after one hour and after five hours of flight, to identify the underlying dimensions of the body part discomfort of economy class aircraft passengers. Scores on the 16 statements were submitted to principal components Factor Analysis with Varimax Rotation. A Scree-plot indicated that the eigenvalues started to level off after three factors. Thus, a three factor solution yielded the best solution.
After One Hour Travel:
For ‘after one hour flight’, the three factors explained 73% of the variance in the data. An overview of the composition of the three factors for body part discomfort after one hour flight is shown in Table 3. The first factor included five items that described the body discomfort at buttocks, upper leg (left and right) and lower leg (left and right). This factor appeared to reflect the lower body of the respondent. Therefore, it was labeled as ‘Lower body’. The second factor included four items. All four items described the body part, which are upper arm (left and right) and lower arm (left and right). The second factor was labeled as ‘Arm’. The third factor included seven items, namely head, neck, shoulder, left shoulder, right shoulder, upper back and lower back. The third factor was labeled as ‘Upper body’.
For the relationship between travel duration and body discomfort factors after one hour travel, a one way ANOVA method was used. There was a significant difference between travel duration and arm discomfort section after one hour travel (one-way ANOVA; F (4, 99) = 7.54, p < 0.001). The results showed that passengers who travel between 6 to 10 hours (M = 0.19, SD = 1.11) experienced highest body discomfort level at arm section.
567
gender and lower body discomfort section after one hour travel (one-way ANOVA; F (2, 101) = 11.12, p < 0.001). The results showed that males (M = 0.41, SD = 1.08) scored higher on body discomfort level at lower body section than females (M = -0.42, SD = 0.69).
To test the differences between ages with the body discomfort level after one hour travel, a correlation analysis was conducted. The results show that there is a significant correlation between age and arm discomfort section after one hour travel (Pearson’s r = 0.229, p < 0.05, two tailed). Older people feel more discomfort in their arm after one hour travel.
For the differences between BMI and body discomfort level after one hour travel, the correlation analysis show that there is a significant correlation between BMI and lower body discomfort section after one hour travel (Pearson’s r = 0.221, p < 0.05, two tailed). The results show that passenger with higher BMI feel more discomfort at the lower body after one hour travel.
After Five Hours Travel:
For ‘after 5 hours flight’, the three factors explained 74.04% of the variance in the data. An overview of the composition of the three factors for body part discomfort after five hours travel is shown in Table 4. There were four items labeled as ‘Arm’ in first factor. The first factor included left lower arm, left upper arm, right lower arm and right upper arm. The second factor included six items that described the body discomfort at neck, shoulder, left shoulder, right shoulder, upper back and lower back. This factor appeared to reflect the upper body of the respondent. The second factor was labeled as ‘Upper body’. The third factor included five items, namely buttocks, right lower leg, right upper leg, left lower leg and left upper leg. The third factor was labeled as ‘Lower body’.
To test the differences in travel frequency with body discomfort factors after five hours of travel, a one way ANOVA was conducted on the scores in the three body discomfort factors. Passengers who travel more than 11 times or more (M = 0.44, SD = 0.93) in a year experienced the highest body discomfort level at the upper body section. There is a marginally significance between travel frequency by aircraft and upper body section discomfort after 5 hours of flight (one-way ANOVA; F (4, 99) = 2.43, p = 0.05).
A one way ANOVA analysis is used to test the differences between gender and body discomfort factor after five hours travel. The result showed that there is a significant difference between gender with upper body discomfort factor (one-way ANOVA; F (2, 101) = 4.27, p <0.01) and the lower body back discomfort factor (one-way ANOVA; F (2, 101) = 5.58, p <0.01) after five hours flight. For the upper body discomfort factor, female respondents (M = -0.28, SD = 1.03) scored higher discomfort levels than male respondents (M = -0.25, SD = 0.91). For the lower body discomfort factor, male respondents (M = 0.31, SD = 0.95) scored higher discomfort levels than female respondents (M = -0.32, SD = 0.96).
Table 3: Results of factor analysis of body part discomfort after one hour travel. Factor
No. Body part Lower body Arm Upper body N
1 Right lower leg 0.910 104
2 Right upper leg 0.902 104
3 Left upper leg 0.896 104
4 Left lower leg 0.890 104
5 Buttocks 0.716 0.405 104
6 Right upper arm 0.902 104
7 Left upper arm 0.880 104
8 Right lower arm 0.763 104
9 Left lower arm 0.739 104
10 Neck 0.831 104
11 Shoulder 0.772 104
12 Lower back 0.683 104
13 Upper back 0.428 0.659 104
14 Right shoulder 0.568 0.612 104
15 Left shoulder 0.568 0.612 104
16 Head 0.588 104
Explained variance 46.76% 14.41% 11.58%
Cronbach’s Alpha 0.950 0.890 0.860
Note: Only factor loadings > 0.580 are selected
The Body Discomfort Ranking After 1 Hour and After 5 Hours Travel:
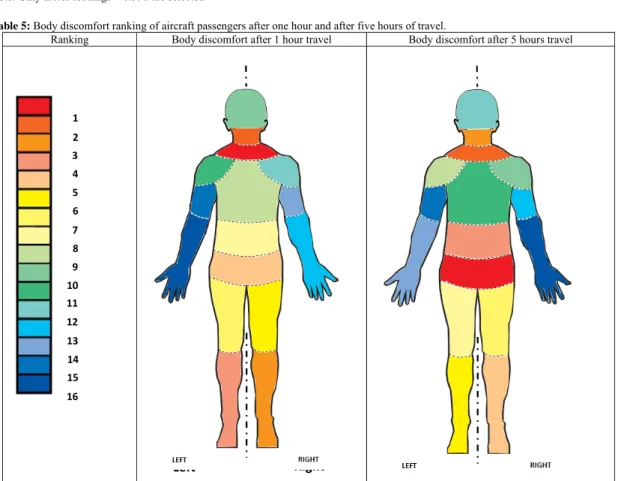
The nonparametric Friedman test was used to test the mean rank of the sixteen body parts. For each body part, the sixteen body parts were ranked from 1 to 16 based on body discomfort rating score. The test statistic is based on these ranks. From the result of body discomfort after one hour travel, it showed that shoulder (MR = 10.57) exhibited the highest discomfort ranking. It was followed by neck (MR = 10.37) and right lower leg (MR = 10.29). The difference in medians among 16 body discomfort after one hour travel, is significant χ2 (15,
568
(MR = 10.74) was ranked as the highest discomfort level after five hours travel. It was followed by shoulder (MR = 10.24) and neck (MR = 10.15). The difference in medians among 16 body discomfort after one hour travel, is significant χ2 (15, N = 104) = 312.93, p < 0.001. Univariate analysis of variance was conducted to find the differences of body discomfort level between after one hour travel and after five hours travel. The results showed the body discomfort level after five hours travel was higher than after one hour travel. The detailed comparison between body discomfort ranking after one hour travel and after five hours travel is shown in Table 5.
Table 4: Results of factor analysis of body part discomfort after five hours travel. Factor
No. Body part Lower body Arm Upper body N
1 Left lower arm 0.904 104
2 Left upper arm 0.881 104
3 Right lower arm 0.869 104
4 Right upper arm 0.829 104
5 Head 0.489 104
6 Shoulder 0.866 104
7 Neck 0.843 104
8 Lower back 0.800 104
9 Upper back 0.671 104
10 Left shoulder 0.550 0.648 104
11 Right shoulder 0.585 0.603 104
12 Right lower leg 0.904 104
13 Left lower leg 0.879 104
14 Right upper leg 0.838 104
15 Left upper leg 0.805 104
16 Buttocks 0.428 0.593 104
Explained variance 47.10% 15.48% 11.46%
Cronbach’s Alpha 0.940 0.890 0.900
Note: Only factor loadings > 0.590 are selected
Table 5: Body discomfort ranking of aircraft passengers after one hour and after five hours of travel.
Ranking Body discomfort after 1 hour travel Body discomfort after 5 hours travel
The paper describes a study to investigate the relationship between body discomfort and travel time of economy class aircraft passengers. The majority of respondents travelled with economy class during air travel. Most respondents travelled at least once per year and travel time between two to five hours. With respect to
Bod
y
Discomfort
rank
1
2 3
4 5
6
7 8
9 10 11
12 13
14 15
16
569
travel duration, passengers who travelled more than five hours reported highest body discomfort level. Male respondents felt higher body discomfort level at lower body section than female respondents.
The body discomfort parts after one hour and after five hours travel were grouped into same meaningful factors e.g. ‘lower body’, ‘arm’ and ‘upper body’. For ‘after one hour travel’, respondents who normally travel between six to ten hours feel most discomfort at their arm section. For lower body section, male respondents feel more discomfort than female respondents. On the other hand, older aircraft passengers felt that their arm was more discomfort after one hour flight. The passengers with higher BMI reported that their lower body section is more discomfort after one hour flight. There were different levels of body discomfort for economy class aircraft passenger after one hour travel. The most discomfort body part for economy class aircraft passenger after one hour travel is the shoulder; it is followed by the neck and right lower leg. For body discomfort after five hours travel, passengers who travel more than 11 times or more per year experienced highest body discomfort level at upper body section. Female respondents feel more discomfort than male respondents at upper body section. In contrast, male respondents feel more discomfort than female respondents at lower body section. The study found that buttock is the most discomfort body part after five hours travel; it is followed by the shoulder and neck.
Conclusion:
In this paper, the study on economy class aircraft passenger body discomfort level for after one hour travel and after five hours travel, especially with regard to flight frequency, flight duration and gender are described. 104 respondents were filled up the questionnaire about body discomfort after one hour and after five hours travel. In line with the survey hypothesis, findings concluded that the body discomfort of aircraft passenger after five hours travel is higher as compare to after one hour travel. The study was confirmed that the body discomfort of economy class aircraft passengers was associated with flight duration. The male aircraft passenger is more discomfort than the female aircraft passenger at lower body section after one hour and after five hours of travel. The finding also showed that the neck is one of the top three most discomfort body part after one hour and after five hours of travel. The result of the study on body discomfort of economy class aircraft passenger demonstrates the need for a system to improve the comfort during air travel.
ACKNOWLEDGMENT
The authors are very much in-debt to thank the Ministry of Higher Education Malaysia (MOHE) for awarding a research grant (ERGS/2012/FKM/TK01/02/1/E0003) which enabled the progressing of this critical research. Special thanks to the top level management of Universiti Teknikal Malaysia Melaka (UTeM), including Centre for Research and Innovation Management (CRIM) and Faculty of Mechanical Engineering administrators.
REFERENCES
Brundrett, G., 2001. Comfort and health in commercial aircraft: a literature review. The Journal of The Royal Society for the Promotion of Health, 121(1): 29-37.
De Looze, M.P., L.F.M. Kuijt, J.V. Eversand Dieen, 2003. Sitting comfort and discomfort and the relationship with objective measures. Ergonomics, 46(10): 985-997.
Falou, E.W., J. Duchêne, M. Grabisch, David Hewson, Yves Langeron, F. Lino, 2003. Evaluation of Driver Discomfort during Long-Duration Car Driving. Journal of Applied Ergonomics, 34(3): 249-255.
Helander, M.G., L. Zhang, 1997. Field Studies of Comfort and Discomfort in Sitting. Ergonomics, 20(9): 865-915.
Helander, M.G., 2003. Forget about ergonomics in chair design? Focus on aesthetics and comfort! Ergonomics, 46(43/14): 1306-1319.
Hertzberg, H.T.E., 1972. The human buttocks in sitting: pressures, patterns, and palliatives. SAE Technical Paper, no. 72005.
Hinninghofen, H., P. Enck, 2006. Passenger well-being in airplanes. Auton Neurosci, 129(1-2): 80-85. Kalogeropoulos, S., 1998. Sky rage. Flight Safety Australia, 36-37.
Kolich, M., 2008. Review: A conceptual framework proposed to formalize the scientific investigation of automobile seat comfort. Applied Ergonomics, 39(1): 15-27.
Kyung, G., M.A. Nussbaum and K. Babski-Reeves, 2008. Driver sitting comfort and discomfort (part I): Use of subjective ratings in discriminating car seats and correspondence among ratings. International Journal of Industrial Ergonomics, 38(5-6): 516-525.
Mehta, C.R., V.K. Tewari, 2000. Seating Discomfort for Tractor Operators- A Critical Review. International Journal of Industrial Ergonomics, 25: 661-674.
570
Runkle, V.A., 1994. Benchmarking seat comfort. SAE Technical Paper, No. 940217.
Shen, W., K.C. Parsons, 1997. Validity and reliability of rating scales for seated pressure discomfort. International Journal of Industrial Ergonomics, 20: 441-461.
Shen, W., A. Vertiz, 1997. Redefining seat comfort. SAE Technical Paper, no. 970597.
Viano, D.C., D.V. Andrzejak, 1992. Research Issues on the Biomechanics of Seating Discomfort: an Overview with Focus on Issues of the Elderly and Low-Back Pain. SAE Technical Paper, no. 920130.
World Health Organization, 2007. Travel by air: health considerations. World Health Organization’s. http://whqlibdoc.who.int/ publications/2005/ 9241580364_chap2.pdf.