Durham Research Online
Deposited in DRO:
18 July 2017
Version of attached le:
Published Version
Peer-review status of attached le:
Peer-reviewed
Citation for published item:
Gentile Fusillo, N. P. and Raddi, R. and Gansicke, B. T. and Hermes, J. J. and Pala, A. F. and Fuchs, J. T. and Chehade, B. and Metcalfe, N. and Shanks, T. (2017) 'A catalogue of white dwarf candidates in VST ATLAS.', Monthly notices of the Royal Astronomical Society., 469 (1). pp. 621-629.
Further information on publisher's website:
https://doi.org/10.1093/mnras/stx777Publisher's copyright statement:
This article has been accepted for publication in Monthly Notices of the Royal Astronomical Society c2017 The Authors. Published by Oxford University Press on behalf of the Royal Astronomical Society
Additional information:
Use policy
The full-text may be used and/or reproduced, and given to third parties in any format or medium, without prior permission or charge, for personal research or study, educational, or not-for-prot purposes provided that:
• a full bibliographic reference is made to the original source
• alinkis made to the metadata record in DRO
• the full-text is not changed in any way
The full-text must not be sold in any format or medium without the formal permission of the copyright holders. Please consult thefull DRO policyfor further details.
Durham University Library, Stockton Road, Durham DH1 3LY, United Kingdom Tel : +44 (0)191 334 3042 | Fax : +44 (0)191 334 2971
Advance Access publication 2017 March 29
A catalogue of white dwarf candidates in VST ATLAS
Nicola Pietro Gentile Fusillo,
1‹Roberto Raddi,
1Boris T. G¨ansicke,
1J. J. Hermes,
2†Anna F. Pala,
1Joshua T. Fuchs,
2Ben Chehade,
3Nigel Metcalfe
3and Tom Shanks
3 1Department of Physics, University of Warwick, Coventry CV4 7AL, UK2University of North Carolina, Chapel Hill, NC 27599-3255, USA
3Department of Physics, Durham University, South Road, Durham DH1 3LE, UK
Accepted 2017 March 24. Received 2017 March 23; in original form 2017 January 21
A B S T R A C T
The Sloan Digital Sky Survey (SDSS) has created a knowledge gap between the Northern and the Southern hemispheres, which is very marked for white dwarfs: Only15 per cent of the known white dwarfs are south of the equator. Here, we make use of the VLT Survey Telescope (VST) ATLAS survey, one of the first surveys obtaining deep, optical, multiband photometry over a large area of the southern skies, to remedy this situation. Applying the colour and proper-motion selection developed in our previous work on SDSS to the most recent internal data release (2016 April 25) of VST ATLAS, we created a catalogue of4200 moderately bright (g≤19), high-confidence southern white dwarf candidates, which can be followed up individually with both the large array of southern telescopes or in bulk with ESO’s forthcoming multi-object spectrograph 4MOST.
Key words: catalogues – surveys – proper motions – white dwarfs.
1 I N T R O D U C T I O N
White dwarfs are the final stage of the evolution of stars with main sequence massesM >0.8 and M 8–10 M (Iben, Ritossa & Garcia-Berro1997), a range that includes the vast majority of all stars. White dwarfs are therefore key tracers of the evolutionary his-tory of the Galaxy (e.g. Torres et al.2005; Tremblay et al.2014) and significant contributors to the global stellar population. However, to fully exploit the diagnostic potential of the Galactic white dwarf population, it is necessary to reliably constrain fundamental param-eters such as their space density (Holberg, Oswalt & Sion2002; Holberg et al.2008; Giammichele, Bergeron & Dufour2012; Sion et al.2014), mass distribution (Bergeron, Saffer & Liebert1992; Liebert, Bergeron & Holberg2005; Falcon et al.2010; Tremblay et al.2013, 2016) and luminosity function (Catal´an et al.2008; Giammichele et al.2012; Rebassa-Mansergas et al.2015). These studies require large, homogeneous and well-defined samples that, given the intrinsic low luminosity of white dwarfs, are still chal-lenging to be assembled.
Large samples of white dwarfs are also the starting point in searches for rare sub-types like magnetic white dwarfs (G¨ansicke, Euchner & Jordan2002; Schmidt et al.2003; K¨ulebi et al.2009; Kepler et al.2013; Hollands, G¨ansicke & Koester2015), pulsat-ing white dwarfs (Castanheira et al. 2004; Greiss et al. 2014; Gentile Fusillo, Hermes & G¨ansicke 2016, see Section 6.4),
E-mail:[email protected] †Hubble Fellow.
622
N. P. Gentile Fusillo et al.
Figure 1. Sky distribution of the39 000 white dwarfs confirmed to date. Only∼15 per cent of them are located below the equator.
Table 1. Summary of the white dwarf candidate selection in ATLAS.
ATLAS objects in initial colour cut 12 359 Of which with no proper motion 952 Magnitude limit of final sample g≤19 Final sample of white dwarf candidates (Section 5) 11 407 High confidence white dwarf candidates (PWD≥0.41) 4200 Also in Gentile Fusillo et al. (2015a) catalogue
of SDSS white dwarf candidates 879 Of which confirmed white dwarfs 130 Of which confirmed contaminants 171
traditional colour-cuts to VPHAS+photometry (Raddi et al.2016). Here, we present a catalogue of 11 407colour-selected sources from ATLAS for which we calculatedprobabilities of being white dwarfs
(PWD) according to the method described in Gentile Fusillo et al. (2015a). ThePWDvalues allow for selection of ATLAS white dwarf candidates with flexible efficiency and completeness, from which we estimate the catalogue to contain≈4100 genuine white dwarfs (Table1).
In the following two sections, we briefly summarize the ATLAS survey and describe the properties of the photometric system, and how it compares to SDSS photometry. In Section 4, we briefly outline the methodology used to combine photometry and proper motions to calculatePWDvalues. The catalogue of white dwarf can-didates is presented in Section 5. The completeness of the catalogue and the spectroscopic confirmation of some white dwarf candidates are discussed in Section 6. The last section is dedicated to our conclusions.
2 V S T AT L A S
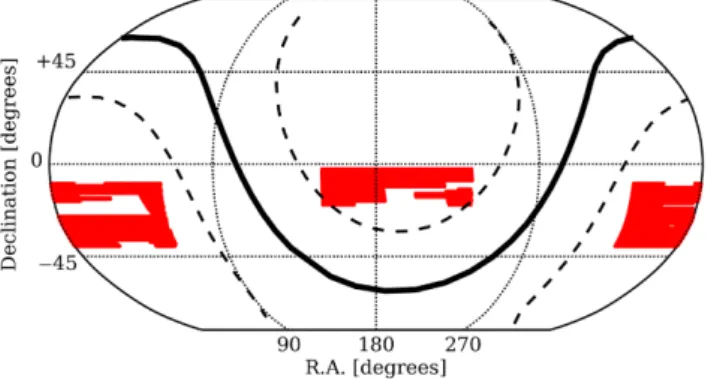
VST ATLAS is primarily a cosmology-focused survey aiming to image 4700 deg2 of the Southern Sky at high galactic latitudes (|b|>30◦) in five bands (ugriz) to comparable depths to the SDSS in the north. The ATLAS footprint is divided into two contiguous blocks in the North and South Galactic Caps (NGC, SGC). The ATLAS SGC area lies in the ranges 21h30m<RA<04h00mand −40◦ < Dec.< − 10◦, whilst the NGC area lies in the ranges 10h00m<RA<15h30mand−20◦<Dec.<−2.5◦plus 10h00m
<RA<15h00mand−30◦<Dec.<−20◦(Fig.2).
The survey is carried out at the 2.6-m VST, located at Cerro Paranal in Chile. The telescope mounts at the prime focus a 1 deg2 wide imaging instrument, the OmegaCAM (Kuijken2011), which consists of 32 CCDs of 4k× 2k pixels each. The narrow gaps between the individual CCDs allow for an overall geometric filling
Figure 2. Footprint of the sky area covered in all five filters (ugriz) by ATLAS at the time of the internal data release of 2016 April 25. The solid black line indicates the location of the galactic plane and the dashed lines indicate regions±30◦from it.
factor of 91.4 per cent (see Shanks et al.2015, for more details). The ATLAS band-passes are similar to those of the SDSS filters. Observations are taken in pairs for each filter and exposure times of 60 s foru, 50 s forgand 45 s forr,iandz. The imaging data is reduced by the Cambridge Astronomical Survey Unit using the VST data flow software. Images are trimmed and de-biased using nightly calibration frames and then flat-fielded using accumulated monthly stacked twilight sky flats. The frames are then corrected for cross-talk and de-fringed, if necessary. The resulting imaging data comprise the combination of the two individual images for each of the original CCDs (Shanks et al.2015). For the analysis presented here, we used the latest internal data release available on 2016 April 25. This release includes coverage in all five filters and photometric quality flags for2400 deg2of the sky, surpassing the publicly available Data Release 3.
3 AT L A S V E R S U S S D S S
VST ATLAS uses the same optical filters as SDSS (ugriz) and in many ways aims to be the Southern hemisphere counterpart of SDSS. However, though the filter systems are nominally the same, the actual filter transmission curves have small differences, the de-tectors are not the same, the observing conditions at the telescope sites are different, and the flux calibration is conducted in different ways. As a result, ATLAS and SDSS magnitudes, and therefore colours, are not perfectly equivalent. As part of their re-calibration of ATLAS photometry to the AB system, Shanks et al. (2015) car-ried out a detailed comparison of SDSS and ATLAS photometry. ATLAS and SDSS overlap over an equatorial region of300 deg2 covering parts of both the NGC (10hRA15h30m;−3.5◦ Dec.−2◦) and the SGC (22h40m RA 3h;−11◦ Dec.
−9◦). Shanks et al. (2015) used the objects in the NGC over-lapping region to develop a set of colour-dependent equations to convert ATLAS (AB) magnitude in equivalent SDSS magnitudes:
uSDSS =uATLAS+0.01×(u−g)+0.27,
gSDSS =gATLAS+0.05×(g−r)−0.06,
rSDSS =rATLAS+0.03×(g−r)−0.035,
iSDSS =iATLAS−0.025,
zSDSS =zATLAS−0.04×(i−z)+0.04. (1)
Since our selection method for white dwarf candidates makes use of a probability map in reduced proper motion–colour space that was initially developed from SDSS data (see Section 5), it is of
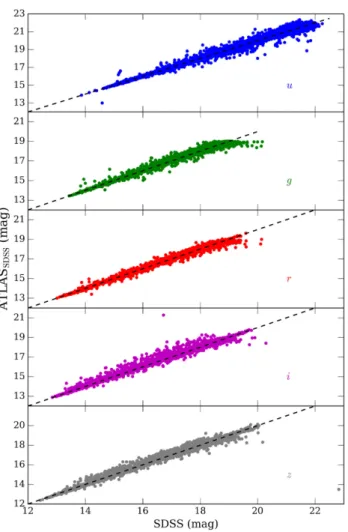
Figure 3. Comparison of ATLASSDSSand SDSS magnitudes for a sample of112 000 point sources. The dashed black lines indicate a 1:1 relation-ship. The comparison objects were chosen as SDSS objects with clean photometry.
paramount importance to have reliable SDSS-equivalent ATLAS magnitudes (ATLASSDSS from here on). In order to evaluate the robustness of the magnitude transformations developed by Shanks et al. (2015), in particular their applicability to blue objects, we carried out some further comparison with SDSS. We retrieved the available SDSS photometry of all ATLAS sources in the overlapping regions with cleang≤19.5 SDSS photometry (112 000 objects). We then applied equation (1) to the ATLAS photometry and com-pared the ATLASSDSS magnitudes with the SDSS ones (Fig.3). We find that the mean values of SDSS–ATLASSDSSmagnitudes for the objects in our overlapping samples are:u=0.0109±0.0003,
g=0.0089±0.0001,r=0.0086±0.0001,i=0.0098±0.0002,
z=0.011±0.0003. These mean differences are smaller than the typical uncertainties in the SDSS and ATLAS magnitude. We there-fore conclude that ATLASSDSSmagnitudes are, for most intents and purposes, equivalent to SDSS ones, and our selection method for white dwarf candidates (Gentile Fusillo et al.2015a) can be directly applied to them.
4 C O L O U R S E L E C T I O N A N D P R O P E R M OT I O N S
Using the free formSQLquery tool available on the OmegaCAM Science Archive webpage, we retrieved photometry for all ATLAS
sources that have been observed in all five filters, marked as ‘stel-lar’ or ‘probable stel‘stel-lar’ and with no ‘important’1 quality issue (Table2). We then applied the magnitude conversions described by equation (1) to calculate ATLASSDSS magnitudes for all our sources. The first step in our photometric selection method for white dwarf candidates involves applying a set of colour constraints that broadly select all blue sources (Table3). These colour-cuts are designed to include all white dwarfs withTeff 7000 K and are required to reduce the initial sample to a more manageable size, but they are not sufficient to eliminate contamination from QSO and other blue objects (i.e. sub-dwarfs, A stars; for more details see Gentile Fusillo et al.2015a). This initial broad colour selection re-sulted in a sample of 12 359 blue ATLAS sources. ATLAS does not provide proper-motion measurements, thus we decided to retrieve those from the recently published Absolute Proper motions Out-side the Plane (APOP, Qi et al. 2015) catalogue. APOP proper motions are calculated from carefully re-reduced photographic plates from the STScI Catalog of Objects and Measured Parameters from All-Sky Surveys (COMPASS) archive of the GSC-II project (Lasker & STSCI Sky-Survey Team 1998). APOP covers 22 525 deg2and provides proper motions for 100 774 153 objects to the limiting magnitude of R20.8 with typical uncertainties ranging between 4 and 9 mas yr−1. However, the astrometry of APOP and ATLAS corresponds to observations taken several years apart and most white dwarfs have high proper motions, typically ranging from 20 to 200 mas yr−1. White dwarfs can therefore move significantly over a few years to decades and a simple cross match between ATLAS and APOP using a fixed matching radius can easily lead to several mis-matches or missing objects.
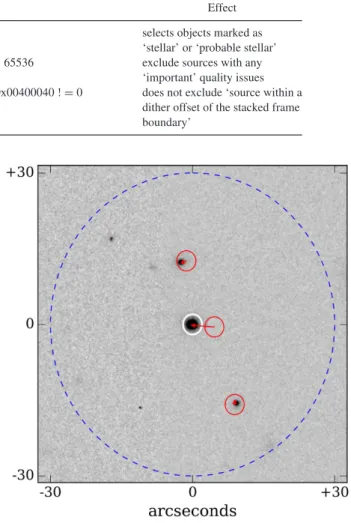
We therefore divided our cross-matching procedure in three sepa-rate steps. For each ATLAS object, we first retrieved every matching APOP source within a radius of 30 arcsec (typically four to eight ob-jects) and compared the modified Julian date (MJD) of the ATLAS observation with that of APOP (by definition at epoch J2000 so MJD 51544). We defined an epoch differencet=MJDATLAS−51544 and then used the proper motions and J2000 positions from APOP to compute predicted positions at the epoch of the ATLAS imag-ing for all objects in the first cross-match (Fig.4). This coordinate ‘forward projection’ is carried out according to
α=αAPOP+
μα
cos(δAPOP)
× t
365.25, (2)
δ=δAPOP+μδ× t
365.25, (3)
whereμαandμδare the objects proper motions in right ascension
and declination, respectively. Finally, we consider a true match to be the closest object whose forward projected coordinates fall within 2 arcsec of the ATLAS ones. In cases where more than one matching object is found within 2 arcsec (a few tens within the entire sample), we select the best match by visually inspecting the magnitudes of the matching pairs and their angular separation.
Following this procedure, we obtained proper motions for 11 407 objects. The most likely explanation for the 952 ATLAS objects for which we could not find a counterpart in APOP is that they could not be reliably matched up on the photographic plates used by APOP.
624
N. P. Gentile Fusillo et al.
Table 2. SQL casjob flags used to select ATLAS point sources with reliable photometry from the OmegaCAM Science Archive webpage.
Constraint Effect
(mergedClass=–1) OR (mergedClass=–2) selects objects marked as ‘stellar’ or ‘probable stellar’ AND (uppErrBits|gppErrBits|rppErrBits|ippErrBits|zppErrBits)<65536 exclude sources with any
‘important’ quality issues OR (uppErrBits|gppErrBits|rppErrBits|ippErrBits|zppErrBits) & 0x00400040 !=0 does not exclude ‘source within a
dither offset of the stacked frame boundary’
Table 3. Equations describing the colour and magnitude constraints used to select sources in the ATLAS footprint. The colour cuts were applied to the ATLAS magnitudes after converting them into SDSS equivalent ones.
Colour Constraint
(u−g) ≤ 3.917×(g−r)+2.344 (u−g) ≤ 0.098×(g−r)+0.721 (u−g) ≥ 1.299×(g−r)−0.079
(g−r) ≤ 0.450
(g−r) ≥ 2.191×(r−i)−0.638 (r−i) ≤ −0.452×(i−z)+0.282
g ≤ 19
5 W H I T E DWA R F C A N D I DAT E S S E L E C T I O N
In order to identify reliable white dwarf candidates among ATLAS sources, we rely on the photometric selection method presented in Gentile Fusillo et al. (2015a) that can be used to assign a ‘probability of being a white dwarf’ (PWD) to any object with available multiband photometry and proper motion. In this section, we briefly summarize the details of the selection method; for a full description refer to Gentile Fusillo et al. (2015a). ThePWDvalues rely on a probability map that traces the distribution of spectroscopically confirmed white dwarfs and contaminant objects selected from SDSS in colour and reduced proper motionHcomputed as
Hg=g+5 logμ+5, (4)
whereμis the proper motion in arcsec yr−1. This probability map effectively traces which areas in colour-Hspace are more likely populated by either white dwarfs or contaminants. In our work on SDSS photometry, we determined that the strongest discrimination between white dwarfs and contaminants is obtained in theg−z,Hg space, which we therefore adopted for our selection method. The final map was constructed using a training sample of over 27 000 objects (different types of white dwarfs, quasars and stellar con-taminants) that were classified by visual inspection of their SDSS spectra. By combining the (g−z,Hg) position of a test object with this probability map, we can compute a quantity that directly indi-cates how likely it is for the object to be a white dwarf, in other words our PWD. We have shown above that ATLASSDSS magni-tudes are equivalent to the SDSS ones. We therefore calculatedHg for all ATLAS objects using the ATLASSDSSmagnitudes and the APOP proper motions, and directly applied the Gentile Fusillo et al. (2015a) selection method to calculatePWDfor all 11 407 ATLAS sources in our sample. In Table4, we summarize the content of our final catalogue of ATLAS white dwarf candidates.
We also performed a cross-match of our catalogue with theGaia
DR1 source catalogue (Gaia Collaboration et al.2016) and pro-videGaiasource ID andG-band mean magnitude for all matching sources.Gaiais able to resolve objects with a sky separation of
Figure 4. ATLASg-band image centred at the position of one of our white dwarf candidates. The blue circle represents the 30 arcsec radius area used for the first cross-match with APOP. 2 arcsec radius circles are shown centred on the J2000 APOP coordinates of all matching sources in the initial cross-match and the red arrows indicate how the objects moved between J2000 and the ATLAS epoch of observation. The white circle indicates the final 2 arcsec matching radius around the ATLAS source.
0.23 arcsec (de Bruijne et al.2015), a resolution much higher than what is achievable by VST ground based observations. As a result, we found two ATLAS objects (ATLASJ235435.65−290704.08 and ATLASJ121100.93−075241.23) that were each matched to two
Gaiasources both with an angular separation of<1 arcsec. These objects are likely to be binary systems that were resolved with
Gaia, but not in ATLAS. ATLASJ121100.93−075241.23 could be of particular interest being a relatively bright white dwarf candidate (PWD = 0.71,g= 15.9) with a potential faint close companion (G=18.4). Out of the five ATLAS bands, we find thatris the one closest toGaia Gparticularly for sources withg−r≥0 where the mean differenceG-ris 0.12 mag.
6 D I S C U S S I O N
6.1 Comparison with SDSS
In Gentile Fusillo et al. (2015a), we used an independent sample of spectroscopically confirmed white dwarfs and contaminants from SDSS DR9 and DR10 and later LAMOST DR3 (Gentile Fusillo
Table 4. Format of the catalogue of VST ATLAS white dwarfs candidates. The full catalogue can be accessed online via VizieR.
Column no. Heading Description
1 VST ATLAS name ATLAS objects name (ATLAS+J2000 coordinates) 2 ATLAS ID Unique ID identifying the photometric source in ATLAS
3 ra Right ascension
4 dec Declination
5 PWD Theprobability of being a WDcomputed for this object
6 umag ATLASu-band magnitude
7 umag err ATLASu-band magnitude uncertainty
8 gmag ATLASgband magnitude
9 gmag err ATLASg-band magnitude uncertainty
10 rmag ATLASrband magnitude
11 rmag err ATLASr-band magnitude uncertainty
12 imag ATLASi-band magnitude
13 imag err ATLASi-band magnitude uncertainty
14 zmag ATLASz-band magnitude
15 zmag err ATLASz-band magnitude uncertainty 16 MJD Modified julian date of ATLAS observation 17 pmra APOP proper motion in right ascension (mas yr−1)
18 pmra err APOP proper motion in right ascension uncertainty (mas yr−1) 19 pmdec APOP proper motion in declination (mas yr−1)
20 pmdec err APOP proper motion in declination uncertainty (mas yr−1)
21 human class Classification of the object based on inspection of its available spectrum (section 6.2) 22 Simbad type1 Currently available primary Simbad classifications
23 Simbad type2 Currently available secondary Simbad classifications
24 Gaia ID GaiaDR1 source ID
25 Gmag GaiaDR1G-band mean magnitude
et al.2015b) to demonstrate the efficiency of the selection method and the completeness of our catalogue of SDSS white dwarf candi-dates. However, similarly large spectroscopic samples do not exist for the Southern hemisphere and therefore we cannot test in the same way the robustness of the selection method when applied to ATLAS photometry. None the less, as a result of the overlap of ATLAS with SDSS, 879 objects appear in both the Gentile Fusillo et al. (2015a) catalogue of SDSS white dwarf candidates and in the ATLAS catalogue presented here. This sample includes 130 white dwarfs and 171 contaminants confirmed by SDSS spectroscopy (as of SDSS DR12 Alam et al.2015) that enable us to carry out some valuable tests on the ATLAS sample of white dwarf candidates.
Fig.5shows that the vast majority of the 130 white dwarfs have
PWD(ATLAS)>0.8 while over 85 per cent of the 171 contaminants havePWD (ATLAS)< 0.2. Though this test is limited to small sample sizes, it is evident that thePWDcalculated from ATLAS and APOP data provide a clear discrimination between white dwarfs and contaminants.
Using the same spectroscopic sample, we can also calculate that a confidence cut that includes all ATLAS objects withPWD≥0.41 results in a 96 per cent completeness and 87 per cent efficiency in selecting white dwarfs. These numbers are very similar to those ob-tained from the catalogue of SDSS white dwarf candidates (Gentile Fusillo et al.2015a) when applying the same cut inPWD. We also compared the surface density of ATLAS and SDSS white dwarf can-didates withPWD≥0.41, and for both samples, we find an average of1.8 objects per deg2. These results suggest that our catalogue of ATLAS white dwarf candidates should be as complete and reliable as the SDSS catalogue presented in Gentile Fusillo et al. (2015a).
The common ATLAS and SDSS white dwarf candidates also allow us to directly compare PWD values calculated using AT-LAS and APOP with those calculated using SDSS data. We find that the PWD values are largely consistent with an aver-age difference |PWD(ATLAS) − PWD(SDSS)| = 0.042 ± 0.03.
Figure 5. Distribution of 301 spectroscopically confirmed white dwarfs (blue) and contaminants (red, shaded) from the SDSS and ATLAS overlap sample as a function ofPWD.
626
N. P. Gentile Fusillo et al.
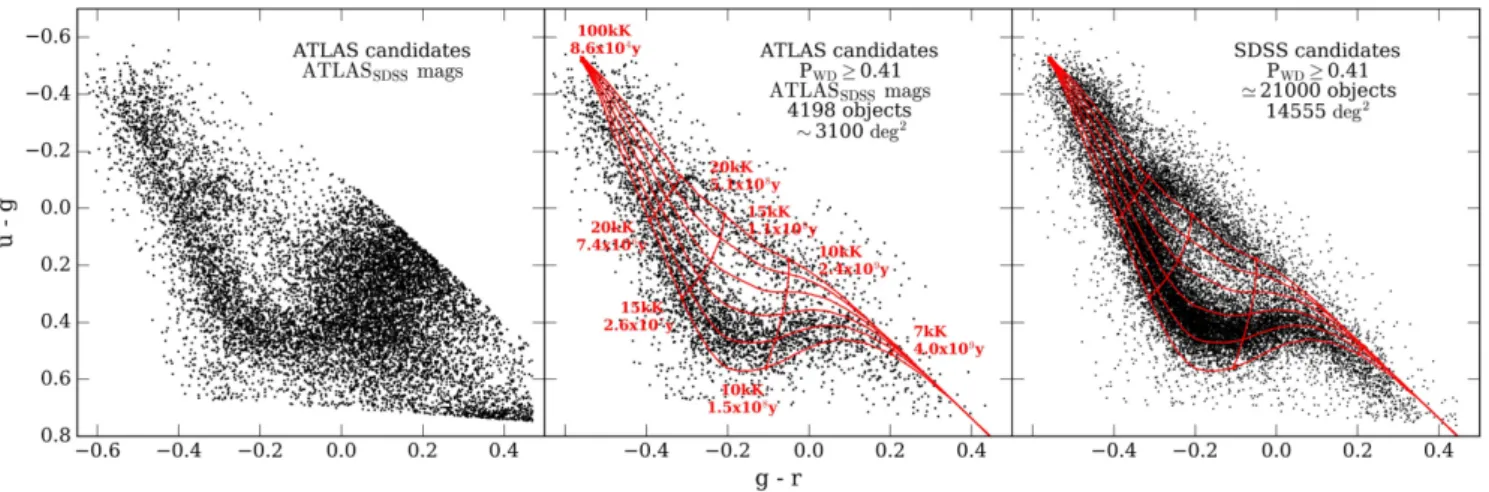
Figure 6. u−g,g−rcolour–colour distribution of (from left- to right-hand side): all 11 407 ATLAS objects in our final sample; 4205 ATLAS objects withPWD≥0.41;21 000 white dwarf candidates from Gentile Fusillo et al. (2015a) withPWD≥0.41 for comparison. White dwarf cooling tracks from Holberg & Bergeron (2006) are shown in red overlay.
small number of inconsistencies, we are confident that thePWD val-ues calculated can be used to reliably select high-confidence dwarf candidates, i.e. Fig.6clearly illustrate that the colour–colour dis-tribution of the ATLASPWD≥0.41 sample is remarkably similar to that of the equivalent sample selected from the Gentile Fusillo et al. (2015a) SDSS catalogue. Taking into account the values of completeness and efficiency calculated before, we estimate that our catalogue contains4100 high-confidence white dwarf candidates.
6.2 Spectroscopic follow-up
To further test the reliability of our selection method, we obtained spectra for a total of 185 objects from our catalogue. 169 objects were observed with the two degree field (‘2dF’) multi-object system of the AAOmega spectrograph on the Anglo Australia Telescope (AAT). These spectra were acquired as part of the 2dF Quasar Dark Energy Survey pilot (Chehade et al.2016). The observations were made using the 580V and 385R gratings for the blue and red arm of the spectrograph, respectively. This configuration achieves a useful wavelength range between 3700 and 8800 Å. The data reduction was carried out using the 2dFDR2data reduction pipeline (for more details see Chehade et al. 2016). Among these 169 targets, we identified 14 new white dwarfs, all of which havePWD>0.7. The remaining objects are mostly quasars withPWD<0.2 and only four of them havePWD>0.45.
We also selected 16 additional targets specifically as high-confidence white dwarf candidates (PWD≥0.85) and observed them with the New Technology Telescope (NTT) and the VLT as part of backup programs due to a northern pointing restriction for strong northerly winds. 13 targets were observed on 2015 September 16 using the EFOSC2 instrument on the NTT at la Silla, Chile with the ‘Gr#7’ grism and a 1-arcsec slit, and with exposure times in the range of 300–900 s. We carried out optimal spectral reduction and calibration using the packagesPAMELA3andMOLLY4(Marsh1989). The last three objects were observed on 2015 September 24 at the VLT observatory with the X-Shooter spectrograph, using a 1-arcsec
2http://www.aao.gov.au/science/software/2dfdr
3PAMELA was written by T. R. Marsh and can be found in the STARLINK
distribution Hawaiki and later releases.
4MOLLY was written by T. R. Marsh and is available from
http://www.warwick.ac.uk/go/trmarsh/software.
slit for theUVBarm and 0.9-arcsec for theVISarm and exposure times of∼1500 s. The spectra were reduced using the standard pro-cedures within theREFLEX5reduction tool developed by ESO. All 16 high-confidence white dwarf candidates were confirmed as white dwarfs (Table5). Both the NTT and the VLT observations were undertaken as backup programs due to a northern pointing restrfor strong northerly winds.
6.3 Spectral analysis
Of the 30 new spectroscopically confirmed white dwarfs, 27 stars have hydrogen-dominated atmospheres (DA), one shows strong Ca H&K lines (DZ, Fig.7), one has a likely carbon-dominated atmo-sphere (DQ) and another star does not show strong atmospheric features at the signal-to-noise level of the spectrum we obtained. Two DA white dwarfs display also Zeeman splitting of the hydrogen lines due to moderately strong magnetic fields (DAH, e.g. Fig.7).
In Table 5, we summarize the spectral classification and we report the atmospheric parameters (Teff, logg) of the DA white dwarfs, which we have measured through comparison with a grid of Koester (2010) model spectra (Fig.8). The synthetic spectra were computed with the mixing-length prescription of ML2/α =0.8, and include the Stark broadening profiles by Tremblay & Bergeron (2009). For the spectral analysis, we usedFITSB2 (Napi-wotzki et al.2004) that determines the best-fitting model viaχ2 minimization of the Balmer line profiles for observed and synthetic spectra, using a downhill simplex algorithm (e.g. the AMOEBA routine; Press et al.1992) and a bootstrap method to assess the uncertainties. For cool DA white dwarfs (Teff<15 000 K), we ap-plied the Tremblay et al. (2013) 3D corrections of the atmospheric parameters to account for the inaccurate treatment of convention in 1D models.
The spectroscopic parameters are broadly consistent with the photometric estimates one would derive from comparison with the white dwarf cooling sequences (Fig.6).
6.4 New pulsating white dwarfs
As it continues its tour around the ecliptic plane, the extended Ke-plermission (K2) has opened the possibility to observe many new
5http://www.eso.org/sci/software/reflex/
Table 5. List of ATLAS white dwarf candidates confirmed by spectroscopic observations. For DA white dwarfs, we also report theTeffand loggfrom the best-fitting model adjusted using the Tremblay et al. (2013) 3D corrections. Spectral-type classification with the ‘:’ suffix is considered uncertain due to the low quality of the spectrum.
Name RA Dec. PWD Instrument Type Teff(K) logg
ATLAS J034131.17−272144.73 55.379 88 −27.362 427 0.95 X-Shooter DA 13 519±450 7.81±0.07 ATLAS J001618.70−343056.17 4.077 932 −34.515 605 0.98 X-Shooter DA 11 329±160 7.72±0.05 ATLAS J000119.76−394703.17 0.332 369 −39.784 214 0.99 X-Shooter DA 12 684±310 8.10±0.08 ATLAS J000344.78−391523.32 0.936 586 −39.256 48 0.89 EFOSC2 DA 6946±100 7.28±0.27 ATLAS J002239.01−311039.05 5.662 562 −31.177 516 1.00 EFOSC2 DAH
ATLAS J002606.30−322423.70 6.526 252 −32.406 585 0.99 EFOSC2 DA 11 708±150 8.10±0.05 ATLAS J014005.85−344724.11 25.024 40 −34.790 033 0.96 EFOSC2 DA 11 721±630 7.76±0.28 ATLAS J023320.65−320310.88 38.336 047 −32.053 023 0.99 EFOSC2 DA 10 770±180 7.99±0.06 ATLAS J023752.56−304133.16 39.469 012 −30.692 547 0.99 EFOSC2 DAH
ATLAS J034356.22−334106.29 55.984 261 −33.685 081 0.96 EFOSC2 DA 12 419±420 8.37±0.09 ATLAS J214039.37−341920.25 325.164 068 −34.322 294 0.96 EFOSC2 DA 17 140±230 7.85±0.06 ATLAS J220217.30−391728.36 330.572 104 −39.291 212 0.98 EFOSC2 DA 9508±90 7.94±0.08 ATLAS J222337.44−343839.72 335.906 028 −34.644 369 0.87 EFOSC2 DZ
ATLAS J224510.44−383645.71 341.293 532 −38.612 699 0.88 EFOSC2 DA 10 194±290 7.85±0.10 ATLAS J224653.56−385651.24 341.723 203 −38.947 567 1.00 EFOSC2 DAV 10 432±290 8.06±0.10 ATLAS J230223.57−114811.36 345.598 21 −11.803 158 0.98 EFOSC2 DA 10 077±140 7.92±0.06 ATLAS J034255.41−300122.62 55.730 916 −30.022 952 0.99 2dF DA 15 270±980 9.13±0.22 ATLAS J033004.84−295300.07 52.520 199 −29.883 353 0.97 2dF DA 17 880±640 8.06±0.12 ATLAS J034456.50−265224.69 56.235 429 −26.873 526 0.93 2dF DA 35 860±1150 8.51±0.21 ATLAS J034922.82−254709.30 57.345 107 −25.785 918 0.72 2dF DA 7648±110 7.56±0.24 ATLAS J035010.83−261739.46 57.545 143 −26.294 295 0.90 2dF DA:
ATLAS J121646.04−062443.49 184.191 856 −6.412 081 0.96 2dF DA 7694±230 7.85±0.81 ATLAS J121655.61−063810.24 184.231 716 −6.636 178 0.75 2dF DA 9366±270 8.33±0.27 ATLAS J121844.60−064243.39 184.685 854 −6.712 053 0.99 2dF DA 19 750±760 7.66±0.15 ATLAS J123540.68−074802.08 188.919 502 −7.800 578 0.99 2dF DA 7950±230 6.24±0.94 ATLAS J132001.63−074703.50 200.006 82 −7.784 306 0.99 2dF DA 14 690±1190 8.41±0.19 ATLAS J152811.82−145839.45 232.049 259 −14.977 627 0.99 2dF DQ:
ATLAS J234049.50−314633.67 355.206 261 −31.776 022 0.96 2dF DA 9568±100 7.99±0.09 ATLAS J234332.65−311950.08 355.886 063 −31.330 578 0.96 2dF DA 13 240±340 8.08±0.09 ATLAS J121912.39−071436.07 184.801 635 −7.243 353 0.99 2dF DC:
ATLAS J134211.62−073540.1 205.548 443 −7.594 483 1.00 SOAR DA 11 190±170 8.02±0.05
Figure 7. Spectra of the DZ white dwarf and of one magnetic white dwarfs discovered by follow-up observations of candidates using EFOSC2.
white dwarfs, especially those that pulsate. We have utilized this catalogue of candidate white dwarfs from ATLAS for target se-lection of several Guest Observer proposals (for Field 6, 12 and 15 in K2 Campaign 6). One of our candidates, selected solely based on itsPWDand ATLASugrcolours, was observed to pulsate: ATLASJ134211.62−073540.1 (EPIC 229227292). In fact, this star became the fourth white dwarf to show aperiodic, large-amplitude outbursts in its K2 observations (Bell et al. 2016). Follow-up
spectroscopy from the Souther Astrophysical Research (SOAR) telescope confirmed this is a DA white dwarf with atmospheric pa-rameters corresponding to 11 190±170 K, log g=8.02±0.05,
MWD=0.62±0.03. This is now the second-brightest white dwarf known to show such outbursts, which may arise result from a para-metric resonant coupling (Hermes et al.2015).
Additionally, several of the white dwarfs analysed in Table5
628
N. P. Gentile Fusillo et al.
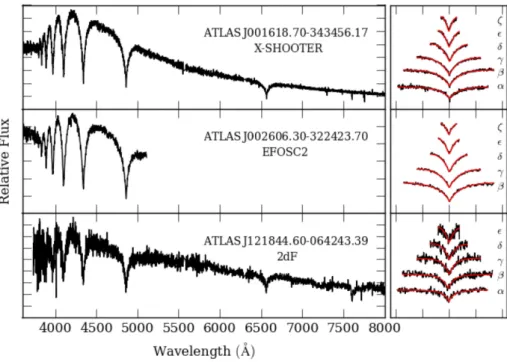
Figure 8. Sample spectra of three white dwarf candidates confirmed by observations with X-SHOOTER, EFOSC2 and 2dF. The panels on the right show the best-fitting models overlaid on the normalized Balmer lines used for the fit.
strip. We followed-up four of these stars with high-speed photom-etry from the SOAR at Cerro Pachon in Chile. All targets were observed with the Goodman spectrograph in imaging mode using 20 s exposures through an S8612 filter. Three of the observed white dwarfs do not show photometric variability, with good limits on a lack of pulsations. ATLASJ023320.65−320310.88 was observed for 2.0 h and does not vary to a limit of 0.8 ppt (1 ppt=0.1 per cent). ATLASJ214039.37−341920.25 was observed for 2.4 h and does not vary to a limit of 2.0 ppt. ATLASJ224510.44−383645.71 was observed for 2.1 hand does not vary to a limit of 2.9 ppt. However, we have detected significant variability in a 1.8 h run on ATLAS224653.56−385651.24: a 4.9(3) ppt peak at 1502.0± 10.3 s. If confirmed, this would be one of the coolest (and longest-period) pulsating white dwarfs detected to date. Within the uncer-tainties inTeffand log g (Table5), the two pulsating white dwarfs can be placed inside of the empirical ZZ Ceti instability strip and similarly the three stars observed not to vary can be placed outside it.
7 C O N C L U S I O N
We presented the application of our selection method for photo-metric white dwarfs candidates (Gentile Fusillo et al.2015a) to the latest internal data release of the VST ATLAS survey combined with proper motions from APOP. The resulting catalogue contains 11 407 ATLAS sources with computed PWD. Using a small number of SDSS spectroscopically confirmed white dwarfs and contaminants, we calculated that a confidence cut atPWD≥0.41 produces a sam-ple of white dwarfs that is 96 per cent comsam-plete with an efficiency of 87 per cent. We estimate that our catalogue contains 4200 high-confidence white dwarf candidates the majority of which have not yet received spectroscopic follow-up. Only∼15 per cent of the white dwarfs known to date are located in the Southern hemisphere and our catalogue therefore constitute a significant improvement on the current north–south knowledge gap.
Among these thousands of new white dwarfs, we expect to find several systems of particular interest: metal polluted white dwarfs
(most likely more than 1000 in the final ATLAS footprint) that will improve current statistics on planetary debris abundances, a few tens of white dwarfs with detectable debris discs that can be iden-tified combining our catalogue with IR data from the Vista Hemi-sphere Survey (VHS, McMahon et al.2013) and WISE (Wright et al.2010), several magnetic white dwarfs and white dwarfs with rare atmospheric composition (e.g. DQ) like those already identified in our limited spectroscopic follow-up (Section 6.2) and more pul-sating white dwarfs (Section 6.4). The application of our catalogue to most white dwarfs population studies will ultimately require spectroscopic follow-up. The possibility to rely on thePWDs allows one to tailor future spectroscopic observations prioritising efficiency (and therefore highPWD targets) for single target observations or completeness in large scale campaigns.
AC K N OW L E D G E M E N T S
We thank the anonymous referee for the fast and constructive com-ments received. The research leading to these results has received funding from the European Research Council under the European Union’s Seventh Framework Programme (FP/2007-2013)/ERC Grant Agreement n.320964 (WDTracer). Support for this work was provided by NASA through a Hubble Fellowship grant HST-HF2-51357.001-A. This paper is based on observations made with ESO Telescopes at the Paranal Observatory under programme ID 095.D-0406(B), 095.D-0802(B), 097.D-1029(A), 177.A-3011 (A-I) and also based on observations obtained at the Southern Astrophysical Research (SOAR) telescope, which is a joint project of the Min-ist´erio da Ciˆencia, Tecnologia, e Inovac¸˜ao da Rep´ublica Federativa do Brasil, the U.S. National Optical Astronomy Observatory, the University of North Carolina at Chapel Hill and Michigan State University. Funding for SDSS-III has been provided by the Al-fred P. Sloan Foundation, the Participating Institutions, theNational Science Foundation and the U.S. Department of Energy Office of Science. The SDSS-III website is http://www.sdss3.org/. SDSS-III is managed by the Astrophysical Research Consortium for the
Participating Institutions of the SDSS-III Collaboration includ-ing the University of Arizona, the Brazilian Participation Group, Brookhaven National Laboratory, Carnegie Mellon University, Uni-versity of Florida, the French Participation Group, the German Par-ticipation Group, Harvard University, the Instituto de Astrofisica de Canarias, the Michigan State/Notre Dame/JINA Participation Group, Johns Hopkins University, Lawrence Berkeley National Laboratory, Max Planck Institute for Astrophysics, Max Planck Institute for Extraterrestrial Physics, New Mexico State Univer-sity, New York UniverUniver-sity, Ohio State UniverUniver-sity, Pennsylvania State University, University of Portsmouth, Princeton University, the Spanish Participation Group, University of Tokyo, University of Utah, Vanderbilt University, University of Virginia, University of Washington and Yale University.
Facilities: VST, AAT, NTT, VLT, SOAR, SDSS
R E F E R E N C E S
Alam S. et al., 2015, ApJ, 219, 12 Bell K. J. et al., 2016, ApJ, 829, 82
Bergeron P., Saffer R. A., Liebert J., 1992, ApJ, 394, 228
Brown W. R., Kilic M., Allende Prieto C., Kenyon S. J., 2010, ApJ, 723, 1072
Castanheira B. G. et al., 2004, A&A, 413, 623
Catal´an S., Isern J., Garc´ıa-Berro E., Ribas I., 2008, MNRAS, 387, 1693 Chehade B. et al., 2016, MNRAS, 459, 1179
de Bruijne J. H. J., Allen M., Azaz S., Krone-Martins A., Prod’homme T., Hestroffer D., 2015, A&A, 576, A74
de Jong J. T. A. et al., 2013, The Messenger, 154, 44
Debes J. H., Hoard D. W., Wachter S., Leisawitz D. T., Cohen M., 2011, ApJ, 197, 38
Drew J. E. et al., 2014, MNRAS, 440, 2036 Dufour P. et al., 2007, ApJ, 663, 1291
Dufour P., Kilic M., Fontaine G., Bergeron P., Lachapelle F., Kleinman S. J., Leggett S. K., 2010, ApJ, 719, 803
Eisenstein D. J. et al., 2006, ApJS, 167, 40
Falcon R. E., Winget D. E., Montgomery M. H., Williams K. A., 2010, ApJ, 712, 585
Farihi J., Becklin E. E., Zuckerman B., 2005, ApJS, 161, 394 Farihi J., Jura M., Zuckerman B., 2009, ApJ, 694, 805 Gaia Collaboration et al., 2016, A&A, 595, A2
G¨ansicke B. T., Euchner F., Jordan S., 2002, A&A, 394, 957
G¨ansicke B. T., Marsh T. R., Southworth J., Rebassa-Mansergas A., 2006, Science, 314, 1908
G¨ansicke B. T., Koester D., Girven J., Marsh T. R., Steeghs D., 2010, Science, 327, 188
Gentile Fusillo N. P. et al., 2015b, MNRAS, 452, 765
Gentile Fusillo N. P., G¨ansicke B. T., Greiss S., 2015a, MNRAS, 448, 2260 Gentile Fusillo N. P., Hermes J. J., G¨ansicke B. T., 2016, MNRAS, 455,
2295
Giammichele N., Bergeron P., Dufour P., 2012, ApJ, 199, 29
Girven J., G¨ansicke B. T., Steeghs D., Koester D., 2011, MNRAS, 417, 1210 Greiss S., G¨ansicke B. T., Hermes J. J., Steeghs D., Koester D., Ramsay G.,
Barclay T., Townsley D. M., 2014, MNRAS, 438, 3086 Harris H. C. et al., 2003, AJ, 126, 1023
Hermes J. J. et al., 2014, ApJ, 792, 39 Hermes J. J. et al., 2015, ApJ, 810, L5 Holberg J. B., Bergeron P., 2006, AJ, 132, 1221
Holberg J. B., Oswalt T. D., Sion E. M., 2002, ApJ, 571, 512
Holberg J. B., Sion E. M., Oswalt T., McCook G. P., Foran S., Subasavage J. P., 2008, AJ, 135, 1225
Hollands M. A., G¨ansicke B. T., Koester D., 2015, MNRAS, 450, 681 Iben I. J., Ritossa C., Garcia-Berro E., 1997, ApJ, 489, 772
Kepler S. O. et al., 2013, MNRAS, 429, 2934 Kepler S. O. et al., 2015, MNRAS, 446, 4078 Kepler S. O. et al., 2016, MNRAS, 455, 3413
Kepler S. O., Koester D., Ourique G., 2016, Science, 352, 67 Kleinman S. J. et al., 2013, ApJS, 204, 5
Koester D., 2010, Mem. Soc. Astron. Ital., 81, 921 Koester D., G¨ansicke B. T., Farihi J., 2014, A&A, 566, A34 Kuijken K., 2011, The Messenger, 146, 8
K¨ulebi B., Jordan S., Euchner F., G¨ansicke B. T., Hirsch H., 2009, A&A, 506, 1341
Lasker B. M., STSCI Sky-Survey Team, 1998, BAAS, 30, 912 Liebert J., Bergeron P., Holberg J. B., 2005, ApJS, 156, 47 Manser C. J. et al., 2016, MNRAS, 455, 4467
Marsh T. R., 1989, PASP, 101, 1032
Marsh T. R., Nelemans G., Steeghs D., 2004, MNRAS, 350, 113 McMahon R. G., Banerji M., Gonzalez E., Koposov S. E., Bejar V. J., Lodieu
N., Rebolo R., VHS Collaboration, 2013, The Messenger, 154, 35 Napiwotzki R. et al., 2004, in Hilditch R. W., Hensberge H., Pavlovski K.,
eds., ASP Conf. Ser. Vol. 318, Spectroscopically and Spatially Resolv-ing the Components of the Close Binary Stars. Astron. Soc. Pac., San Francisco, p. 402
Parsons S. G., Marsh T. R., G¨ansicke B. T., Drake A. J., Koester D., 2011, ApJ, 735, L30
Press W. H., Teukolsky S. A., Vetterling W. T., Flannery B. P., 1992, Numer-ical recipes in FORTRAN. The Art of Scientific Computing. Cambridge Univ. Press, Cambridge
Qi Z. et al., 2015, AJ, 150, 137
Raddi R., G¨ansicke B. T., Koester D., Farihi J., Hermes J. J., Scaringi S., Breedt E., Girven J., 2015, MNRAS, 450, 2083
Raddi R. et al., 2016, MNRAS, 457, 1988
Rebassa-Mansergas A. et al., 2015, MNRAS, 450, 743
Schipani P. et al., 2012, in Stepp L. M., Gilmozzi R., Hall H. J., eds, Proc. SPIE Conf. Ser. Vol. 8444, Ground-based and Airborne Telescopes IV. SPIE, Bellingham, p. 84441C
Schmidt G. D., Liebert J., Harris H. C., Dahn C. C., Leggett S. K., 1999, ApJ, 512, 916
Schmidt G. D. et al., 2003, ApJ, 595, 1101 Shanks T. et al., 2015, MNRAS, 451, 4238
Sion E. M., Leckenby H. J., Szkody P., 1990, ApJ, 364, L41
Sion E. M., Holberg J. B., Oswalt T. D., McCook G. P., Wasatonic R., Myszka J., 2014, AJ, 147, 129
Steele P. R. et al., 2013, MNRAS, 429, 3492
Torres S., Garc´ıa-Berro E., Isern J., Figueras F., 2005, MNRAS, 360, 1381 Tremblay P.-E., Bergeron P., 2009, ApJ, 696, 1755
Tremblay P.-E., Ludwig H.-G., Steffen M., Freytag B., 2013, A&A, 552, A13
Tremblay P.-E., Kalirai J. S., Soderblom D. R., Cignoni M., Cummings J., 2014, ApJ, 791, 92
Tremblay P.-E., Cummings J., Kalirai J. S., G¨ansicke B. T., Gentile-Fusillo N., Raddi R., 2016, MNRAS, 461, 2100
Vennes S., Kawka A., 2008, MNRAS, 389, 1367
Wilson D. J., G¨ansicke B. T., Koester D., Raddi R., Breedt E., Southworth J., Parsons S. G., 2014, MNRAS, 445, 1878
Wright E. L. et al., 2010, AJ, 140, 1868 York D. G. et al., 2000, AJ, 120, 1579 Zuckerman B., Reid I. N., 1998, ApJ, 505, L143
S U P P O RT I N G I N F O R M AT I O N
Supplementary data are available atMNRASonline.
Table 4. Format of the catalogue of VST ATLAS white dwarfs candidates. The full catalogue can be accessed online via VizieR.
Please note: Oxford University Press is not responsible for the content or functionality of any supporting materials supplied by the authors. Any queries (other than missing material) should be directed to the corresponding author for the article.