Changes in Protein Abundance are Essential for Proper Cell Cycle Regulation
Karen Reidy Lane
A dissertation submitted to the faculty of the University of North Carolina at Chapel Hill in partial fulfillment of the requirements for the degree of Doctor of Philosophy in the Curriculum of Genetics and Molecular Biology.
Chapel Hill 2012
Approved By
Jeanette Gowen Cook, PhD William Marzluff, PhD
Abstract
KAREN REIDY LANE: Changes in Protein Abundance are Essential for Proper Cell Cycle Regulation
(Under the direction of Jeanette Gowen Cook)
Acknowledgements
First and foremost, I would like to thank my mentor, Dr. Jeanette Gowen Cook. While it has not been the easiest journey, you have stuck with me the entire way, and I sincerely thank you for all of your help and guidance.
I would also like to thank the members of my committee: Dr. Cyrus Vaziri, Dr. Bob Durunio, Dr. Yue Xiong, and Dr. Bill Marzluff. Thank you for your continued support and guidance. I would also like to thank Dr. Xian Chen and Dr. Yanbao Yu for their expertise and help with the mass spectrometry. I would also like to acknowledge Dr. Zefeng Wang, Daniel Dominguez, and Dr. Mariano Garcia-Blanco for their helpful suggestions and expertise.
quick joke. I could continue this way forever, so it’s best I just say thank you for everything.
I would also like to thank my parents and my brother for their patience and support. I would also like to thank my North Carolina family, both at UNC and in Raleigh. To the members of GMB, thank you for being my second family when I first moved down here. I will always remember our dinners and shenanigans. I would also like to thank my Raleigh family, affectionately known as Those Guys. I consider myself truly blessed to call all of you friends; without you, my life would be completely different.
Table of Contents
List of Figures ... xi
List of Abbreviations ... xiii
Chapter 1. Introduction ... 1
Pre-RC Formation ... 2
Cyclin/Cdk complexes ... 7
Regulation of Cell Cycle Genes by Transcription ... 8
The basics of the Rb/E2F pathway ... 8
Rb/E2F-mediated repression ... 12
Activation of E2F target genes ... 15
Rb/E2F in mitosis ... 17
Mutations in Rb/E2F in cancer ... 17
The Myc family of transcription factors ... 18
The role of Myc in cancer ... 20
Regulation of Translation by miRNAs ... 22
Control of cyclin/Cdk complexes ... 22
Control of the Rb/E2F pathway ... 25
Myc controls global miRNA levels ... 26
PTMs control pre-RC assembly and function ... 28
Control of Cdt1 by geminin accumulation ... 30
APC/C as a master regulator of the cell cycle ... 31
CRL4Cdt2 prevents re-replication ... 32
Pre-RC components are overexpressed in cancer ... 34
Conclusions ... 36
2. Global Proteomics Reveal Unexpected Cell Cycle Regulated Processes ... 38
Introduction ... 38
Materials and Methods ... 39
Cell Culture and Synchronization ... 39
Cell Lysis and Sample Processing ... 41
Desalting and LC/MS-MS ... 43
Database Search ... 44
Dataset Comparison and GO Term Analysis ... 45
Immunoblot Validation ... 46
Results ... 47
Synchronous HeLa cells progress through G1/S and S/G2 transitions ... 47
Protein abundance changes at the G1/S and S/G2 transitions ... 51
Frequent discordance of mRNA and protein abundance ... 56
Unanticipated cell cycle regulated proteins include alternative splicing factors ... 62
3. Identification of a Re-replication induced
Gene Expression Signature ... 74
Introduction ... 74
Materials and Methods ... 76
Cell Culture and siRNA Transfection ... 76
Immunoblot Analysis ... 77
Flow Cytometry Analysis and Immunofluorescence ... 78
RNA Preparation and Microarray Analysis ... 78
cDNA Preparation and qPCR Analysis ... 79
Results ... 80
Depletion of Cdt2 results in G2/M arrest ... 80
Depletion of geminin leads to re-replication in HMEC cells ... 85
Discussion ... 85
4. Conclusions and Future Directions ... 90
Conclusions ... 90
Future Directions ... 90
Repeat mass spectrometry to detect low abundance proteins ... 90
Determine the effects of hnRNP protein changes on alternative splicing ... 91
Determine the gene expression profile of re-replicating HMEC cells ... 93
Appendix A: Protocols for optimized Cdc6 isolation ... 94
Project Rationale ... 94
Isolation of endogenous Cdc6 with UNC274
or UNC275 sera ... 95
Isolation of endogenous Cdc6 with H304 antibody ... 96
Isolation of SBP-CBP-Cdc6 ... 98
Project Status and Future Directions ... 99
Appendix B: List of plasmids generated ... 102
Cdc6 Plasmids ... 102
Cdt1 Plasmids ... 117
Splicing Reporter Plasmids ... 117
Other Plasmids ... 120
List of Tables
2. Global Proteomics Reveal Unexpected Cell Cycle Regulated Processes
Table 1. Top three significant GO terms enriched in individual
lists of cell cycle-regulated proteins ... 73
Table 2. Top three significant GO terms enriched in individual
lists of MG132 sensitive proteins ... 74!
List of Figures
1. Introduction
1.1 Re-replication leads to double strand breaks ... 3 1.2 Pre-RC assembly in G1 phase ... 5!
1.3 Cyclin levels fluctuate throughout the cell cycle ... 9! 1.4 The Rb/E2F pathway regulates the transcription of
genes needed for S phase progression ... 13! 1.5 miRNAs regulate translation of proteins needed for
S phase entry ... 24! 1.6 APC/C is cell cycle regulated and controls several
important pre-RC proteins ... 33! 1.7 Cdt1 and Set8 are degraded during S phase ... 35!
2. Global Proteomics Reveal Unexpected Cell Cycle Regulated Processes
2.1 HeLa cell synchronization ... 50 2.2 Cell cycle regulated proteins from G1 to S and
S to G2 detected by mass spectrometry ... 54
2.3 Validation of selected cell cycle regulated proteins
predicted by mass spectrometry ... 57
2.4 Discordance between mRNA and protein abundance ... 59 2.5 Proteins at both the G1/S and S/G2 transitions
are ubiquitinated ... 61 2.6 Proteins at both transitions are phosphorylated ... 63
2.7 pre-mRNA alternative splicing factors are enriched
amond proteins that decrease from G1 to S phase ... 65
2.8 Cell cycle changes in pre-mRNA splicing factors
3. Identification of a Re-replication Induced Gene Expression Signature
3.1 Depletion of Cdt2 results in DNA damage and a
G2/M arrest ... 83 3.2 Treatment with 10 nM siCdt2 causes DNA damage
but does not induce a G2/M arrest ... 85 3.3 Co-depletion of Cdt2 and p53 abrogates the G2/M arrest ... 87 3.4 Depletion of geminin results in re-replication ... 89
Appendix A: Protocols optimized for Cdc6 isolation
A.1 Cdc6 isolation from HeLa cell extracts ... 100
List of Abbreviations AAA+ – ATPase-associated with various cellular activities AACT – Amino Acid-Coded mass Tagging
ABC – Ammonium bicarbonate ACN – Acetonitrile
AEBSF – 4-(2-Aminoethyl) benzenesulfonyl fluoride hydrochloride APC/C – Anaphase Promoting Complex/Cyclosome
ATM – Ataxia Telangiectasia Mutated
ATR – Ataxia Telangiectasia and Rad3 related BrdU – Bromodeoxyuridine
BSA – Bovine serum albumin CBP – Calmodulin binding peptide Cdc6 – Cell division cycle 6
Cdc20 – Cell division cycle 20 Cdk – Cyclin dependent kinase Cdt1 – Cdc10 dependent transcript 1 Cdt2 – Cdc10 dependent transcript 2 Chk2 – Checkpoint kinase 2
CHO – Chinese hamster ovary CID – Collision-Induced Dissociation CKI – Cyclin dependent kinase inhibitor CRL4 – Cullin 4
DAVID – Database for Annotation, Visualization, and Integrated Discovery Dec – Decrease
Dec MG – Decreases with MG132 dFBS – Dialyzed Fetal Bovine Serum
DMEM – Dulbecco’s Modified Eagle Medium DNA – Deoxyribonucleic acid
DNMT – DNA methyltransferase DP – Dimerization partner
DT – Double thymidine block DTT – Dithiothreitol
ECl – Enhanced chemoluminescence EDTA – Ethylenediaminetetraacetic acid EGTA – Ethylene glycol tetraacetic acid Emi1 – Early mitotic inhibitor 1
FBS – Fetal bovine serum
GAPDH – Glyceraldehyde-3-phosphate dehydrogenase GFP – Green fluorescent protein
GO – Gene ontology
GST – Glutathione S-transferase HAT – Histone acetyltransferase
Hbo1 – Histone acetyltransferase binding to Orc1 HDAC – Histone deacetylase
hnRNP – Heterogeneous nuclear ribonucleoprotein HPLC – High performance liquid chromatography HRP – Horseradish peroxidase
IF – Immunofluorescence Inc – Increase
Inc MG – Increases with MG132 IP – Immunoprecipitation
LC-MS/MS – Liquid chromatography-tandem mass spectrometry Mad2 – Mitotic arrest deficient 2-like protein 1
MARCKSL1 – Marcks-related protein 1 Max – Myc associated factor X
MCM – Minichromosome Maintenance complex MDM2 – Double minute 2 protein
MG132 – Z-Leu-Leu-Leu-al miRNA – MicroRNA
Miz1 – Myc-interacting zing finger protein 1 MOI – Multiplicity of infection
mRNA – Messenger ribonucleic acid NC – No Change
NC MG – No Change with MG132
NEDD8 – Neural precursor cell expressed developmentally down-regulated protein 8
NHF – Normal human fibroblast NRS – Normal rabbit serum NSB – Non-specific band
ORC – Origin recognition complex
PAGE – Polyacrylamide gel electrophoresis Palmd – Palmdelphin
PBS – Phosphate buffered saline
PCNA – Proliferating Cell Nuclear Antigen PCR – Polymerase chain reaction
PFA – paraformaldehyde
PIP motif – PCNA interacting protein motif Plk1 – Polo-like kinase 1
pre-RC – Pre-replication complex PTM – Post-translational modification PVDF – Polyvinylidene fluoride
Rb – Retinoblastoma protein RNA – Ribonucleic acid
RRM2 – Ribonucleoside-diphosphate reductase subunit M2 SBP – Streptavidin binding peptide
SCF – Skp, Cullin, F-box containing complex SDS – Sodium dodecyl sulfate
Set8 – SET domain-containing protein 8 Skp2 – S-phase kinase-associated protein 2 SLBP – Stem loop binding protein
SRSF – Serine rich splicing factor Tmod3 – Tropomodulin 3
Chapter 1
Introduction1
Introduction
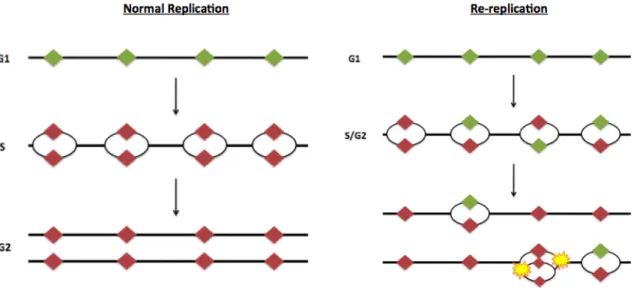
{DNA replication is a fundamental biological process that serves to create two copies of the genetic material during each cell division. Complete and precise replication enables identical sets of genes to be faithfully delivered to daughter cells during each cell division. To achieve rapid duplication of the entire genome, eukaryotic cells initiate DNA replication at multiple locations on each chromosome termed origins of DNA replication. Origin DNA is unwound and complementary DNA is then synthesized from bi-directionally moving replication forks. The replication forks eventually merge to form two identical chromosomes.
The cell expends tremendous energy ensuring that a single origin of replication does not initiate replication twice within the same cell cycle. One of the most highly regulated steps in DNA replication is assembly of pre-replication complexes (pre-RCs). Pre-RC assembly begins as cells exit mitosis and continues through G1 phase, culminating in chromosomes poised for replication by the end of G1. At the onset of S phase, origins fire and replication begins.
During this time, several overlapping mechanisms prevent pre-RC assembly on origins that have already fired to avoid utilizing any origins twice.
An abnormal situation in which replication is triggered multiple times from the same origin during a single cell cycle is termed re-replication (Figure 1.1). Re-replication is detrimental to genome stability in part, because it generates multiple replication forks on the same DNA strand. Ultimately such structures result in double strand breaks, genome instability, and in some cases, tumorigenesis [2-5].}
Pre-RC formation is limited to G1 phase of the cell cycle
{To faithfully replicate its genomic information in a timely manner, a cell must initiate replication at thousands of sites across the genome. These origins of replication are prepared for replication through assembly of pre-RCs beginning in late mitosis and continuing through G1 phase of the cell cycle. Origins with a fully assembled pre-RC are said to be “licensed” for replication. It is essential that origins assemble RCs only in G1 because assembly of pre-RCs in S or G2 can lead to re-replication.
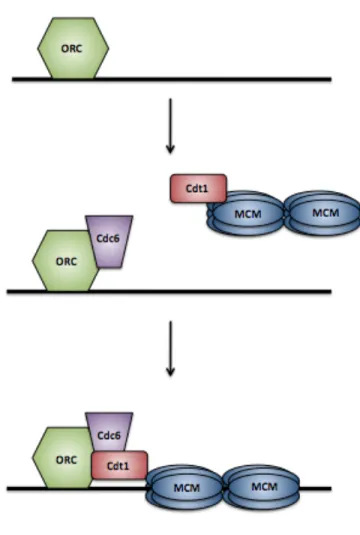
Pre-RC assembly begins when the six-subunit origin recognition complex (ORC) binds to an origin of replication (Figure 1.2). ORC is composed of the constitutively expressed subunits Orc2-6, as well as the cell cycle-regulated Orc1 protein, and acts as an ATPase [6-9]. Once bound to origins, ORC recruits the remaining licensing factors Cdc6 and Cdt1 to origins [10,11].
DNA replication; if Cdc6 is absent, yeast cells not only fail to replicate but also undergo reductional anaphase in which mitosis initiates without genome replication [12-14]. Cdc6 is a member of the AAA+ ATPase family, and is closely related to Orc1 [15,16]. ATP hydrolysis by Cdc6 and ORC is needed to load the helicase complex onto DNA [8,17-21]. Due to its tight association with ORC and its partially conserved DNA binding domain, it has been suggested that Cdc6 may also play a role in defining ORC binding sites [22].
Cdt1 was first discovered in Schizosaccharomyces pombe and, while possessing no enzymatic activity, is essential for the licensing reaction [11,23]. Cdt1 binds the core replicative helicase Mini-Chromosome Maintenance (MCM) complex and recruits MCM to origins through direct interactions with ORC and Cdc6 [24-27]. While both Cdc6 and Cdt1 are needed to load the MCM complex, they bind in a sequential manner; Cdt1 can only bind to chromatin-bound Cdc6 and ORC [28]. Both Cdc6 and ORC hydrolyze ATP to load MCM complexes onto DNA [17]. ATP hydrolysis by Cdc6 also releases Cdt1 to recruit additional MCM complexes [17]. Once MCM complexes are loaded, the origin is licensed and can initiate replication once the MCM helicase is activated in S phase. After MCM complexes have been loaded, ORC, Cdc6, and Cdt1 are no longer needed, and replication can continue in their absence [20,29,30]. This property of the loaded MCM complex is key to preventing re-replication because, as will be discussed below, ORC, Cdc6, and Cdt1 are inactivated beginning in S phase.
MCM loading is not currently understood, but electron microscopy images suggest ORC and Cdc6 form a structure similar to known clamp loaders such as RFC [35,36]. While multiple MCM complexes can be loaded at each origin, perhaps as many ten copies per origin, the majority of the MCM complexes that associate with chromatin do not travel with the replication fork suggesting that they are not normally activated [33,37,38]. These additional MCM complexes may be loaded as a backup mechanism to ensure that a sufficient number of origins fire in S phase [39].
MCM loading is highly regulated by multiple overlapping mechanisms. Cdc6 and Cdt1 protein levels peak at different stages of the cell cycle; Cdt1 levels peak in G1 phase whereas Cdc6 peaks in S/G2 phase in mammalian cells [11,40]. Additionally, a member of the ORC complex, Orc1, is degraded or inactivated at the onset of S phase [9,41,42].
subsequent sections with specific emphasis on the regulation of metazoan pre-RC assembly.}
Pre-RC assembly is regulated by the Cyclin dependent kinases
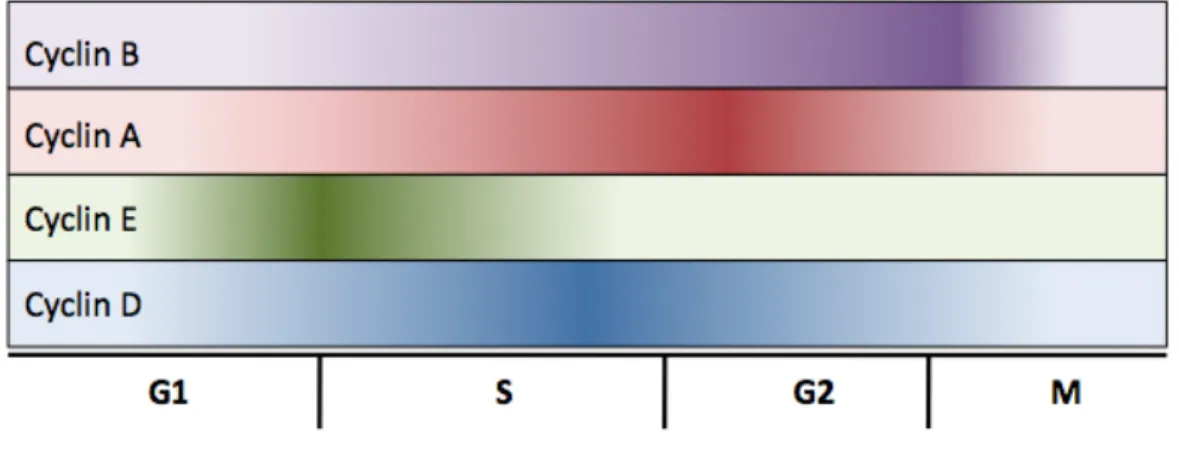
{Cyclin-dependent kinases (Cdks) are a family of serine-threonine protein kinases essential for timely and appropriate progression through different stages of the cell cycle. Cdks are activated by association with cyclins whose expression and stability are cell cycle-regulated. In budding and fission yeast, a single Cdk controls the G1/S and G2/M transitions, while in metazoans different Cdks are active in different phases of the cell cycle (Figure 1.3, reviewed in [46]). In metazoans, passage through G1 phase is governed by cyclin D/Cdk4 (or cyclin D/Cdk6) and cyclin E/Cdk2 [47,48]. S phase, and therefore DNA replication, is regulated by cyclin A/Cdk2 complexes [49]. Finally, mitotic entry is triggered by Cdk1 first binding to cyclin A and then cyclin B.
initiation but block pre-RC assembly after G1 resulting in one genome duplication per cell cycle.}
As previously mentioned, the control of pre-RC formation is tightly regulated by the abundance of the licensing factors Cdc6 and Cdt1, as well as the activity of cyclin/Cdk complexes. While this is only a single step in the long process of cell division, it is crucial to maintain the genomic stability of the cell. In order for this process to happen at the appropriate time, the correct proteins must be available and active at precisely the correct time and in the correct quantity. To ensure that this happens, these proteins are regulated at every stage of expression, from gene transcription to protein modification and degradation.
Regulation of Cell Cycle Genes by Transcription
Many of the gene products involved in cell cycle control and pre-RC formation are themselves transcribed in a cell cycle manner. The transcription of these genes are regulated by two major families of transcription factors, the E2F family and the myc family. E2F transcriptional targets are crucial for S phase entry and mitosis, whereas myc transcriptional targets are essential for general cell proliferation. Because pre-RC formation must be tightly regulated, this section focuses primarily on how these transcription factor families promote the G1/S transition.
The Rb/E2F pathway controls the expression of cell cycle genes
responsible for the transcription of genes needed to complete a successful S phase. There are 8 members of the E2F family of transcription factors (reviewed in [52] and [53]). This family contains both transcriptional activators (E2Fs 1, 2, and 3a) and transcriptional repressors (E2Fs 3b, 4, 5, 6, 7, and 8). In order to bind DNA, E2F family members bind to a dimerization partner (DP) protein [54]. E2F1 was first characterized through its association with its inhibitor protein, the Retinoblastoma (Rb) protein [55,56]. Three different proteins belong to the Rb family: pRb/p105 (hereafter referred to as pRb), which is primarily bound to the activator E2Fs, and pRb2/p130 and p107, which are primarily bound to the repressor E2Fs [53,57-59].
To keep E2F1 inactive, pRb binds the transactivation domain of the transcription factor; this interaction can occur at the target gene promoter [60-65]. The pRb/E2F complex can then recruit several additional complexes to either repress or activate transcription of its target genes (discussed below). The release of E2F constitutes a “restriction point”; once the cell has released E2F and transcription of S phase genes has begun, the cell has committed to completing the cell cycle [66,67].
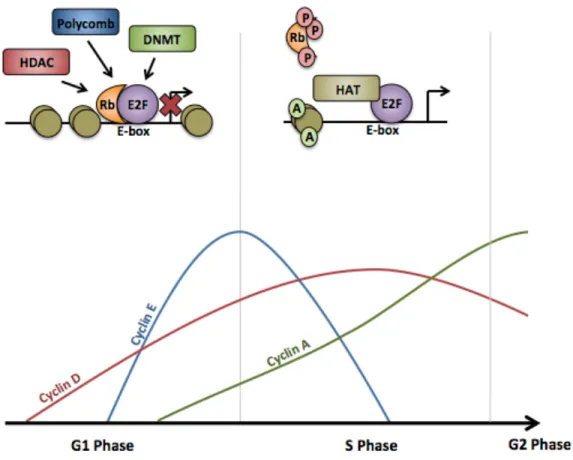
complexes become active (Figure 1.4) [74,75]. At this time, the repressor E2F complexes, pRb2/E2F4, are found at the promoters of E2F target genes, resulting in the silencing of these genes [76,77]. As cells progress into late G1, cyclin/Cdk2 complexes further phosphorylate the Rb proteins, resulting in the release of the E2F transcription factors [78]. Due to a positive feedback loop (discussed later), E2F mRNA levels begin to rise, and pRb2/p130 levels begin decrease; at this point, the third Rb protein, p107, replaces pRb2/p130 at the promoters of genes that need to be silenced, typically at the promoters of genes needed for apoptosis [77,79]. As cells transition into S phase, cyclin E/Cdk2 complexes become fully active, resulting in the dissociation of E2F activators from the pRb, thereby allowing the transcription of genes needed for S phase [54,80-82]. Following S phase entry, E2F proteins are downregulated; this is essential for cell survival as prolonged expression of E2F proteins can result in apoptosis [83-87].
indeed, cyclin/Cdk2 complexes can only phosphorylate Rb proteins that have previously been acted on by the cyclin D/Cdk4/6 complexes [91].
As SCFSkp2 levels rise, hyper-phosphorylated pRb2/p130 proteins can be ubiquitinated and targeted for proteasomal degradation [92-94]. Additionally, high levels of Cdk activity can result in the phosphorylation of serine 567 on pRb; this modification can target the protein for cleavage by a protease [95]. In addition to destruction, the Rb proteins can be dephosphorylated at the end of mitosis; this process is performed by protein phosphatases 1 and 2 [96-99].
The control of the Rb/E2F pathway is essential for proper replication. The misregulated expression of E2F is sufficient to stimulate quiescent cells to reenter the cell cycle [83]. Additionally, overexpression of any of the three Rb proteins can result in a G1 arrest [54,80-82,100-102]. Taken together, this indicates that these proteins must be tightly regulated in order for a cell to properly divide.
Rb/E2F represses target genes during G1 and S phase
or p107 [106-110].
In order to repress transcription of target genes, the pRb2/E2F4 complexes recruit chromatin remodeling factors, histone deacetylases, Polycomb proteins, or DNA methyltransferases to physically change the chromatin environment surrounding the promoter [78,111-117]. In some instances, inhibiting the activity of histone acetyltransferases can modulate the repression of E2F target genes, suggesting that the modification of the surrounding chromatin is essential for proper silencing [118]. Important targets of E2F repression include the Cdt1 inhibitor, geminin, whose expression blocks pre-RC assembly, and ribonucleoside-diphosphate reductase subunit M2 (RRM2), which is needed for nucleotide synthesis during S phase [119,120].
Importantly, when these proteins were overexpressed, there was a marked effect on cell proliferation [121-124,126]. On the other hand, when these genes were deleted in mice, the mice exhibited widespread apoptosis [130]. These phenotypes can be explained by examining the targets of E2F7/8 repression. Perhaps the most important target of E2F7/8 repression is E2F1 itself; deletion of both of these proteins leads to a drastic change in the E2F1 transcription profile [130,134]. E2F7/8 repression is necessary for the normal downregulation of E2F1, even when the ubiquitin-mediated degradation pathway, dependent on SCFSkp2, is still intact [135].
Rb/E2F activates transcription of cell cycle genes at the G1/S transition Once the cell has passed the restriction point and committed to completing the cell cycle, E2F proteins are released from their Rb binding partners and are able to activate transcription of their downstream target genes; this activation is partially due to the recruitment of histone acetyltransferases, such as p300, which leads to a more favorable chromatin environment [136]. These targets include genes that are essential for cell cycle progression, such as
they play at the cyclin E promoter shows that activity of these complexes is most likely context dependent [141-144].
Importantly, E2F activators also control the levels of the E2F and Rb proteins in a positive feedback loop [76,77,137]. The promoter of the E2F1 gene has been shown to be regulated by all activator E2Fs [77,137,145]. E2F1 also controls the transcription of the atypical E2Fs, E2F7 and E2F8; because these repressor proteins can target the promoter of E2F1, this is one way that the cell limits the amount of E2F present [130]. Additionally, E2F can induce the transcription of the F-box protein Skp2, which is a subunit of the SCFSkp2 ubiquitin ligase; the activity of this ubiquitin ligase leads to the proteasomal degradation of E2F [146].
The Rb/E2F pathway is essential for a successful mitosis
While the Rb/E2F pathway plays a crucial role in the G1/S transition, E2F proteins target a wide range of genes. When cells are depleted of all three activator E2Fs, the cells arrest in all phases of the cell cycle, suggesting that E2F target genes are needed for more than just the transition from G1 to S phase [139]. While most E2F target genes are necessary to successfully complete S phase, there are several E2F target genes that are needed for a successful division. When E2F activity is misregulated, or when Rb is depleted from cells, both Mad2, a protein involved in the spindle checkpoint, and Emi1, an inhibitor of a critical ubiquitin ligase, are overexpressed; alterations in the levels of these proteins leads to mitotic defects and aneuploidy [156,157]. These defects are partially due to the inability of condensin II to load onto the chromatin, resulting in chromatin condensation defects [158-160].
Mutations in the Rb/E2f pathway are prevalent in cancer
member and not subject to Rb-mediated regulation, low levels of E2F7 have been found in ovarian tumors and gliomas; low expression levels also correlate with a poor prognosis and decreased survival rates [171]. Misregulation of this pathway can result in double strand breaks and genome instability [172].
The Myc Family of Transcription Factors
The c-Myc protein was first identified through its homology to the viral oncogene encoded by the avian myelocytomatosis retrovirus, v-Myc [173]. The c-Myc protein contains an N-terminal transactivation domain but cannot bind DNA by itself; in order to regulate its downstream target genes, Myc has to be bound to the basic helix-loop-helix (bHLH) protein, Max (reviewed in [174] and [175]). When bound together, Myc/Max heterodimers bind to a specific DNA sequence (CACGTG) known as an E-box [176]. Myc’s ability to bind DNA and affect transcription is necessary for the oncogenic activity that has been associated with Myc deregulation; mutations in either the transactivation domain or the DNA binding domain can abolish cell proliferation and affect the cell’s ability to undergo apoptosis [177,178].
affect the transcription of proteins involved in many biological processes, such as glucose and iron metabolism, cell adhesion, and protein synthesis [186-196].
Myc can act as both a transcriptional activator by associating with histone acetyltransferases and chromatin modifiers, as well as a transcriptional repressor through its interactions with DNA methyltransferases [197-202]. When bound to target E-box sequences, the Myc/Max heterodimer can recruit TRRAP, a member of a histone acetylase complex, that can lead to acetylation of the local nucleosomes and activation of target genes [203,204]. In addition to the recruitment of TRRAP, Myc/Max heterodimers have also been shown to recruit the acetyltransferase Gcn5 [205].
While Myc can induce the transcription of a multitude of genes, it plays an important role in the induction of genes needed for cell proliferation and cell cycle progression. C-Myc has been found at the promoters of cyclins D1, D2, and B1 in humans and cyclins A and B in Drosophila melanogaster [186,203,206]. Myc has also been found at the promoter of Cdk4 [207]. Therefore, mitogenic stimuli can lead to the induction of cyclin D2/Cdk4 activity, which is turn sequesters the CKI p27; this allows cyclin E/Cdk2 complexes to be free of CKIs and become active, leading to S phase entry [208-210]. While Myc can influence cyclin and Cdk levels, perhaps the most important Myc target gene is E2F1 [211]. As described previously, this family of transcription factors controls the transcription of a variety of cell cycle genes.
particularly following terminal differentiation, is through its competition with the protein Mad [212]. Mad binds to Max, and these Mad/Max heterodimers compete with Myc/Max heterodimers for E-box binding. Once bound, Mad/Max can recruit chromatin-modifying complexes that include histone deacetylases, thereby shutting down transcription of some Myc target genes [213,214]. However, this mode of repression is not responsible for the downregulation of all Myc target genes. Myc/Max heterodimers have been found at the promoters of both active and repressed genes, suggesting that the Myc/Max interaction is needed to repress a certain subset of target genes [193]. Additionally, it has also been shown that the portion of Myc needed to bind TRRAP and other histone acetylase complexes is needed for the repression of certain target genes [215,216].
Myc can also repress transcription by antagonizing the transcriptional activator Miz1. Myc can bind to Miz1 and disrupt the interaction between Miz1 and the histone acetyltransferase p300; this method of transcriptional repression has been found at the promoters of the Cyclin dependent kinase inhibitor (CKI) genes p16, p15, and p21 [217-222]. At the p21 promoter, Myc binds to Miz1 and recruits the DNA methyltransferase DNMT3a, resulting in downregulation of p21 transcription [202].
Myc and cancer
embryonic lethality in mice at days e9.5-e10.5 [223]. Interestingly, overexpression of the protein does not induce DNA replication or division, suggesting that the oncogenic effects of Myc are due, at least in part, to its effects on other pathways [194,224]. Indeed, the c-Myc transcription factor is one of the most frequently mutated oncogenes; it is estimated to be mutated and/or deregulated in about 20% of all cancers (reviewed in [225] and [185]). Changes in its expression patterns correlate with aggressive, poorly differentiated tumors and a poor patient prognosis. Currently, evidence of c-Myc deregulation can be found in many tumor types, including colon, breast, glioblastomas, melanomas, and lung cancers [185,225-227]. C-Myc has also been implicated in Burkitt’s lymphoma; in this case, a chromosomal translocation leads to the fusion of c-Myc with one of three antibody loci, IGH@, IGK@, and IGL@ [228].
c-Myc; this suggests that previous gene expression studies may actually be misleading [235-237].
Regulation of Translation by miRNAs
After genes are transcribed, the rate at which the mRNA is transcribed can be controlled by the action of microRNAs (miRNAs), which were first described in
Caenorhabditis elegans [238,239]. miRNAs are short, non-coding RNAs, typically between 18 and 25 nucleotides, that can affect the stability and translation of mRNAs (reviewed in [240]). These RNAs are transcribed by RNA polymerases II or III, processed into small hairpins, and exported to the cytoplasm; there, these hairpins are processed further and loaded into an RNA induce silencing complex (RISC) [241-243]. These complexes can bind to the 3’ untranslated region of an mRNA, resulting in either cleavage and destruction of the message or blockage of translation [244].
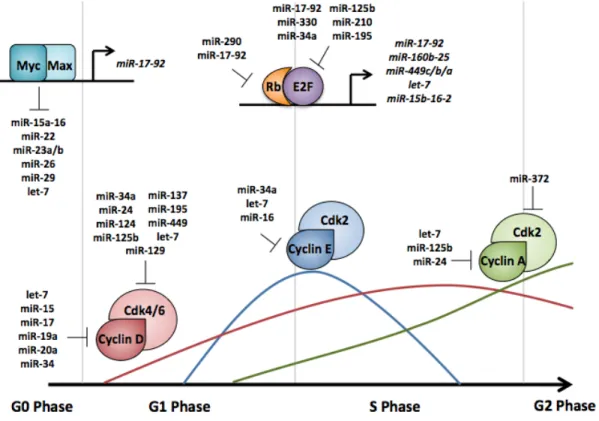
miRNAs control cyclin/Cdk complexes directly and indirectly
Because the cyclin/Cdk complexes are the master regulators of the cell cycle, it is not surprising that these proteins are heavily regulated at the post-transcriptional level as well (Figure 1.5). The translation of these proteins can be directly affected by the transcription of certain miRNAs or the activity of these proteins can be indirectly affected through downregulation of a secondary target. Cyclin D can be targeted by a multitude of miRNAs, including members of the let-7 and the miR-15 families, as well as miR-1let-7, miR-19a, miR-20a, and miR-34 [251-258]. Several of these miRNAs target additional cyclins or Cdks. For example, miR-34a also targets cyclin E and Cdk4/6; overexpression of this miRNA results in the downregulation of cyclin D/Cdk4/6 complexes and a G1 arrest [252,259,260]. Members of the let-7 family can also downregulate cyclins E, A, and B [254]. Cyclins A and B can also be regulated by miR125b and miR-24, whereas cyclin E can be regulated by miR-16 [261-263].
Both Cdk4 and Cdk6 are heavily regulated by miRNAs. The translation of these proteins can be altered by miR-24, miR-34a, miR-124, miR-125b, miR-129, miR-137, miR-195, miR-449, and let-7 family members [252-254,259,264-269]. Interestingly, both miR-124 and miR-137 are silenced by hypermethylation in certain tumor types, resulting in Cdk6 activation and subsequent E2F activation [264,265,270]. Additionally, miR-372, which is frequently downregulated in cervical cancer, can target Cdk2 [271].
amount of CKIs present. These inhibitor proteins are also highly regulated. A member of the CIP/KIP family, p21, is downregulated by the miR-17-92 miRNA cluster and by miR-106b [272,273]. Of note, miR-106b is overexpressed in many cancers [272]. Another family member, p27, is targeted by miR-221 and miR-222, leading to the activation of cyclin/Cdk complexes in a multitude of cancers [273] [274-282]. A second class of CKI, the INK4A family, can target only cyclin D containing complexes; one of the members of this family, p16, is targeted for downregulation by both miR-24 and miR-31 [266,283]. Additionally, Wee1, a negative regulator of cyclin B/Cdk1 is downregulated by several miRNAs [284,285]. Similarly, Plk1, which functions to activate cyclin B/Cdk1 through Cdc25c, is targeted by miR-100 [286].
miRNAs target the Rb/E2F pathway
Both E2F and Rb family members are targets of miRNAs. Of note, E2F1 can be targeted by several miRNAs of the miR-17-92 cluster, as well several other miRNAs, including miR-330 and miR34a [287-292]. Other members of the E2F family are also targeted. E2F3, another activator E2F, is targeted my miR-125b, miR-210, and miR-195 [253,261,293]. Additionally, the repressor E2F6 can be downregulated by miR-193a [265].
which in turn represses the DNMT genes, leading to decreased methylation throughout the genome [294].
In addition to being targeted by many miRNAs, the Rb/E2F pathways can induce the transcription of some miRNA clusters [299,300]. E2F activators can bind directly to the promoter of the miR-17-92 cluster, inducing its transcription; miRNAs in this cluster are then able to downregulate E2F expression [287,300,301]. This autoregulatory loop also occurs through the induction of the miR-160b-25 cluster [299,302]. E2F1 and E2F3 can induce the transcription of the miR-449c-b-a, the let-7a-d, the let-7i, and the miR-15b-16-2 clusters as well [303,304]. The miR-449c-b-a cluster can in turn inhibit Cdk6 and Cdc25a expression, leading to a decrease in Rb phosphorylation [303].
Myc downregulates the expression of several miRNA clusters
overexpression is due, in part, to its repression of the let-7 miRNA family [305,309].
miRNA expression is frequently altered in cancer
In recent years, it has been found that the expression patterns of miRNAs are frequently altered in cancer [310,311]. These alterations range from deletion of specific miRNA clusters to amplification of certain miRNAs [312,313]. In particular, chronic lymphocyte leukemia (CLL) was the first cancer type to be linked with changes in miRNA expression [312]. Chromosomal aberrations lead to the deletion or downregulation of the miR-15a-16-1 cluster in ~70% of the CLL cases; recently, this cluster has also been linked to other forms of cancer, including pituitary adenomas, prostate cancer, and gastric cancer [251,312,314-316].
Amplification of the miR-17-92 cluster has been found in B-cell lymphomas, and has been implicated in the angiogenesis of some solid tumors [310,317-319]. The let-7 family is downregulated in many cancer types, including breast, colon, and lung cancers [320-323]. Levels of let-7 miRNAs have also been used as a prognostic tool for lung cancer [311,324]. Additional miRNAs have been implicated in neuroblastomas, pancreatic, colon and gastric cancers [299,310,325-329].
Post-Translational Control of Cell Cycle Proteins
can be due to post-translational modifications (PTMs) of the protein itself that affect the stability or localization of the protein, the binding of an inhibitor or enhancer protein, and most importantly in the case of cell cycle control, the timed degradation of the protein. Because nearly every protein in the cell undergoes some form of post-translational control, this section focuses on the proteins that are essential for proper origin licensing.
PTMs affect the stability and activity of pre-RC components
{Re-licensing of origins during S phase is prevented, in part, by Cdk2 in association with cyclin A [49]. Cdt1 interacts with the S phase cyclin A/Cdk2 complex, which results in Cdt1 phosphorylation at threonine 29 [42,330]. Phosphorylated Cdt1 binds to the F-box protein, Skp2, the substrate receptor for the ubiquitin ligase SCFSkp2. Cdt1 is polyubiquitinated by SCFSkp2 and targeted for degradation by the 26S proteasome, thus reducing the pool of Cdt1 protein available to participate in origin licensing [331-333].}
amount of Cdc6 that remains nuclear throughout S phase is chromatin-bound and likely participates in the ATR-dependent intra-S phase checkpoint by mechanisms that are not yet understood [342,343].}
{Additionally, the Orc1 subunit of ORC is phosphorylated by cyclin A/Cdk1 during S phase, and this phosphorylation promotes Orc1 degradation in HeLa cells [9]. The same phosphorylation on Orc1 in Chinese Hamster Ovary cells (CHO) does not affect Orc1 stability, but lowers the affinity of Orc1 for chromatin [42]. In both HeLa and CHO cells, Orc1 phosphorylation allows the export of Orc1 to the cytoplasm [344]. Over-expression of cyclin A from Kaposi’s Sarcoma-associated herpes virus also facilitates re-localization of Orc1 to the cytoplasm. These results show that Orc1 is subject to phosphorylation by cyclin A/Cdk1, and this event modulates the stability and/or localization of Orc1, thereby contributing to the prevention of re-replication.
{In addition to regulating Cdc6, Cdk complexes also facilitate the formation and loading of the MCM helicase complex. Mcm3 is phosphorylated on serine 112 by Cdk1, which triggers MCM complex assembly [44]. Cdk activity affects MCM loading in an indirect fashion as well. The activity of cyclin E/Cdk2 is required for the accumulation of Cdc7 mRNA, which in turn functions in origin firing [45,340,350-352]. In quiescent cells, phosphorylation of Mcm2 at serine 5 is necessary to promote MCM loading [45,353].}
Cdt1 is regulated by the accumulation of geminin
{As another layer of regulation, metazoan S phase cells accumulate the protein geminin, which binds to Cdt1 and blocks the Cdt1-MCM interaction [354-356]. Geminin is expressed throughout the S, G2 and M phases of the cell cycle when origin licensing is inhibited [355,357]. Geminin is targeted for degradation in G1, but begins to accumulate at the end of G1 when the ubiquitin ligase responsible for its degradation (APC/CCdh1) is inactivated [357,358]. In S phase, geminin binds to the residual Cdt1 that escaped degradation and renders it unavailable to relicense origins.
cooperatively inhibit licensing [361]. Depending on the amount of geminin in the cell, geminin may switch from being an inhibitor of origin licensing to a heterotrimeric activator when levels of geminin are low.}
APC/C regulates pre-RC components as well as mitosis
{The cell spends a significant amount of energy to ensure that the correct proteins are expressed at the appropriate time. Before one cell cycle phase begins, cells ensure that the previous step has been properly completed and in many cases inactivated by controlling protein activity abundance. One mechanism for enforcing the proper order of events is through regulated protein degradation. The Anaphase Promoting Complex/Cyclosome (APC/C) is uniquely tied to cell cycle progression and control of DNA replication as evidenced by the fact its regulation and activity are modulated in every phase of the cell cycle. APC/C is a RING-type E3 ubiquitin ligase originally discovered though its association with its substrates, the mitotic cyclins [362,363]. Two activator subunits, Cdc20 and Cdh1, interact dynamically with the APC/C holoenzyme to influence substrate recognition} (Figure 1.6).
As cells progress through S phase, Cdh1 is phosphorylated by cyclin A/Cdk2 complexes; since hyper-phosphorylated Cdh1 cannot interact with APC/C, the ubiquitin ligase complex is inactive [365]. This inactivation allows geminin to accumulate and bind any remaining Cdt1 [357]. During S phase, APC/CCdh1 is also bound by its inhibitor protein, Emi1 [366]. Interestingly, Emi1 accumulation is not needed to begin S phase but is needed to signal the stop of replication and mitotic entry, even though APC/CCdc20 can still ubiquitinate its targets if Emi1 is present in mitosis [367]. Emi1 remains bound until prophase, when it is phosphorylated by Plk1 [368]. While Emi1 accumulation is not needed for S phase entry, it is essential to inhibit replication. Depletion of Emi1 leads to re-replication in human cells, due to the untimely activation of APC/CCdh1 [369,370]. This stabilization allows geminin levels to drop when Cdt1 levels are high; at the same time, increased activity of cyclin A/Cdk2 allows Cdc6 to become stabilized. With both licensing factors present, origins are licensed outside of G1 and re-replication occurs.}
CRL4Cdt2 controls the degradation of many cell cycle proteins
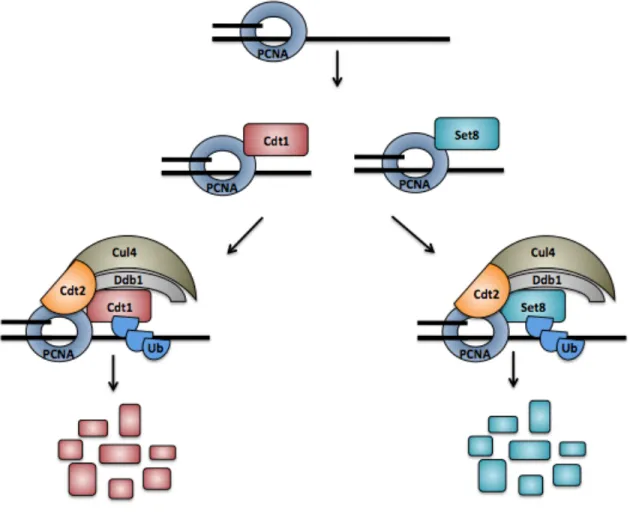
PCNA travels with active replication forks. Cdt1 interacts with PCNA through a highly conserved region called the PIP box during S phase (Figure 1.7). Cdt1 binding to DNA-loaded PCNA is essential for Cdt1 recognition by the CRL4Cdt2 ubiquitin E3 ligase. CRL4 associates with Cdt1 via direct binding to the Cdt2 substrate adapter which links to the Cul4 scaffold. Since Cdt1 only binds PCNA on chromatin, it is only ubiquitinated by chromatin-associated CRL4Cdt2. In this manner, Cdt1 degradation is directly coupled to DNA synthesis. A Cdt1 mutant that cannot bind either PCNA or cyclin/Cdk is stable during S phase and causes re-replication [371]. Likewise, Cdt2 depletion stabilizes Cdt1 in S phase, causing re-licensing of fired origins, and extensive re-replication [373,375,377].}
In addition to ubiquitinating Cdt1 at the onset of S phase, CRL4Cdt2 also targets the histone methyltransferase Set8/PR-Set7 for degradation during S phase [379-382]. Set8/PR-Set7 monomethylates histone H4 on lysine 20, a chromatin mark that promotes origin licensing [383]. Stabilization of Set8/PR-Set7 during S phase results in re-replication and a lack of chromatin condensation during mitosis [379,383,384].
Pre-RC components are frequently overexpressed in cancer
Cdc6 protein levels which may reflect not only the transcriptional up-regulation of
cyclin E and Cdc6 genes in tumors but also the stabilizing effect of cyclin E/Cdk2 on Cdc6 protein [388].}
{Overproduction of Cdt1 or Cdc6 in cultured human cells induces re-replication, raising the possibility that tumor cells also re-replicate in vivo. Recently it has been suggested that cancer cells “hyper-replicate” and that this form of replication stress is a driving force in oncogenesis. It has also been suggested that excessive pre-RC assembly may even downregulate expression of the INK4/ARF tumor suppressor locus due to interference between a nearby origin and the INK4 promoter [389]. Recently, mutations in genes for several components of the pre-RC, including Orc1, Orc4, Orc6, Cdt1, and Cdc6 have been linked to the autosomal recessive primordial dwarfism syndrome, Meier Gorlin syndrome [1,390]. This report is the first implicating impaired licensing in a developmental disorder. Taken together there are now clear links between pre-RC formation, normal human development, and tumorigenesis.}
Conclusions
tumorigenesis. This chapter has focused primarily on the control needed to properly regulate one step during the process of cell division, origin licensing.
Recent high-throughout analyses have shown that many proteins are in fact cell cycle regulated, either at the mRNA level or the protein level [391,392]. Many of these proteins are not involved in canonical cell cycle regulated processes, such as DNA replication and mitosis (Chapter 2) [392]. With the advent of mass spectrometry analysis, we are able to take a more global view of how proteins are regulated, and how this regulation is affected as the cell moves through the cell cycle.
Chapter 2
Global Proteomics Reveal Unexpected Cell Cycle Regulated Processes2
Introduction
The cell cycle is highly regulated to ensure accurate duplication and segregation of chromosomes. Perturbations in cell cycle control can result in genome instability, cell death, and oncogenesis [2-5]. Critical transition points in the cell cycle reflect “points of no return” that are difficult or impossible to reverse. For example, the G1 to S phase transition, marked by the onset of DNA replication, is an essentially irreversible step, as is mitosis. For this reason, the major cell cycle transitions into and out of S phase and mitosis are under particularly complex and robust control. The mechanisms that govern such cell cycle transitions include changes in protein abundance that are driven by combinations of regulated gene expression and protein stability control (reviewed in ref. [393]). Though decades of genetic and biochemical studies have given great insight into such mechanisms, much remains to be learned about the overall impact of cell cycle transitions on intracellular physiology.
To date, cell cycle studies have focused primarily on the regulation of DNA
2 Modified from: Cell cycle-regulated protein abundance changes in synchronously proliferating HeLa cells include regulation of pre-mRNA splicing proteins
replication (S phase), chromosome segregation (M phase), and cytokinesis. A few recent unbiased analyses of cell cycle-associated changes in human mRNA abundance suggest that other biological processes are also cell cycle-regulated [391,394]. Nevertheless, the full spectrum of cellular changes at the major cell cycle transitions is still unknown. In particular, the mRNA changes during the cell cycle in continuously growing cells are unlikely to reflect the rapid changes in concentrations of critical proteins. A 2010 study by Olsen et al. analyzed both changes in protein abundance and phosphorylation events in the human cell cycle, focusing primarily on changes in mitosis [392]. In this current study, we investigated protein abundance changes associated with S phase relative to both G1 and G2 in highly synchronous HeLa cells (human cervical epithelial carcinoma). In parallel, we have catalogued changes in the proteome in response to inhibition of ubiquitin-mediated degradation in synchronous cells. In addition to finding some of the previously-described changes related to DNA metabolism and mitosis, we also uncovered changes in many proteins involved in alternative pre-mRNA splicing.
Materials and Methods
Cell Culture and Synchronization
“Medium” cells were grown in depleted DMEM reconstituted with 798 mM L-lysine (4,4,5,5D4) and 398 mM L-arginine (13C6). “Heavy” cells were grown in depleted DMEM reconstituted with 798 mM L-lysine (13C6; 15N2) and 398 mM L-arginine (13C6; 15N4). All three media were supplemented to 10% dialyzed fetal bovine serum (dFBS; Gibco) and 2 mM L-glutamine (UCSF Cell Culture Facility). All modified isotopes were purchased from Cambridge Isotope Laboratories, Inc. (Andover, MA). All HeLa cell cultures were grown in the SILAC media for a minimum of 5 passages to ensure that the amino acids had been fully incorporated. Labeling efficiency was checked by examination of the tubulin and actin proteins using LC-MS/MS (details of sample preparation and analysis follow). T98G cells were originally obtained from ATCC and were cultured in DMEM (Sigma Aldrich) supplemented with 10% FBS (Sigma Aldrich) and 2mM L-glutamine (Gibco). Cells were synchronized by serum starvation for 72 hr and stimulated with a final concentration of 10% FBS [77].
simultaneously cultured biological replicates were harvested 3 hr following release from the second thymidine treatment (S sample) and 8 hr after release (G2 sample); one separately-labeled culture received 20 µM MG132 2 hr prior to harvesting in G2. Cells were harvested by trypsinization, collected by centrifugation, and cell pellets were stored at -80°C prior to the preparation of cell lysates. A small fraction of cells was fixed with ethanol, stained with propidium iodide, and analyzed by flow cytometry to confirm cell cycle phase.
Cell Lysis and Sample Processing
Frozen cell pellets were lysed in 50 µL high salt lysis buffer (10 mM HEPES-KOH, pH 7.5, 350 mM KCl, 3 mM MgCl2, 1% Triton-X100, 1 mM EDTA (Fisher Scientific), pH 8.0) and incubated on ice for 10 min. Lysis buffers were supplemented with 1 mM DTT, 0.1 mM AEBSF (Roche), 0.5 mM NaOV4, 2 mM !-glycerolphosphate, 2 mM NaF, 200 nM trichostatin A, 2.5 mM sodium butyrate,
and 1 µg/mL each of aprotinin, leupeptin, and pepstatin A. Unless otherwise indicated, all chemicals were purchased from Sigma Aldrich. Lysates were cleared by centrifugation for 2 min at 4°C; the supernatant was transferred to a new tube and cleared by centrifugation at full speed for 15 min at 4°C. Protein concentrations were determined according to Bradford assay instructions (Biorad). Samples were mixed 1:1:1 (70 µg each) and subjected to SDS-PAGE on a 15% polyacrylamide gel. The gel was stained with Coomassie blue (Amresco), and sample lanes were continuously excised into 25 slices.
Desalting and LC-MS/MS
G1 to S dataset can be found using the following hash code: ytUg3dJ7npt665b/ZRSADaIKbwhAbVLfVjOiV1qw0zUjr1f7rr+cJk6txiV+2CDE3cQ EnKErNJ/mV6edECVH1yf4r70AAAAAAAAM5Q==. The data from the S to G2 dataset can be found using the following hash code: Pfr5X84wSDM2MuckUXaXkFAqfoq2r94aKYgVm7NCTmz4L/pd5OpHEfoz3CxrM JfnZe86hl8j2lJMDVZjSUkc1Du8hcQAAAAAAAAOuQ==.
Database Search
The raw files were processed using the MaxQuant software suite (version 1.2.0.34) [396]. The MS/MS spectra were used to interrogate the UniProt human database (release date of November 30, 2010. 20248 entries) using the Andromeda search engine [397] with the precursor and fragment mass tolerances set to 6 ppm and 0.5 Da, respectively. Up to two missed cleavage sites were allowed per peptide. Methionine oxidation and protein N-terminal acetylation were chosen as variable modifications, and cysteine carabamidomethlyation was set as a fixed modification for database searching. Only peptides with a minimum length of 6 amino acids were considered for identification. Both peptide and protein identifications were filtered to a maximum 1% false discovery rate. Proteins identified from only a single peptide were manually checked by direct visualization of the spectra and quantified using the XCalibur software. Finally, the lists of identified proteins were filtered to eliminate reverse hits and known contaminants.
1.3, Thermo Scientific), configured with an in-house Mascot server (v2.3, Matrix Science), was also used to search the same set of MS/MS data. A built-in workflow and a “Quantification” module were used for protein identification and quantitation. All the search parameters were the same as the MaxQuant search, but were filtered at a false discovery rate of 5% to quantify a similar number of proteins as had been identified with MaxQuant. Both search strategies generated overlapping protein lists (77%). Once results were gathered from both programs, the results were combined. When proteins were identified by both programs, the quantification calculated by the MaxQuant software was reported. If the ratios were such that one program defined a protein as changed whereas the second program did not, the ratios were manually calculated through integration of the peak areas using the XCalibur software.
Proteins were divided into subsets based on their SILAC ratios using a 1.5-fold change as the cutoff threshold. That is, a ratio of 1.5 or higher was scored as an increase whereas a ratio of 0.666 or less was scored as a decrease; ratios that fell between these values were reported as no change. These ratios, as well as the log2 transformations, are reported in Supplementary Tables 1 and 2.
Dataset Comparison and GO Term Analysis
The log2 transformed data from Whitfield et al. (2002) was downloaded from www.cyclebase.org. Based on the calculated p-value of periodicity, mRNA data
calculated using Fisher’s exact test; a p-value less than 0.01 was considered significant. The same strategy was applied to comparisons to the ubiquitome [400], a published ATM/ATR substrate list [401], a published phosphoproteome [392], a Cyclin A/Cdk2 substrate list [402], and a dataset that determined the subcellular localization of proteins [403]. GO term analysis was performed using the DAVID search engine [404,405]. Analysis was performed on the individual lists, and the reported p-value was calculated using a modified Fisher’s exact test. When GO terms overlapped, terms were collapsed to the highest level (i.e., RNA splicing was collapsed into RNA processing).
Immunoblot Validation
HRP-conjugated secondary antibodies were purchased from Jackson Immunoresearch. Proteins were visualized following incubation with ECL prime reagent (Amersham).
Results
Synchronous HeLa cells progress through the G1/S and S/G2 transitions. We sought to investigate the proteome changes between G1 and S phase and between S and G2 phase. Our goal was to achieve very tight cell cycle synchrony while simultaneously avoiding strong checkpoint effects that could be induced in chemically-arrested cells. To facilitate accurate quantification of peptides by mass spectrometry, we labeled cultures for more than 5 cell divisions with three different stable isotope mixtures of lysine and arginine (i.e. amino acid-coded mass tagging/AACT or stable isotope labeling with amino acids in culture/SILAC) prior to synchronization [408-410].
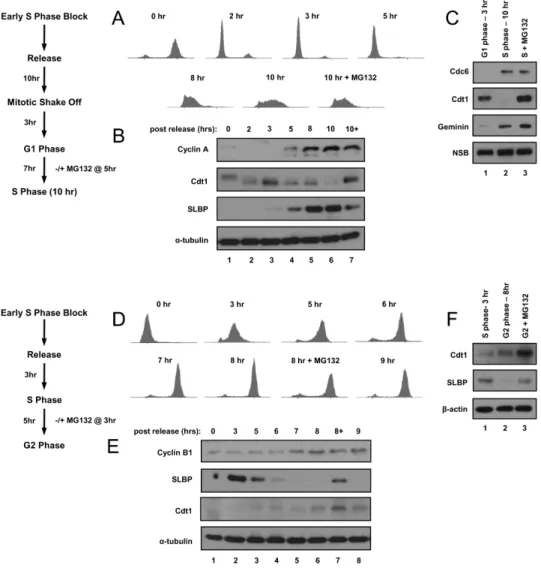
cells were a relatively pure population of G1 cells; by 10 hrs after mitosis they were in early-S phase (Figure 2.1A and 2.1B show a full time course from cells grown in normal isotope medium). Note that these cell cycle times reflect a moderate delay compared to cells grown under standard conditions due to the requirement for dialyzed fetal bovine serum for efficient metabolic labeling.
To facilitate the detection of proteins that may be rapidly degraded in S phase we treated another culture of cells with the proteasome inhibitor MG132 8 hrs after the mitotic shake-off (just prior to the G1/S transition) and harvested the cells 2 hrs later in early S phase. To quantify proteins that change between S phase and G2 phase, we released cells into S phase from the double-thymidine block rather than from a mitotic shake-off. These cells progressed through S phase and entered G2 phase synchronously; we harvested 3 hrs (S phase) and 8 hrs (G2 phase) after release from the second thymidine block (Figure 2.1D and 2.1E show a full time course from cells grown in normal isotope medium). We also treated cells with MG132 6 hrs after release (just prior to the S/G2 transition) and harvested them 2 hrs later (G2 phase).
heavy isotope medium. In this manner, we generated synchronous metabolically- labeled cell populations naturally passing from one phase to the next without the potentially confounding issue of harvesting cells from a strong checkpoint arrest.
We confirmed cell cycle position by immunoblotting whole cell lysates for established cell cycle-regulated proteins. For example, we confirmed that both the Cdc6 and geminin proteins, two targets of the Anaphase Promoting Complex/ Cyclosome (APC/C) E3 ubiquitin ligase which is active from anaphase through late G1, were substantially more abundant in the S phase lysates than in the G1 lysates (Figure 2.1C, compare lanes 2 and 3 to lane 1) [40,357,362,363,371]. In contrast to Cdc6 and geminin, the Cdt1 protein is targeted for degradation at the onset of S phase by the CRL4Cdt2 E3 ubiquitin ligase [373,374]. As expected, we detected very little Cdt1 in the early-S phase cells compared to the G1 cells (Figure 2.1C, compare lanes 1 and 2), but Cdt1 protein levels were high in the S phase cells treated with MG132 (Figure 2.1C, compare lanes 2 and 3). Moreover, we observed higher levels of Cdt1 in the G2 samples compared to the mid-S phase samples as expected because CRL4Cdt2 can only target Cdt1 during active DNA replication (Figure 2.1F, compare lanes 1 and 2) [372,374,376].
proteins Figures 2.1A and 2.1D). We conclude therefore that these protocols generated synchronous populations that display the expected differences in protein abundance of known cell-cycle regulated proteins at the G1/S and S/G2 transitions.
Protein abundance changes at the G1/S and S/G2 transitions.
[392]. Interestingly, we detected 324 proteins not found in either previous report; these could reflect proteins that are only abundant enough for detection at specific cell cycle stages or could reflect random sampling differences among the three studies (Figure 2.2A). Therefore, our proteome analysis of the G1/S and S/G2 transitions complements and extends other investigations of the HeLa cell proteome.
To focus specifically on proteins that change in abundance from G1 to S phase, we compared the 1,611 quantifiable proteins (of 1,843 identified) from cells harvested in G1 to those from the subsequent early-S phase time point. We chose a 1.5-fold change in protein abundance as the threshold to score a protein as increased or decreased; these changes were calculated using the mean of all peptides from the same protein. Between these two cell cycle phases, two-thirds (67.3%) of the proteins neither increased nor decreased in abundance, whereas 32.7% either accumulated or decreased between G1 and S phase (Figure 2.2B and C). We quantified 1,640 proteins from the S/G2 comparison (of 1,913 identified). In contrast to the G1/S comparison, a higher proportion (84.7%) of these proteins did not change by more than 1.5-fold from S to G2 phase. Of the total quantifiable proteins, 15.3% either increased or decreased in their abundance (Figure 2.2B and 2.2D). These protein lists are provided in Supplementary Tables 1 and 2, and the individual peptide lists are provided in Supplementary Table 6 (found online at http://www.plosone.org).
polyubiquitination [415,416]. Since many cell cycle transitions are driven by ubiquitin-mediated protein degradation, we reasoned that we could identify some of these proteins based on altered abundance in the presence of MG132. It is important to note that MG132 was added close to the cell cycle transition under investigation. Overall, ~1% of S phase proteins and 8% of G2 proteins were induced by MG132 treatment for 2 hrs compared to untreated early-S phase and G2 cells, respectively (Figure 2.2B, 2.2E and 2.2F, and Supplementary Tables 3.1 and 4.1). We also detected proteins that were induced by treatment with MG132 that had not shown changes between cell cycle phases. These proteins could have short half-lives and be subject to continuous ubiquitin-mediated degradation at many or all cell cycle phases. Interestingly, more proteins were down-regulated after MG132 treatment than were induced - 13% of S phase and 10% of G2 proteins (Figure 2.2B, and Supplementary Tables 3.2 and 4.2). A similar phenomenon has been reported previously; one study reported that 15% of proteins were down-regulated at least 2-fold after treating asynchronous cells with MG132 for 4 hrs [417]. The complete list of protein changes in response to MG132 treatment for both datasets is provided as Supplementary Tables 3 and 4.
at the transcriptional level, as a target of E2F4 repression, and at the protein level, as a target of the APC/C ubiquitin ligase [120,418,419].
Frequent discordance of mRNA and protein abundance.
Changes in protein abundance can often be explained by corresponding fluctuations in mRNA abundance. A landmark study by Whitfield et al. (2002) catalogued changes in mRNA expression through multiple synchronous cell cycles in HeLa cells [391]. The primary data from this extensive analysis is readily available for interrogation (cyclebase.org), and we sought to determine the relationship between mRNA expression in the Whitfield study with the protein changes we detected in this study. We divided the mRNA data into groups based on peak cell cycle phase of abundance [398,399]. We then determined which of the proteins that changed from one cell cycle phase to the next in our study were also the products mRNAs whose abundance changed in the same way. Somewhat surprisingly, there was no significant overlap between the mRNAs that peak in S phase and the detected proteins that increased in S phase; likewise, proteins that decreased in S phase were unlikely to be the products of mRNAs that decreased in S phase (Figure 2.4A, first two bars). This poor correlation also existed when we compared proteins that increased in S phase to mRNAs that peaked in G1. As pointed out by Whitfield et al., there were fewer changes in mRNA levels between G1 and S phase than there were between S and M phase; only 19.5% of transcripts peak in S phase whereas 45% peak in G2/M [391].
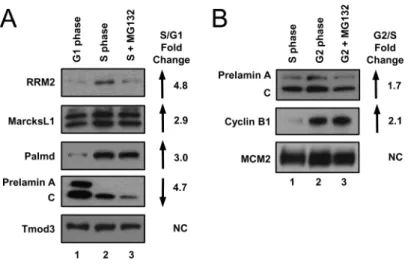
increased in our G2 samples compared to S phase (Figure 2.3B, compare lanes 1 and 2). In contrast, proteins that decreased in G2 were not well-predicted by mRNAs that also decreased in G2 (Figure 2.4A, fourth bar). Furthermore, when we compared the proteins that did not change in either of our datasets to the mRNAs that are constitutively expressed throughout the cell cycle, more than 60% of the genes/proteins were in agreement (Figure 2.4B, first two bars). When some of the proteins whose abundance did not change by mass spectrometry are the products of mRNAs that do change; these proteins may be long-lived and thus not fully reflective of corresponding mRNA changes.
present in all of our datasets, and we detected no differences in nuclear-cytoplasmic localization among proteins that changed from one cell cycle phase to the next (Figure 2.5B and 2.5C).
A strikingly large proportion of proteins whose abundance changed from G1 to S or from S to G2 have been detected as phosphoproteins, consistent with the notion that many protein abundance changes are controlled by phosphorylation (Figure 2.6A). This enrichment was true both for proteins that changed from G1 to S and for those that changed from S to G2.
Since the cyclin-dependent kinases (Cdks) govern many cell cycle transitions, we compared our sets of regulated proteins with a list of candidate Cdk substrates [402]. Many proteins that increased (6 of 31) or decreased (28 of 496) in S phase appear on this list of Cdk substrates (Figure 2.6B, first two bars). Moreover, a statistically significant number of proteins that increased in G2 phase are also putative Cdk substrates (Figure 2.6B, fifth bar). A significant number of proteins that changed with MG132 treatment at the S/G2 transition are also putative Cdk substrates (Figure 2.6B, last two bars). In contrast, proteins that changed in response to MG132 treatment at the G1/S transition were not enriched for putative Cdk substrates (Figure 2.6B, third and fourth bars).
Figure 2.5. Proteins at both the G1/S and S/G2 transitions are ubiquitinated.
potential ATR substrates (Figure 2.6C). The majority of proteins that change with MG132 treatment, (both lists), were not ATR substrates, but proteins that decreased with MG132 treatment at the S/G2 transition were significantly enriched in ATR substrates (Figure 2.6C). Taken together, these comparisons are consistent with the prevailing model that many changes in protein abundance between G1 and S phase and between S and G2 phase are associated with both protein ubiquitination and protein phosphorylation, but this analysis also underscores the idea that only some changes, particularly as cells progress from G1 to S phase in continuously growing cells, are due solely to mRNA fluctuations.
Figure 2.6. Proteins at transitions are phosphorylated. Individual lists of