13
Peginterferons in Hepatitis C Virus: Virological, Pharmacokinetic, and Clinical Implications; Editor in Chief, Paul D. Berk, M.D.; Guest Editor, Emmet B. Keeffe, M.D.Seminars in Liver Disease, volume 23, supplement 1, 2003. Correspondence and reprint requests: Alan S. Perelson, Ph.D., Theoretical Biology and Biophysics, MS K710, Los Alamos National Laboratory, Los Alamos, NM 87545. E-mail: [email protected]Theoretical Biology and Biophysics, Los Alamos National Laboratory, Los Alamos, New Mexico;2Current address: Department of Zoology, University of Oxford, Oxford, United Kingdom;3Department of Medicine and Center for the Study of Hepatitis C, Weill Medical College of Cornell University, New York, New York. Published by Thieme Medical Publishers, Inc., 333 Seventh Avenue, New York, NY 10001, USA. Tel: +1(212) 584-4662. 0272-8087,p;2003,23,s1,013,018,ftx,en;sld00218x.
Modeling Viral and Drug Kinetics:
Hepatitis C Virus Treatment with
Pegylated Interferon Alfa-2b
Kimberly A. Powers, B.A.,1 Narendra M. Dixit, Ph.D.,1Ruy M. Ribeiro, Ph.D.,1,2
Preeti Golia, M.D.,3Andrew H. Talal, M.D.,3and Alan S. Perelson, Ph.D.1
ABSTRACT
Administration of peginterferon alfa-2b plus ribavirin results in an early hepati-tis C virus (HCV) RNA decay followed by an increase as the drug concentration declines between doses. Upon administration of the next dose 1 week later, the same pattern is ob-served. We have incorporated pharmacokinetic/pharmacodynamic analysis into a model of viral dynamics to describe the effect that changes in drug concentration and effective-ness can have on viral levels. To illustrate the relationship between pharmacokinetics and viral dynamics, we fit the model to data from four HCV/human immunodeficiency virus co-infected patients, and obtained good agreement with the measured serum HCV RNA levels. We were able to account for the observed increases in HCV RNA, and estimate virion and drug half-lives that are in agreement with previous reports. Models incorporat-ing pharmacokinetics are needed to correctly interpret viral load changes and estimate drug effectiveness in treatment protocols using peginterferon alfa-2b.
KEYWORDS:PEG-IFN, pharmacokinetics, modeling, HCV, viral dynamics
T
he delayed clearance of peginterferon alfa-2b (PEG-IFN alfa-2b) from the body allows it to be dosed once weekly in HCV patients, less frequently than the usual dosing of three times a week for standard IFN alfa.1,2While once-weekly dosing results in greater venience for patients, it leads to decreases in drug con-centration between doses, resulting in decreases in effi-cacy and increases in viral load as drug concentrations drop.3The effects of the decrease in drug concentration on HCV RNA have not been explored. Explanation of the interplay among these phenomena requires a combi-nation of pharmacokinetic, pharmacodynamic, and viral dynamic models. In this article, we illustrate these prin-ciples and present a new theoretical framework tode-scribe the antiviral effectiveness of treatment with PEG-IFN alfa-2b plus ribavirin.
VIRAL LOAD DURING TREATMENT WITH PEGYLATED INTERFERON ALFA-2B
Table 1 Patient Demographics
Age Weight HCV
Patient (years) Sex Race (kg) Genotype
1 56 M Caucasian 81.7 1a
2 46 M Hispanic 88.9 1a
3 48 F African-American 81.6 1a
4 52 M Caucasian 93.4 2
Average (±SD) 50.5 ± 4.4 86.4 ± 5.8
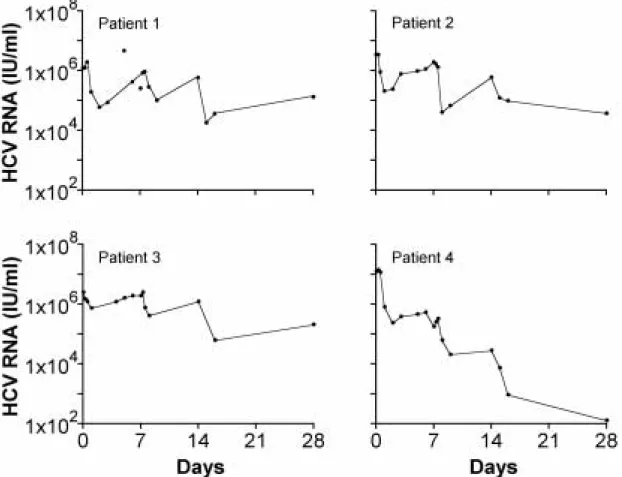
patients were also co-infected with human immunode-ficiency virus (HIV)-1 and had HIV-1 RNA levels below the limit of detection of 400 copies/mL. Serum HCV RNA was measured when the first, second, third, and fifth doses were given, and at regular intervals between doses. We analyzed the viral dynamics during the first week, when sampling was most frequent: at baseline, at 6 and 12 hours after baseline, and on days 1, 2, 3, 5, 6, and 7 after baseline. In patient #3, no measurements were taken on days 2 and 3, but a measurement was taken on day 4.
The intensive sampling schedule around the weekly doses of PEG-IFN alfa-2b allowed the charac-terization of HCV dynamics as the serum concentration
of PEG-IFN alfa-2b peaked and waned.3In most pa-tients, there was an initial fast pronounced decline in HCV RNA following the first dose, the same as had been observed in previous studies of HCV treatment.4–8 A few days after the first dose, most of the patients ex-hibited a rebound in HCV RNA (Fig. 1). We hypothe-size that this rebound resulted from a decline in drug levels and, consequently, in drug effectiveness.
MODELING OF VIRAL DYNAMICS
The Neumann et al4model of viral dynamics is described by the following set of differential equations for infected cells and free virus:
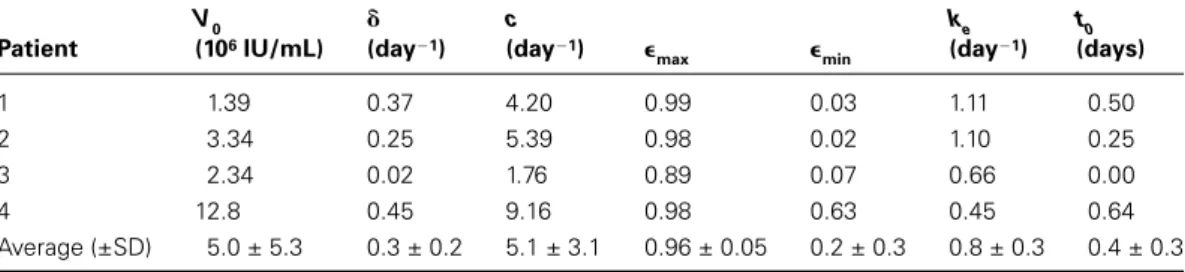
Table 2 Parameter Estimates from Fitting the Elimination-Only Model
V0 c ke t0
Patient (106IU/mL) (day1) (day1) max min (day1) (days)
1 1.39 0.37 4.20 0.99 0.03 1.11 0.50
2 3.34 0.25 5.39 0.98 0.02 1.10 0.25
3 2.34 0.02 1.76 0.89 0.07 0.66 0.00
4 12.8 0.45 9.16 0.98 0.63 0.45 0.64
Average (±SD) 5.0 ± 5.3 0.3 ± 0.2 5.1 ± 3.1 0.96 ± 0.05 0.2 ± 0.3 0.8 ± 0.3 0.4 ± 0.3
The virion production rate, p,was fixed at 10 virions/cell/day for all patients. V0and t0were estimated from fits of HCV RNA to Equation 2.
dI/dt= VT I
(1)
dV/dt=(1ε(t))pIcV
In this system, the free virus,V, infects uninfected hepatocytes (the VTterm), thereby generating infected cells,I, that subsequently produce virus at rate pper cell. The virus is cleared with rate constant c and infected cells are lost at rate per cell. PEG-IFN alfa-2b is as-sumed to block a fraction,ε(t), of the production of virus from infected cells but not to affect virion or infected cell clearance rates. To solve these equations, we assume that the number of uninfected cells,T, remains approxi-mately constant during therapy.
When drug effectiveness is constant, that is,
ε(t)=ε, these equations can be solved to yield the solu-tion, Equation 2, which predicts that viral load V(t) will decrease with (time on therapy,t.
V(t) = 1V0[
1 c+ 2ce1(tt0)+ (2)2
1 + c+ 2ce2(tt0)],
where
1= 0.5(c ++ ),2= 0.5(c + ), and
= √(c )2+ 4(1 )c.
If c >>,then1~ c and2~ε, corresponding to the first and second phase slopes observed when ln V(t)
is plotted against t. Additionally, the virus is initially as-sumed to be in steady state, so that V0represents a con-stant baseline amount of HCV RNA. The parameter t0
describes the delay usually observed between the ad-ministration of IFN and its effect in blocking virion production, which causes the initial decline in viral load. When a delay is present, Equation 2 is valid fol-lowing the delay (i.e., for t> t0), and for t< t0,V(t)= V0. While V0and t0can be roughly estimated directly from the data, here we used nonlinear least-squares regres-sion analysis to fit the first 7 days of viral load data to Equation 2 to estimate V0and t0. These values (Table 2) were used in the analyses that follow.
Modeling of Pharmacokinetics— Elimination-Only Model
While Equation 2 has been shown to accurately fit viral load data obtained when patients are treated daily with high-dose standard IFN,4–6it is not appropriate to de-scribe the changes in viral load when PEG-IFN alfa-2b is given once weekly. With once-weekly dosing there appears to be a reduction in the drug’s effectiveness in blocking viral production due to a decline in its concen-tration between doses,3 and hence the assumption of constant drug effectiveness no longer applies. If we as-sume that after the delay t0,the concentration of PEG-IFN alfa-2b simply decays exponentially, the drug con-centration,C, over time can be described by
C(t) = C0eke(tto), (3)
where C0is the drug concentration at time t0and keis the rate constant for drug elimination. Because effectiveness can be assumed to depend on drug concentration as9
(t) = C(t) (4)
IC50+ C(t) ,
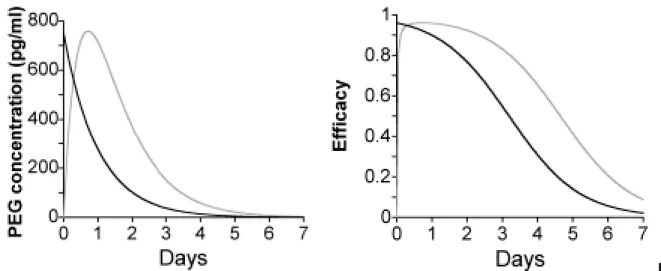
where IC50is the concentration at which the drug’s ef-fectiveness is half its maximum, the decay in drug con-centration described in Equation 3 leads to a decrease in effectiveness. Simulated changes in drug concentration and effectiveness, as predicted by this model, are dis-played in Figure 2, where we assume that Equation 4 is valid for t> t0.
Equations 3 and 4 were incorporated into Equa-tion 1 to create a new model for viral load change under PEG-IFN alfa-2b treatment. The delay t0is interpreted as comprising both the time for the drug level to rise following injection as well as the biological delay be-tween IFN binding to its cellular receptor and the anti-viral response of the infected cell. Using nonlinear least-squares regression analysis, data from the first 7 days of treatment were fitted to this “elimination-only model” (Fig. 3). Values for the parameters c,,C0/IC50, and ke
A B Figure 2 Simulated concentration and efficacy profiles with once-weekly dosing. Delays are not illustrated. Parameter values used in the simulations were: ka= 1.9 d1, k
e= 1.0 d1, Dose = 129 µg, IC50= 30.96 pg/mL, C0= 750 pg/mL, and F/ Vd= 0.012 L1. (A) Drug concentration over time; elimination-only model (black) and absorption and elimination model (grey). (B) Drug efficacy over time; elimination-only model (black) and absorption and elimination model (grey).
εmax= (C0/IC50)/[1 + (C0/IC50)], was calculated (Table 2). The corresponding average virion and drug half-lives (± SD) were 4.6 ± 3.4 hours and 23.0 ± 10.4 hours, re-spectively, consistent with previously published values.1,4 Virion production was blocked by PEG-IFN alfa-2b with an average maximum effectiveness (εmax) of 96%. In Table 2, we also show the estimated drug efficacy 7 days after the first dose, that is,εmin= (C0/IC50)(e7ke)/[1 + (C0/IC50)(e7ke)], just before the second weekly
PEG-IFN dose. In 3 of the 4 patients studied, this residual ef-fectiveness is very low (< 10%). In P4, the efef-fectiveness even one week post-injection is 63% and, as Figure 3 il-lustrates, P4 was the only patient who did not show an increase in viral load during the week. It is noteworthy that this patient was infected with genotype-2 HCV, for which a higher effectiveness of normal IFN alfa has been reported.5
Modeling of Pharmacokinetics— Absorption and Elimination Model
The “elimination-only model” used above, while simple, does not adequately describe the absorption of drug from the site of subcutaneous injection into the blood and liver. Thus we also conducted analyses with a model that in-cludes both absorption and elimination of PEG-IFN alfa-2b in the blood.9
This “absorption and elimination model” describes the change in the amount of drug in the blood (A) as follows:
dA = kaXkeA, (5)
dt
where Xis the amount of drug at the absorption site,ka
is the rate of absorption, and ke is the rate of elimina-tion. X can be further characterized as X = FDekat,
where F is the bioavailability (the extent to which the active drug enters systemic circulation) and Dis the drug dose. The solution to Equation 5 gives an expression for the amount of drug in the blood over time,A(t), and by dividing this expression by the volume of distribution,
Vd, we obtain the following equation for the concentra-tion of drug in the blood:
C(t) = kaFD ekateket, (6)
(keka)Vd
following a single injection at time t = 0. More complex expressions are needed when the drug is given multiple times. Again, changes in drug concentration affect ef-fectiveness; however, to incorporate the effects of a delay between PEG-IFN alfa-2b binding its receptor and be-ginning its biological action, we assume that the effec-tiveness at time tdepends on the drug concentration at time t , that is, there is a delay of length between a
cell sensing an IFN concentration C(t) and responding to it. Thus, for t> ,
ε(t) = C(t ) (7)
IC50+ C(t ) .
Simulated changes in concentration and effective-ness with this model, as described by Equations 6 and 7, are displayed in Figure 2. The absorption and elimination model (Equations 1, 6, and 7) was also fitted to data over the first 7 days of therapy and gave fits comparable to those shown in Figure 3 (data not shown). Conceptually, this model has an advantage over the elimination-only model in that it fully separates pharmacokinetic effects from the delays intrinsic to the interferon response. How-ever, it is more complicated mathematically, has an addi-tional parameter, and requires software specially designed to analyze delay-differential equations.
SUMMARY
ACKNOWLEDGMENTS
Portions of this work were performed under the auspices of the U.S. Department of Energy and were supported by a grant from the Speaker’s Fund for Public Health Research awarded by the City of New York, by NIH grants RR06555 (ASP), DK02573 (AHT), by a Gen-eral Clinical Research Center Grant (M01-RR00047), by Schering-Plough Research Institute, and by a Marie Curie Fellowship from the EU (RMR).
ABBREVIATIONS
HCV hepatitis C virus
HIV human immunodeficiency virus PEG-IFN pegylated interferon alfa-2b
REFERENCES
1. Glue P, Fang JW, Rouzier-Panis R, et al. Pegylated interferon-alpha 2b: pharmacokinetics, pharmacodynamics, safety, and preliminary efficacy data. Hepatitis C Intervention Therapy Group. Clin Pharmacol Ther 2000;68:556–567
2. Lindsay KL, Trepo C, Heintges T, et al. A randomized, dou-ble-blind trial comparing pegylated interferon alfa-2b to
inter-feron alfa-2b as initial treatment for chronic hepatitis C. He-patology 2001;34:395–403
3. Formann E, Jessner W, Bennett L, Ferenci P. Twice-weekly ad-ministration of peginterferon alfa-2b PEG-Intron (12kD) im-proves viral kinetics in patients with HCV genotype 1. Hepa-tology 2002;36:288A (Abstract 502)
4. Neumann AU, Lam NP, Dahari H, et al. Hepatitis C viral dy-namics in vivo and the antiviral efficacy of interferon- ther-apy. Science 1998;282:103–107
5. Neumann AU, Lam NP, Dahari H, et al. Differences in viral dynamics between genotypes 1 and 2 of hepatitis C virus. J In-fect Dis 2000;182:28–35
6. Rosen HR, Ribeiro RR, Weinberger L, et al. Early hepatitis C viral kinetics correlate with long-term outcome in patients re-ceiving high dose induction followed by combination inter-feron and ribavirin therapy. J Hepatol 2002;37:124–130 7. Zeuzem S, Schmidt JM, Lee JH, Ruster B, Roth WK. Effect
of interferon alfa on the dynamics of hepatitis C virus turnover in vivo. Hepatology 1996;23:366–371
8. Zeuzem S, Herrmann E, Lee JH, et al. Viral kinetics in pa-tients with chronic hepatitis C treated with standard or pegin-terferon alpha-2a. Gastroenterology 2001;120:1438–1447 9. Gabrielsson J, Weiner D. Pharmacokinetic and