www.nature.com/scientificreports
Robust Fusion of Diffusion MRI
Data for Template Construction
Zhanlong Yang
1,2, Geng
Chen
2, Dinggang
Shen
2,3& Pew-Thian Yap
2Construction of brain templates is generally carried out using a two-step procedure involving registering
a population of images to a common space and then fusing the aligned images to form a template. In practice, image registration is not perfect and simple averaging of the images will blur structures and cause artifacts. In diffusion MRI, this is further complicated by intra-voxel inter-subject differences in fiber orientation, fiber configuration, anisotropy, and diffusivity. In this paper, we propose a method to improve the construction of diffusion MRI templates in light of inter-subject differences. Our method
involves a novel q-space (i.e., wavevector space) patch matching mechanism that is incorporated in
a mean shift algorithm to seek the most probable signal at each point in q-space. Our method relies
on the fact that the mean shift algorithm is a mode seeking algorithm that converges to the mode of a
distribution and is hence robust to outliers. Our method is therefore in effect seeking the most probable signal profile at each voxel given a distribution of signal profiles. Experimental results show that our method yields diffusion MRI templates with cleaner fiber orientations and less artifacts caused by inter-subject differences in fiber orientation.
Brain templates1,2 capture the common features of a population of images and play crucial roles in the processing and analysis of brain images. They are widely used for guiding brain tissue segmentation, normalization of images to a common space, and brain labeling with regions of interest. Unlike templates of anatomical T1-weighted images, diffusion MRI templates afford additional white matter microstructural information that can be har-nessed for tissue characterization and axonal tracing. To ensure that the microstructural information captured at each voxel location is properly encoded in the template, dedicated techniques are needed.
Template construction generally involves fusing a population of images that are aligned to a common space. The major challenge is to retain the fine anatomical details during the template construction process, which is often affected by inaccurate image registration, especially in highly convoluted cortical regions. Many methods have been proposed to improve the quality of the constructed template3–8. They sought accurate image alignment to create templates with sharp anatomical details. To this end, nonlinear image registration9–13 is often adopted for better alignment accuracy. However, in practice, perfect registration is difficult, if not impossible. Averaging misaligned images to construct a template blurs details and introduces artifacts. In diffusion MRI14, the problem is even more challenging, since the alignment of gross anatomical structures does not necessarily guarantee the alignment of the microstructural information captured in each voxel. For example, Fig. 1 shows that the orien-tation distribution functions (ODFs) at a common voxel location might differ in orienorien-tation and configuration across subjects. In this situation, it is unclear for example how signals characterizing fiber bundles of varying orientations, which can occur naturally across subjects, should be fused to form the template. Moreover, the commonly used simple averaging method is sensitive to outliers. For instance, if the distribution of signal profiles of single-directional fiber bundles is contaminated with a small number of signal profiles of crossing fibers, sim-ple averaging will result in a crossing profile, albeit with a small secondary peak. This outcome apparently is not representative of the majority.
In this paper, we propose a novel q-space patch-matching mechanism that is incorporated in a mean shift algorithm to seek the most probable signal at each point in q-space. Mean shift is a versatile non-parametric iterative algorithm that can be used for mode seeking15. Instead of the mean, our method employs the mean shift algorithm to determine the mode of a distribution of signal profiles. The mean shift algorithm uses a kernel to measure the distance between signals. To increase robustness to noise, we measure the distance between signals
1School of Marine Science and Technology, Northwestern Polytechnical University, Xi’an, 710072, China. 2Department of Radiology and Biomedical Research Imaging Center (BRIC), University of North Carolina at Chapel Hill, NC, 27599, USA. 3Department of Brain and Cognitive Engineering, Korea University, Seoul, 02841, Korea. Zhanlong Yang and Geng Chen contributed equally to this work. Correspondence and requests for materials should be addressed to D.S. (email: [email protected]) or P.-T.Y. (email: [email protected])
Received: 16 January 2017 Accepted: 21 September 2017 Published: xx xx xxxx
using patches defined in the q-space. Patch matching is key to the success of many state-of-the-art denoising algorithms, such as non-local means16,17. Patch matching in q-space is performed with the help of azimuthal equi-distant projection18 and rotation invariant features19. Experimental results focusing on inter-subject differences in fiber orientation confirm that our method yields diffusion templates with cleaner fiber orientations and are less susceptible to artifacts caused by inter-subject differences. A preliminary version of this work has been presented in a workshop20. Herein, we provide a more comprehensive evaluation using more sophisticated synthetic data and high-quality data from the Human Connectome Project (HCP)21. The relevant experimental results, analyses, and discussions are new and not part of our workshop publication.
Results
Quantitative and qualitative experiments using synthetic and real data were performed to evaluate the proposed template construction method. For quantitative evaluation, we use the peak signal-to-noise ratio (PSNR, in dB) as the metric:
= ⋅
PSNR 10 log MAX
MSE , (1)
10 2
where MSE is the mean squared error and MAX is the maximum possible signal value. The MSE is computed as the average squared difference calculated across voxels and gradient directions.
Synthetic Data Experiment.
The dataset was simulated with b= 3,000 s/mm2 and 81 non-collineargra-dient directions. In order to simulate the dispersion of fiber orientations across subjects, we generated a set of diffusion signal profiles of fiber bundles oriented according to the Watson probability distribution function22, which in modified form is given as
θ κ| ∝ −κ − θ
f( ) exp[ (1 cos ( ))],2 (2)
where θ is the angle of deviation from the ground truth direction and the concentration parameter κ is defined as
κ=2(1−cos ( ))2 θ −
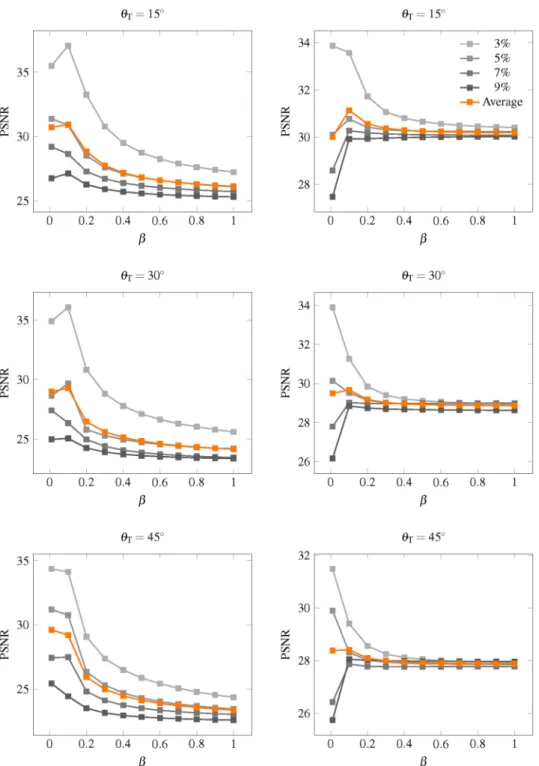
T 1. Parameter θT determines the degree of dispersion of the orientations of the fiber bundles. The distributions for θT = 15°, 30°, 45° are shown in Fig. 2. Based on the resulting fiber orientations, we use a multi-tensor model23 to generate the diffusion signal profiles. The axial and radial diffusivities are estimated from the corpus callosum of the real data, which is described in the next section. The b-value is chosen to match the
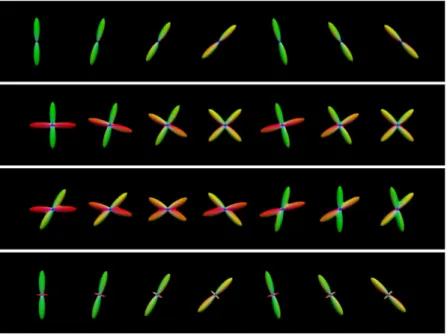
Figure 1. Inter-subject variation. The orientation distribution functions (ODFs) from a single voxel of the
www.nature.com/scientificreports/
real data. The fiber ODFs24,25 of diffusion profiles with single direction, two equally weighted directions (60° and 90° apart), and two unequally weighted directions (90° apart) are shown in Fig. 3. The “template” is computed using this distribution of diffusion signal profiles and the outcome is compared with the ground truth without deviation. Four levels of Rician noise (3%, 5%, 7% and 9%) were added to the noise free dataset. Rician noise was simulated by adding Gaussian noise (i.e. (0, ( /100))v p ) to the complex domain of the signal with noise variance determined by noise-level percentage p and maximum signal value v (150 in our case).
As shown in Fig. 4, for the various noise levels, our method improves the PSNRs over simple averaging for both one- and two-directional cases. The PSNR improvement is over 2 dB and sometimes even up to 7 dB. The fiber ODFs of some representative results, shown in Fig. 5, indicate that simple averaging causes artifacts and that the proposed method yields results that are very close to the ground truth.
We further show in Table 1 the orientational discrepancy (OD)10 between the fiber orientation estimates24,25 computed from the signal profiles generated using the two methods and the ground truth. Suppose that 1 and 2 are the sets of directions obtained from the local minima of two ODFs, OD10 is defined as
=
+
∈ ∈ dg g ∈ ∈ dg g
OD 1
2 gmax min ( , )1 1 2g 2 1 2 gmax min ( , ) ,2 2 1g 1 2 1 (3)
Figure 2. The distribution of Watson probability distribution function. The distribution of orientations
according to the Watson probability distribution function with different values for parameter θT.
Figure 3. Synthetic dataset. Examples from the synthetic dataset simulating (first row) one direction, (second
where d( , )g g =cos (− g g⋅ )
1 2 1 1 2 is the angle difference between g1 and g2.
As Table 1 shown, the two methods give reasonably good results at low level of noise and when the dispersion is small. However, when the noise level and dispersion increase, the OD values given by simple averaging are significantly higher than the proposed method.
Real Data Experiment.
Further evaluation was performed using the diffusion-weighted (DW) images of20 subjects from the HCP21. The 1.25 × 1.25 × 1.25 mm3 data were acquired with diffusion weightings b = 1000, 2000, 3000 s/mm2, each in 90 non-collinear gradient directions. 18 baseline images with low diffusion weighting
b = 5 s/mm2 were also acquired. To reduce memory cost and computational burden, we only use the b = 3,000 s/ mm2 shell in our evaluation. Prior to template construction, the DW images were registered to the FSL fractional anisotropy (FA) standard space (http://fsl.fmrib.ox.ac.uk/fsl/fslwiki/FMRIB58_FA) via diffeomorphic demons12 using the FA images. Based on the estimated deformation fields, the DW images were warped to the standard space and reorientated26.
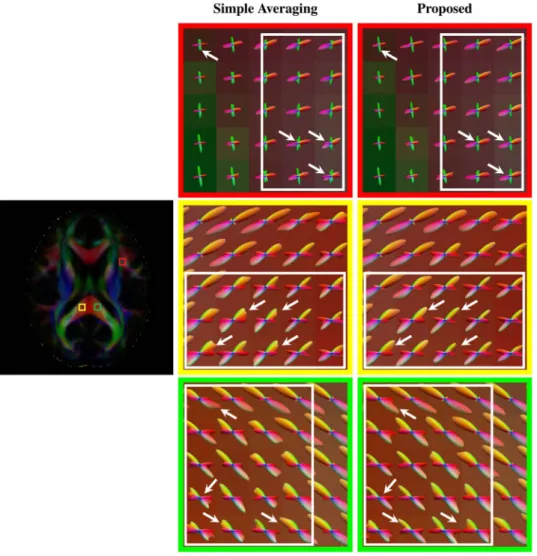
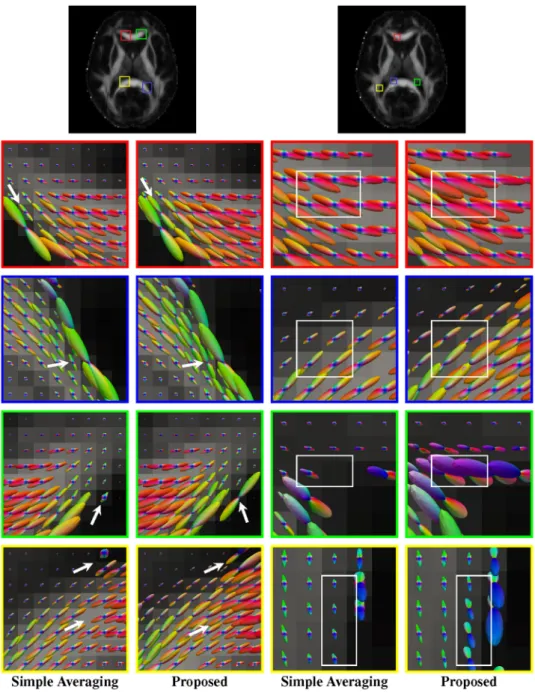
As shown in Fig. 6 (axial, close-ups in Fig. 7), Fig. 8 (coronal, close-ups in Fig. 9) and Fig. 10 (sagittal, close-ups in Fig. 11), our method produces ODFs with more consistent directions and less spurious peaks. Visible
Figure 4. PSNR comparison. PSNR comparison of results given by simple averaging and the proposed method
www.nature.com/scientificreports/
differences are marked using arrows and boxes. For simple averaging, the ODF glyphs are generally shorter, indicating less directionality. On the other hand, our method gives sharper and longer glyphs. Simple averaging is found to cause spurious peaks, whereas the proposed method shows clean results with clear directions. See, for example, the ODFs marked by arrows in the green region of interest (ROI) shown in Fig. 10.
We also evaluated the proposed method using normal quality non-HCP data. DW images of 10 subjects were acquired using a Siemens 3 T TRIO MR scanner following a standard imaging protocol: 30 diffusion directions
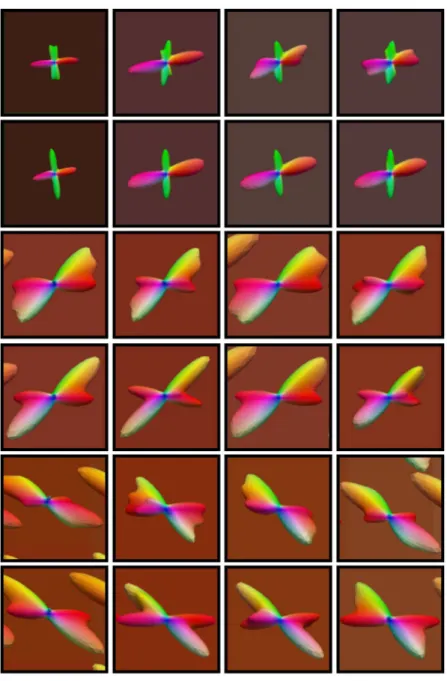
Figure 5. ODF comparison. For each case, the ground truth is shown on the far left for reference, the top row
uniformly distributed on a hemisphere, b= 1,000 s/mm2, one image with no diffusion weighting, 128 × 128 imag-ing matrix, voxel size of 2 × 2 × 2 mm3, TE = 81 ms, TR = 7,618 ms. As shown in Fig. 12, our method obtains ODFs that are more consistent and exhibit stronger directionality. Visible differences are marked using arrows
θT Noise
Single Direction 90° Separation (Equally Weighted) 60° Separation (Equally Weighted) 90° Separation (Unequally Weighted)
Averaging (°) Proposed (°) Averaging (°) Proposed (°) Averaging (°) Proposed (°) Averaging (°) Proposed (°)
15°
3% 0.0455 0.0182 0.1353 0.0348 0.0380 0.0371 0.0337 0.0227
5% 0.0599 0.0267 0.1496 0.0437 0.2351 0.1643 0.1052 0.0410
7% 0.0658 0.0458 0.2107 0.1814 0.3802 0.1766 0.3129 0.2341
9% 0.2506 0.1157 0.2780 0.1830 2.9184 0.2912 0.3737 0.2381
30°
3% 0.0696 0.0381 0.0701 0.0635 2.7727 0.1057 0.1180 0.0652
5% 0.1677 0.0804 0.2521 0.1863 3.1273 0.1856 0.2342 0.0756
7% 3.8070 0.2173 3.9694 0.2314 3.9297 1.9592 3.7208 0.1542
9% 7.0452 0.2596 6.6786 2.4269 8.2865 3.8886 4.0710 0.2392
45°
3% 0.0765 0.0554 2.8817 0.0931 6.7836 0.0797 0.0751 0.0317
5% 3.8793 0.0831 3.8226 0.2400 25.7778 3.1191 0.2293 0.0792
7% 7.1966 0.0968 7.2697 2.8693 27.5585 4.0779 7.2373 0.1717
9% 11.0748 0.3150 15.1399 5.4962 28.7225 6.0309 11.0473 0.2234
Table 1. The average OD between fiber orientation estimates and the ground truth.
Figure 6. Axial view of ODFs. ODFs estimated using simple averaging and the proposed method. Visible
www.nature.com/scientificreports/
and boxes. For simple averaging, the ODF glyphs are generally shorter, indicating weaker directionality. In con-trast, our method gives sharper and longer ODF glyphs, indicating its superiority.
Discussion
In this paper, we propose a novel patch-based mean-shift algorithm for constructing diffusion templates. Our method is less sensitive to outliers and is able to deal with inter-subject fiber dispersion. Experimental results confirm that our method yields improvements over the commonly used simple averaging method and generates diffusion templates with cleaner fiber orientations and less artifacts caused by orientation dispersion.
Reasons for Effectiveness.
Most template construction methods have been focused on improvingstruc-tural alignment in the x-space, but less so in the q-space. This work presents an effort in the direction of improv-ing microstructural alignment in the q-space by using a patch matching mechanism with the mode-seeking mean shift algorithm. The resulting improvements can be attributed mainly to the following factors: (1) Concurrent consideration of both x-space and q-space allows more fine-grained alignment. We have in fact shown that patch matching in the x-q space results in good edge preservation17; (2) Matching in this joint x-q space is in general simpler and more reliable because diffusion signal profiles are generally smooth with more predictable shapes; and (3) The mode is more robust to outliers than the mean.
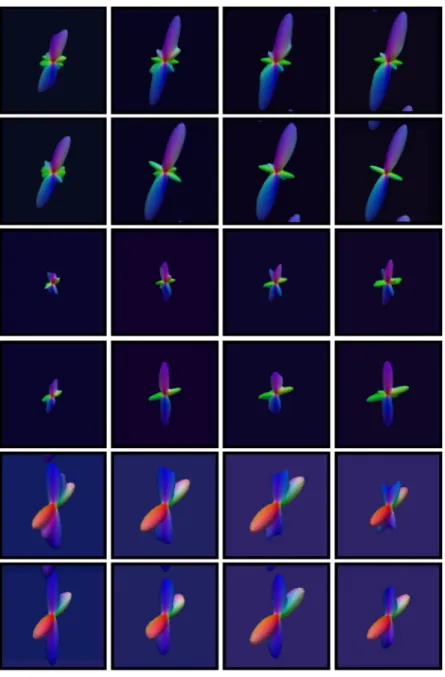
Figure 7. Axial view of ODFs (close-ups). Rows 1, 3, and 5 are the results given by simple averaging and rows 2, 4,
Future Directions.
Future efforts to improve the proposed framework will include (1) Extending the current framework to cater to more general q-space sampling methods, including multi-shell and Cartesian sampling schemes. This involves not only considering the directional aspects of the data but also the signal decay with respect to the changes of diffusion weighting. This also involves a more general representation in the q-space to take into account both changes in gradient direction and diffusion weighting; see for example Chen et al.’s work17; (2) Incorporating other methods with possibly better mathematical properties and robustness to outliers and noise than the mean-shift algorithm; (3) Incorporating pre-screening strategies to discard early mismatching patches so that the computational cost can be reduced; (4) Incorporating more sophisticated features for better q-space patch matching; see for example Chen et al.'s work27 and (5) Improving scalability to cope with popula-tions involving hundreds or thousands of subjects. Our current implementation stores all the weights resulting from patch matching and is hence memory demanding.Method
Overview.
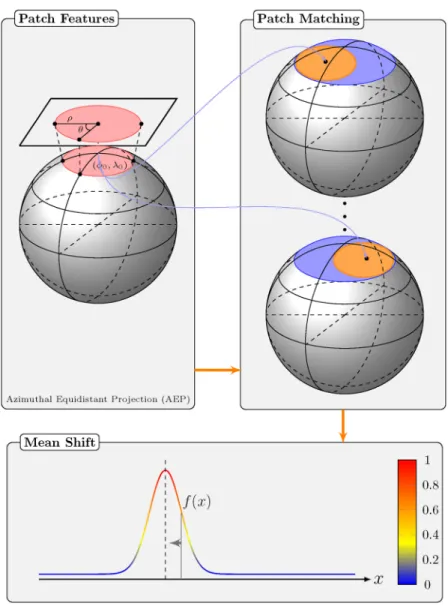
Our method employs neighborhood matching in q-space for effective template construction. Foreach point in the x-q space, (xi, qk), where xi∈3 is a voxel location and qk∈3 is a wavevector, we define a spherical patch, i k,, centered at qk with fixed qk = |qk| and subject to a neighborhood angle αp. The diffusion sig-nals on this spherical patch are mapped to a disc using azimuthal equidistant projection (AEP) before computing the rotation invariant features via polar complex exponential transform (PCET)19 for patch matching. The simi-larity weights resulting from patch matching will be used in the mean shift algorithm to determine the most probable signal at each point in x-q space. See Fig. 13 for an overview. Each step is detailed below.
Patch Features.
To make it easier to compute and compare features of a patch on a sphere, we use azimuthal equidistant projection (AEP)18 to map the coordinates on a sphere to a flat plane. Azimuthal equidistant projec-tion (AEP) is a one-to-one mapping that preserves the distances and angles between points along the longitudinal lines originating from a reference point. The reference point (φ0, λ0), with φ being the latitude and λ being thewww.nature.com/scientificreports/
longitude, corresponds in our case to the center of the spherical patch and will be projected to the center of a disc. Viewing the reference point as the ‘North pole’, all points along a given azimuth, θ, will project along a straight line from the center of the disc. In the projection plane, this line subtends an angle θ with the vertical. The distance from the center to another projected point is given as ρ. The relationship between (φ, λ) and (ρ, θ) is given as18
ρ φ φ φ φ λ λ
θ φ λ λ
φ φ φ φ λ λ
= + −
= −
− − .
cos sin sin cos cos cos( ),
tan cos sin( )
cos sin sin cos cos( ) (4)
0 0 0
0
0 0 0
The projection can be described as q → (q, φ, λ) → (q, ρ, θ). Note that, since the diffusion signals are antipodal symmetric, we map antipodally all the points on the sphere to the same hemisphere as the reference point prior to performing AEP. After projection, the q-space spherical patch is mapped to a 2D circular patch .
After AEP, we proceed to compute the rotation invariant features. A number of rotation-invariant features have been proposed in the literature, such as the popular Zernike moments (ZMs)28, pseudo-Zernike moments (PZMs)29, and polar complex exponential transform (PCET)19. PCET transforms the signals onto a set of orthog-onal basis that is complex-valued. Taking the absolute values of the complex transform coefficients results in a set of features that are not dependent on the orientation of the underlying domain. Compared with ZMs/PZMs, the computation cost of PCETs is extremely low. In addition, the PCETs are numerical more stable especially when
Figure 9. Coronal view of ODFs (close-ups). Rows 1, 3, and 5 are the results given by simple averaging and
the order of the transform is increased. For these reasons, PCET is used in this work. PCET with order n, |n| = 0, 1, 2, …, ∞, and repetition l, |l| = 0, 1, 2, …, ∞, of AEP-projected signal profile S(x, q, ρ, θ) is defined as
∫
π ρ θ ρ θ ρ ρ θ
=
ρ θ∈
⁎
M ( ) 1 [H ( , )] ( , , , ) d d ,Sx q
(5) n l, ( , , , )xq n l,
where [·]* denotes the complex conjugate and Hn,l(ρ, θ) is the basis function defined as
ρ θ = π ρ θ.
Hn l,( , ) ei n2 eil (6)
2
For each patch consisting of signal vector S( ), the associated PCET features {|M ( ) }^ |
n l, computed up to max-imum order m (i.e., −m ≤ l, n≤ m) are concatenated into a feature vector M( ).
Patch Matching.
The similarity of a reference patch i k, with another patch j l,( )d associated with the d-th subject is characterized by weight = − − − − ‖ ‖ ‖ ‖ w d Z d
h i k h
M M x x
( ) 1 exp ( ) ( ( ))
( , ) exp , (7)
i k j l
i k
i k j l i j
M x
, ; ,
,
, , 22
2 2
2 2
where Zi,k is a normalization constant to ensure that the weights sum to one, i.e.,
∑ ∑
= − − − − . = ∈ ‖ ‖ ‖ ‖ Z dh i k h
M M x x
exp ( ) ( ( ))
( , ) exp (8)
i k d
D i k j l i j
x q M x
,
1( , )
, , 22
2 2
2 2 j l i k,
P P
V
www.nature.com/scientificreports/
Here hM(i, k) is a parameter controlling the attenuation of the exponential function. As in Coupé et al.’s paper30, we set h i kM( , )= 2β σˆi k2, M( )i k, , where β is a constant30, σˆi k2, is the estimated noise standard deviation, which can be computed globally31 or spatial-adaptively30. The former is used in this paper. Parameter h = 2σ
x x
con-trols the attenuation of the second exponential function, where σx is a scale parameter estimated from the image background. M( )i k, denotes the length of the vector M( )i k, .
Given D subjects, a “mean” signal can be computed based on the weights resulting from patch matching:
∑ ∑
σ=
−
= ∈
S( , )x q w ( ) ( , ; )d S x q d 2 ,
(9) i k
d D
i k j l j l
x q
1( , ) , ; ,
2 2
j l i k,
where S(xi, qk; d) is the measured signal associated with the d-th subject at location xi∈3 with wavevector
∈
qk 3.
i k, is a local x-q space neighborhood associated with (xi, qk), defined by a radius rs in x-space and an angle αs in q-space. Note the bias associated with the Rician noise distribution is removed in this process31. σ is the Gaussian noise standard deviation that can be estimated from the image background31. Without patch match-ing, a “simple averaging” version of (9) is given as
Figure 11. Sagittal view of ODFs (close-ups). Rows 1, 3, and 5 are the results given by simple averaging and
∑
σ= − .
=
S
D S d
x q x q
( , ) 1 ( , ; ) 2
(10) i k
d D
i k 1
2 2
Mean Shift.
Given a set of diffusion signal profiles { ( , ; ): ( , )Sx qj l d x qj l ∈i k,, d=1,…, }D, we want todetermine the modal profile S( , )x qi
k. This is achieved using a mean shift algorithm15 that is modified to take advantage of the patch matching mechanism described above. Mean shift is a non-parametric algorithm for locat-ing the maxima of a density function and is hence a mode-seeklocat-ing algorithm. It is an iterative algorithm where the mean is progressively updated by using the mean computed in the previous iteration as the reference for comput-ing sample similarity. Let a kernel function K(xi − x) be given. This function determines the weight of nearby points for re-estimation of the mean. Typically a Gaussian kernel on the distance to the current estimation is used,
− = − −
K x( i x) e c x xi
2
. The weighted mean of the density in the window determined by K:
Figure 12. Normal-quality data. Comparisons of white matter fiber ODFs given by the simple averaging
www.nature.com/scientificreports/
= ∑ −
∑ −
∈
∈
m x K x x x K x x
( ) ( )
( ) , (11)
x N x i i
x N x i ( )
( ) i
i
where N(x) is the neighborhood of x, a set of points for which K(x) ≠ 0. The difference m(x) − x is called mean shift. The mean-shift algorithm now sets x← m(x), and repeats the estimation until m(x) converges.
We first note that the weights computed using (7) is dependent on the signal vector S( ) of a patch . To explicitly express this dependency, we write w ( ):d =w( ( ), ( ( )))S^ S^ d
i k j l, ; , i k, j l, . Note that we have made here the mean signal vector S( )i k, the reference for weight computation. Our implementation of the mean shift algorithm involves the following steps. For iteration t = 1, 2, …, T,
1. Update weights w ( )d =w(S − ( ), ( ( )))^ S^ d
i k j l( ), ; ,t ( 1)t i k, j l, based on (7).
2. Update the mean at each location (xi, qi) using (9) with weights {wi k j l( ), ; ,t ( )}d and {S(xj, ql; d)} for
∈
x q
( , )j l i k,.
3. Repeat steps above with t← t+ 1.
Figure 13. Method overview. Three components of our method: (1) Computation of patch features: The
Parameter Settings.
For all experiments, we use the following parameters:1. Coupé et al.30 suggested to set rs = 2 voxels and β = 1, we followed the former, but for the latter we set β = 0.1 since we have a greater number of patch candidates by considering the joint x-q space. Based on the theory of kernel regression, reducing the bandwidth when the sample size is large reduces bias. Results shown in Fig. 14 indicate that a suitable value for β is 0.1.
2. In our case, the minimal angular separation of the gradient directions is around 15° for each shell. We set the q-space neighborhood angle and search angle to twice of this value, i.e., αp = αs = 2 × 15° = 30°. 3. We set maximum order m= 4 with the consideration of both the quality of rotation-invariant features and
the computational efficiency.
4. We compute the mean absolute difference tol between the outcomes of two consecutive iterations and stop iterating when tol<γσ, where σ is the standard derivation of Gaussian noise and γ = 0.001.
www.nature.com/scientificreports/
References
1. Evans, A. C., Janke, A. L., Collins, D. L. & Baillet, S. Brain templates and atlases. NeuroImage 62, 911–922 (2012).
2. Deshpande, R., Chang, L. & Oishi, K. Construction and application of human neonatal DTI atlases. Frontiers in neuroanatomy 9, 138 (2015).
3. Yang, J., Shen, D., Davatzikos, C. & Verma, R. Diffusion tensor image registration using tensor geometry and orientation features.
Medical Image Computing and Computer-Assisted Intervention–MICCAI 2008 5242, 905–913 (2008).
4. Zacharaki, E., Shen, D., Lee, S.-K. & Davatzikos, C. A multiresolution framework for deformable registration of brain tumor images.
IEEE Transactions on Medical Imaging 27, 1003–1017 (2008).
5. Shen, D., Wong, W.-H. & lp, H. Affine-invariant image retrieval by correspondence matching of shapes. Image and Vision Computing
17, 489–499 (1999).
6. Xue, Z., Shen, D. & Davatzikos, C. Statistical representation of high-dimensional deformation fields with application to statistically constrained 3D warping. Medical Image Analysis 10, 740–751 (2006).
7. Jia, H., Wu, G., Wang, Q. & Shen, D. Absorb: Atlas building by self-organized registration and bundling. NeuroImage 51, 1057–1070 (2010).
8. Tang, S., Fan, Y., Wu, G., Kim, M. & Shen, D. Rabbit: Rapid alignment of brains by building intermediate templates. NeuroImage 47, 1277–1287 (2009).
9. Yap, P., Wu, G., Zhu, H., Lin, W. & Shen, D. TIMER: Tensor image morphing for elastic registration. NeuroImage 47, 549–563 (2009).
10. Yap, P.-T. et al. SPHERE: SPherical Harmonic Elastic REgistration of HARDI data. NeuroImage 55, 545–556 (2011).
11. Zhang, P., Niethammer, M., Shen, D. & Yap, P.-T. Large deformation diffeomorphic registration of diffusion-weighted imaging data.
Medical image analysis 18, 1290–1298 (2014).
12. Vercauteren, T., Pennec, X., Perchant, A. & Ayache, N. Diffeomorphic demons: Efficient non-parametric image registration.
NeuroImage 45, S61–S72 (2009).
13. Shen, D. & Davatzikos, C. HAMMER: Hierarchical attribute matching mechanism for elastic registration. IEEE Transactions on Medical Imaging 21, 1421–1439 (2002).
14. Johansen-Berg, H. & Behrens, T. E. Diffusion MRI: from quantitative measurement to in vivo neuroanatomy (Academic Press, 2013).
15. Comaniciu, D. & Meer, P. Mean shift: A robust approach toward feature space analysis. IEEE Transactions on Pattern Analysis and Machine Intelligence 24, 603–619 (2002).
16. Buades, A., Coll, B. & Morel, J.-M. A review of image denoising algorithms, with a new one. Multiscale Modeling & Simulation 4, 490–530 (2005).
17. Chen, G., Wu, Y., Shen, D. & Yap, P.-T. XQ-NLM: Denoising diffusion MRI data via x-q space non-local patch matching. In Medical Image Computing and Computer-Assisted Intervention (MICCAI), 587–595 (Springer, 2016).
18. Snyder, J. P. Album of Map Projections. Tile-Based Geospatial Information Systems 4, 152–161 (1989).
19. Yap, P.-T., Jiang, X. & Kot, A. C. Two-dimensional polar harmonic transforms for invariant image representation. IEEE Transactions on Pattern Analysis and Machine Intelligence 32, 1259–1270 (2010).
20. Yang, Z., Chen, G., Shen, D. & Yap, P. T. Robust construction of diffusion MRI atlases with correction for inter-subject fiber dispersion. Workshop on Computational Diffusion MRI (MICCAI), 113–121 (2016)
21. Van Essen, D. C. et al. The WU-Minn human connectome project: an overview. Neuroimage 80, 62–79 (2013).
22. Schwartzman, A., Dougherty, R. F. & Taylor, J. E. False discovery rate analysis of brain diffusion direction maps. Annals of Applied Statistics 2, 153–175 (2008).
23. Tuch, D. S. Diffusion MRI of complex tissue structure. Ph.D. thesis, Citeseer (2002).
24. Yap, P. T., Zhang, Y. & Shen, D. Multi-tissue decomposition of diffusion MRI signals via l0 sparse-group estimation. IEEE
Transactions on Image Processing 25, 4340–4353 (2016).
25. Yap, P.-T. & Shen, D. Spatial transformation of DWI data using non-negative sparse representation. IEEE transactions on medical imaging 31, 2035 (2012).
26. Chen, G. et al. Improving estimation of fiber orientations in diffusion MRI using inter-subject information sharing. Scientific Reports
6, 37847 (2016).
27. Chen, G., Dong, B., Zhang, Y., Shen, D. & Yap, P.-T. Neighborhood matching for curved domains with application to denoising in diffusion MRI. Medical Image Computing and Computer-Assisted Intervention (MICCAI), 629–637 (Springer, 2017).
28. Teague, M. Image analysis via the general theory of moments. Journal of the Optical Society of America 70, 920–930 (1980). 29. Teh, C. & Chin, R. On image analysis by the method of moments. IEEE Trans. Pattern Analysis and Machine Intelligence 10, 496–513
(1988).
30. Coupé, P. et al. An optimized blockwise nonlocal means denoising filter for 3-D magnetic resonance images. IEEE Transactions on Medical Imaging 27, 425–441 (2008).
31. Manjón, J. V. et al. MRI denoising using non-local means. Medical Image Analysis 12, 514–523 (2008).
Acknowledgements
This work was supported in part by the National Natural Science Foundation of China (No. 61540047), China Scholarship Council (CSC), and NIH grants (NS093842, EB022880, EB006733, EB009634, AG041721, MH100217, and AA012388). Data were provided [in part] by the Human Connectome Project, WU-Minn Consortium (Principal Investigators: David Van Essen and Kamil Ugurbil; 1U54MH091657) funded by the 16 NIH Institutes and Centers that support the NIH Blueprint for Neuroscience Research; and by the McDonnell Center for Systems Neuroscience at Washington University.
Author Contributions
Z.Y., G.C., and P.-T.Y. implemented the code and designed the experiments. Z.Y. drafted the manuscript. P.-T.Y. revised the manuscript. P.-T.Y. and D.S. participated in idea discussion and reviewed the manuscript.
Additional Information
Competing Interests: The authors declare that they have no competing interests.
Publisher's note: Springer Nature remains neutral with regard to jurisdictional claims in published maps and
Open Access This article is licensed under a Creative Commons Attribution 4.0 International
License, which permits use, sharing, adaptation, distribution and reproduction in any medium or format, as long as you give appropriate credit to the original author(s) and the source, provide a link to the Cre-ative Commons license, and indicate if changes were made. The images or other third party material in this article are included in the article’s Creative Commons license, unless indicated otherwise in a credit line to the material. If material is not included in the article’s Creative Commons license and your intended use is not per-mitted by statutory regulation or exceeds the perper-mitted use, you will need to obtain permission directly from the copyright holder. To view a copy of this license, visit http://creativecommons.org/licenses/by/4.0/.