Obesity Heterogeneity and Dyslipidemia in Urbanizing China
By Jane Williford
Senior Honors Thesis Biostatistics
University of North Carolina at Chapel Hill
April 24, 2020
Approved:
______________________________ Annie Green Howard, Thesis Advisor
Penny Gordon-Larson, Committee Member
ABSTRACT:
Background: Although obesity is a major risk factor for dyslipidemia, little is known about the heterogeneity of obesity, including differences in body fat distribution, the duration and timing of weight change, and whether they are associated with differential risk of dyslipidemia,
especially in Asian populations.
Methods: Using mixture models, latent classes were derived based on cross-sectional measures of waist circumference, % body fat in 2015 and longitudinal BMI data (from 1991 to 2015), for 6,258 adults (aged 18–66 years in 2015) from the China Health and Nutrition Survey.
Descriptive statistics, as well as ANOVA and Chi-squared tests, were used to test for unadjusted differences by classes. We then used multivariable general linear mixed effects models to test for associations between these latent classes and both obesity measures and metabolic markers of dyslipidemia (LDL, HDL, total cholesterol, triglycerides, apo A, apo B, Lp a, and alanine
aminotransferase). We controlled for age and sex in all models with random intercepts to control for community-level and household-level correlations. In the dyslipidemia-specific models we additionally controlled for BMI in 2015, alcohol use and smoking status.
Results: Four of the five classes had comparable average BMI values in 2015 (from 23.17 kg/m2 (0.26 standard error (s.e.)) to 23.94 kg/m2 (0.94 s.e.)) after adjustment for age and sex but noticeable differences in change in BMI prior to 2015, waist circumference, and % body fat in 2015. Classes differed by sex, age, wave of entry, and number of survey waves. An association between latent class membership and HDL was identified, with the high overall obesity over time class having 3.22 mg higher average HDL values than the class with Lower BMI, High % Body Fat in 2015 class.
Conclusion: Evidence of different patterns of obesity was found, with results indicating these patterns may be associated with differences in HDL values.
INTRODUCTION:
Noncommunicable diseases, such as cardiovascular disease (CVD) disproportionately
affect low- and middle-income countries, such as China.1, 2. In particular dyslipidemia is a
critical risk factor for CVD, particularly in Asian populations3, 4. While obesity is a risk factor
for markers of dyslipidemia, including total cholesterol, high- and low-density lipoproteins,
triglycerides, and apolipoproteins a and b, obesity has been shown to be a remarkably
patterns of adult weight gain and body fat distribution, and how different combinations of these
are associated with dyslipidemia. This is especially true for Asian populations. Previous research
has examined associations between dyslipidemia with change in one measure of obesity,
typically assuming a population average trajectory 5-8, while other more recent papers have
characterized weight change, again usually for one measure, using methods to derive patterns,
such as principal components analysis of weight over time 9, 10. Such patterning techniques are
appropriate for examining lipid markers, which show variation in relation to CVD risk. Complex
methods, such as mixture models, can provide insight by identifying distinct groups with
different underlying trajectories 11-13 and can be useful to characterize patterns of weight change
in relation to dyslipidemia markers. While such methods have been used to classify trajectories
of weight change, 14-16 they have not been widely used to examine dyslipidemia markers as a
function of different patterns of weight trajectories across adulthood. Advances in mixture
models now allow for several different obesity-related measures to be modeled simultaneously.
This allows these different measures of obesity and the distribution of body fat to play a role in
identifying classes and potentially helping identify heterogeneous patterns of obesity.
China presents a unique model for changes in obesity as the country has experienced
transition from a history of under-nutrition followed by major increase in obesity 17, 18. In
addition, there is considerable geographic and temporal heterogeneity resulting in heterogeneity
in terms of where on the body weight gain is distributed, and the timing of the transition from
underweight to overweight across the country. Therefore, in China we have sufficient variation
in both the different patterns of obesity and the shape of obesity-related trajectories which might
provide insight into the potentially differential association between these heterogenous obesity
We capitalize on multiple cross-sectional measures of obesity in 2015 and 24 years of
longitudinal weight data, to characterize and describe different patterns of obesity based on body
fat distribution and trajectory of weight change leading up to 2015. We then examine how these
groups with different patterns of distribution and timing of weight change are associated with
multiple dyslipidemia-related metabolic markers in 2015.
MATERIALS AND METHODS:
The China Health and Nutrition Survey (CHNS):
In nine survey rounds, the CHNS collected health data in 228 communities [nine diverse
provinces (Guangxi, Guizhou, Heilongjiang, Henan, Hubei, Hunan, Jiangsu, Liaoning, and
Shandong)] throughout China from 1991-2015 (1991, 1993, 1997, 2000, 2004, 2006, 2009, 2011
and 2015). In 2011, three mega-cities were added to the sample (Beijing, Shanghai, Chongqing)
and in 2015 three additional provinces (Shaanxi, Yunnan, Zhejiang). Using a multistage, random
cluster design, a stratified probability sample was used to select counties and cities stratified by
income and urbanicity using State Statistical Office definitions 20. Communities and households
were then randomly selected from these strata. The CHNS cohort initially mirrored national age–
sex–education profiles21–23. Survey procedures have been described elsewhere.19 The study was
approved by the Institutional Review Board at the University of North Carolina at Chapel Hill,
the China-Japan Friendship Hospital, Ministry of Health and China, and Institute of Nutrition
and Food Safety, China Centers for Disease Control and subjects gave informed consent for
participation.
Classifying and Describing Obesity Heterogeneity Sample
For the latent class analysis, our population of interest included all adults between the ages of 18
and 66 years in 2015 and from one of the nine original provinces in the CHNS sample.
Observations for individuals over the age of 66 years were excluded due to age-related declines
in weight due to sarcopenia. As 2015 cross-sectional weight measurements were of interest,
individuals who were over 66 years in 2015 were not eligible. We restricted the analysis to these
adults (n = 7,084) living only in the nine original provinces so to ensure we were estimating
trajectories only in populations where we had adequate information about weight change,
specifically at least three measures of BMI. All observations where individuals were pregnant in
2015 were also excluded, resulting in 41 exclusions. Individuals with fewer than two weight
measurements (N = 785) were also excluded from the analysis leaving an analysis sample of
6,258 individuals.
Dyslipidemia Markers Analytic Subset Sample
For our lipid marker specific analysis, we started with the 6,258 individuals for whom we had
derived latent classes. We then excluded individuals who were missing all the lipid outcomes of
interest (n = 1491) as well as individuals missing BMI in 2015 (n = 77), alcohol intake (n = 16)
or smoking status (n = 9), thereby leaving us with an analysis sample of 4,683 individuals.
Measures:
Dyslipidemia indicators
Following overnight fasting, a 12 ml blood sample was collected by venipuncture. Whole
stored for later laboratory analysis. All samples were processed in a national central lab in
Beijing (medical laboratory accreditation certificate ISO 15189:2007) using automatic analyzer,
with strict quality control. Eight dyslipidemia markers were used in the present study: low
density lipoprotein (LDL), high density lipoprotein (HDL), total cholesterol (TC), triglycerides
(TG), apolipoproteins A-1 and B (apo A and B), lipoprotein A (Lp a), and alanine
aminotransferase (ALT).
Plasma TG was measured by using the glycerol-phosphate oxidase method, TC by the
cholesterol oxidase method, LDL and HDL were measured by the PEG-modified enzyme
HDL-C assay. All were measured by determiner regents (Kyowa Medex HDL-Co., Ltd, Tokyo, Japan).
Alanine aminotransferase (ALT) was measured using the IFCC Enzyme method using Randox
Co, U.K. reagents, LP a using Denka Seiken, Japan reagants, apo A and B (reagents: Randox
Co., U.K.) were measured using the immunoturbidimetric method. All measures were measured
on the Hitachi 7600 automated analyzer (Hitachi Inc., Tokyo, Japan). For the central analyses,
we used continuous outcomes for LDL, HDL, TC, TG, apo A and B, Lp a, and ALT.
Anthropometry
At each visit, height was measured without shoes to the nearest 0.2 cm using a portable SECA
stadiometer, and weight was measured without shoes and in light clothing to the nearest 0.1 kg
on a calibrated beam scale. Waist circumference was measured midway between the lowest rib
and the iliac crest using a nonelastic tape. Body fat was estimated using a Tanita body
composition monitor with advanced Bioelectrical Impedance Analysis (BIA).
Self-reported questionnaires were used to collect sex, age, smoking history, alcohol intake (any
in past year) at each survey. Due to the low prevalence of smoking in women (less than 7% at
any wave reported they had ever smoked), smoking was collapsed into two categories: ever
smoked or never smoked. Urbanicity was defined using a multidimensional 12 component
urbanization index capturing community-level physical, social, cultural, and economic
environments and represents the heterogeneity otherwise missed in an urban/rural measure based
only on population density (20). Urbanicity was classified by 2015 tertiles, into low urbanicity,
medium urbanicity, and high urbanicity.
Statistical Analyses: Mixture Models
We used mixture models to identify different patterns of obesity, specifically cross-sectional
waist and percent body fat which were both measured in 2015, as well as longitudinal BMI
measurements (1991-2015). Mixture models were done using MPLUS Version 8.220 which allow
for grouping individuals based both on longitudinal and cross-sectional obesity measures. We
used statistically rigorous criteria to determine best fit via: (1) model selection using lowest
Bayesian information criterion, a well-accepted model comparison metric often used for latent
class models and (2) inclusion of at least 2% of the sample population within each trajectory
class. After model fitting, individuals were assigned membership to the class with the highest
posterior probability. Descriptive statistics specifically for the posterior probability for
individuals assigned to each class were calculated. These class assignments were used both to
Describing Obesity Heterogeneity:
Using the latent classes of obesity determined in the previous analysis, differences between
classes in 2015 obesity measures (BMI, waist circumference, and % body fat) and change in
BMI were estimated. This was done using multivariable linear mixed effect models to account
for correlation within communities and households and were adjusted for age in 2015 and sex.
While change in BMI was estimated both based on model predicted values and on the raw annual
change in BMI from first to last visit divided by the number of the years in the study, the raw
annual change only was used as an outcome in these models. PROC MIXED was used to run
these models, with the class with the largest sample size used as the reference group. These
analyses were run in the trajectory analysis complete sample as well as the analysis sub-sample
that was used for the dyslipidemia specific analysis. This was used to help determine the
descriptive names for each of the latent classes. To aid the interpretation of findings, adjusted
obesity-related outcomes with 95% CIs are estimated from the models. To further aid in
interpretation of the latent classes the unadjusted distribution of BMI by survey year was shown
by survey wave. For each model, a Wald test was used to test for an overall difference by class.
Pairwise comparisons between groups were tested using Tukey adjustment to account for
multiple comparisons.
Descriptive statistics for demographic variables and urbanization were then estimated by
class. Differences between the weight trajectory classes as a whole were explored using ANOVA
tests where the outcome was continuous, and Chi-Squared tests where the outcome was
categorical. All these analyses we done using SAS 9.4.
Using the dyslipidemia markers analytic subsample, continuous dyslipidemia related
markers were then compared across obesity class. This was done using multivariable general
linear mixed effects models that included covariates determined a priori to be of interest. We ran
two models, the first only controlling for age in 2015, sex, and 2015 BMI. The second set of the
models included the covariates from the first model as well smoking status (ever vs. never) and
alcohol intake (drank alcohol in the past 12 months or not). We adjusted for age and sex in order
to estimate the association between latent class and lipid measures independent of age and sex.
Additionally, since we want to estimate the association between obesity class and lipid measures
independent of the relationship between weight in 2015, we include BMI in 2015 in the model as
well. The second set of models controlled for the same variables as the first set but included
smoking status and alcohol intake, two common risk factors for dyslipidemia. Random intercepts
were included to account for repeated measures within communities and households. PROC
MIXED was used to run these models in SAS, with the class with the largest sample size used as
the reference group.
To aid the interpretation of findings, adjusted dyslipidemia-related outcomes with 95% CIs
are estimated from the models. For each model, a Wald test was used to test for an overall
difference for each dyslipidemia outcome by class. For each dyslipidemia outcome where we found evidence of significant difference by class, at α = 0.05, pairwise comparisons between
groups were tested using Tukey adjustment to account for multiple comparisons.
RESULTS:
The description of the population of interest for the initial sample used to create the
trajectory classes can be seen in Table 1. Overall, the sample is 50.5% women, the mean
participant age in 2015 was 49 years, the mean baseline wave for participants was 2000, and the
mean number of BMI observations was 5 kg/m2. Additionally, 78% of individuals live in areas that are either mildly urban or highly urban. Adjusting for age and sex we found statistical
overall differences between classes in terms of each obesity measure. Based on these differences,
classes were identified as follows.
1) Higher Adiposity Across All Time (High Overall)
2) Lower BMI, Increasing Over Time; Lower % Body Fat in 2015 (Lower BMI, Low %
Body Fat).
3) Lower BMI, Increasing Over Time; Higher Waist Circumference in 2015 (Lower
BMI, High Waist).
4) Lower BMI, Increasing Over Time (Lower BMI)
5) Lower BMI, Increasing Over Time; Higher % Body Fat in 2015 (Lower BMI, High
% Body Fat).
Table 2. displays the specifics of these variations in obesity measures. As their names suggest,
Higher Adiposity Across All Time had an age and sex-adjusted average BMI of 29.4 kg/m2 (s.e. 0.18) in 2015 as compared to the other groups which ranged from 23.5 kg/m2 (s.e. 0.48) to 24.2 kg/m2 (s.e. 0.30). This class also had a smaller average rate of change in BMI over time with 0.02 kg/m2/yr (s.e. 0.02) as compared to the other groups which ranged from 0.08 kg/m2/yr (s.e.
0.02) to 0.17 kg/m2/yr (s.e. 0.03). The Lower BMI, High Waist class had an age and sex
adjusted average waist circumference of 111.3 mg (s.e. 1.39) as compared to the other classes
Similarly, the Lower BMI, High % Body Fat group has an average % body fat in 2015 of 39.1
(s.e. 0.41), after adjustment for age and sex, compared to the Lower BMI, Low % Body Fat
group of 17.2 (s.e. 0.54), and 26.7 (s.e. 1.00) to 35.3 (s.e. 0.35) for the other groups. The Lower
BMI group does not have any defining differences in obesity measures other than sharing the
characteristic with 3 other classes that it starts with a similarly low BMI earlier in the study that
consistently remains below the BMI of the Higher Adiposity Across All Time at all survey
waves, although BMI does increase over time.
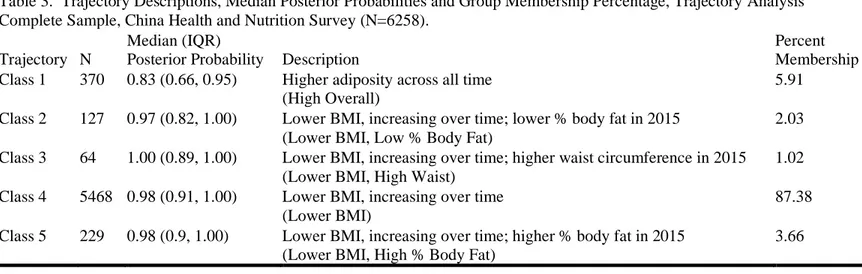
Table 3. highlights the posterior probabilities of each trajectory class, as well as gives the
description and new name of the group based on the obesity measures. Most classes had a high
median posterior probability, indicating satisfactory class assignment although the high adiposity
across all time, (High Overall) group had some individuals with lower class assignments with a
median and IQR for posterior probabilities of 0.83 and (0.66, 0.95) respectively. Individuals with
the bottom 10% of posterior probabilities compared to the upper 90% of posterior probabilities in
this High Overall group tended to be a little less urban, with an average urbanization index in
2015 of 65 as opposed to 73, had an average waist circumference of 101 cm compared to 98cm,
were a little more male with 46% in the bottom 10% and 42% males in the upper 90%, and were
older by around 3 years, 53 years as opposed to 50 years. Lower BMI increasing over time
(Lower BMI) consists of 87.4% of the sample. Individuals with the bottom 10% of posterior
probabilities in this Lower BMI group, tended to have a waist circumference of 81cm as opposed
to 84cm in the upper 90%, and were slightly less male, consisting of 45% males instead of 50%.
Looking at the descriptive statistics for covariates by class, we found evidence of
differences between the classes. These values are displayed in Table 4. We found evidence of
consisting of around 78% women and Lower BMI, High % Body Fat consisting of 19% women.
Minor age differences existed with Lower BMI, High Waist being slightly younger with a mean
age of 44 years (s.d. 10.9) as compared to the other classes whose mean age ranged from 49
years (s.d. 10.8) to 54 years (s.d. 9.0). Lower BMI, Low % Body Fat had slightly more
observations with a mean of 6 (s.d. 2.5) compared to other with an average of 5 BMI
observations. Lower BMI, High Waist had a higher average baseline wave of 2002 (s.d. 7.6)
compared to other classes with averages of 1998 or 1999. Urbanicity in 2015 also differed
among the classes. Overall, the High Overall group, the Lower BMI, High % Body Fat group,
and the Lower BMI Group seem slightly more urbanized than the Lower BMI, Low % Body Fat
and the Lower BMI, High Waist groups.
Once the exclusionary criteria were applied, the descriptive statistics were estimated for
the LCGA analysis sample as well to determine how the subsample would compare to the
original sample. Variations can be seen by comparing Table 1. with Supplementary Table 1.,
Table 2. with Supplementary Table 2., Table 3. with Supplementary Table 3., and Table 4. with
Supplementary Table 4. There were only a few notable differences between these samples. Of
the 1575 people excluded, those excluded were more likely to be in the Lower BMI, High Waist
class with 32% of this class being excluded compared to 12% to 26% of the other classes.
Otherwise the samples look pretty similar demographically.
Association between Obesity Heterogeneity and Dyslipidemia:
The models controlling for age, sex, and 2015 BMI are shown in Figure 3. The only
dyslipidemia outcome with overall differences between the classes was HDL with a p-value of
found a borderline significant pairwise difference at the alpha of 0.05. This difference was
between the High Overall class and the Lower BMI, High % Body Fat class (p = 0.049), where
the adjusted HDL for the High Overall class is 50.2 (s.e. 0.81) compared to 47.0 (0.94) for the
Lower BMI, High % Body Fat class. The results for the models that additionally controlled for
alcohol intake and smoking also showed the overall difference of HDL between classes with a
significant p-value, however, with none of the pairwise tests showing significant results once adjusting using Tukey’s method, the p-value that was previously significant, now sitting right
above the threshold of 0.05. The fully adjusted models are shown in Figure 4.
DISCUSSION:
Through these analyses we found evidence of different patterns of obesity. Specifically, a
group with higher BMI across time, and groups which had similar BMI patterns but differed by
% body fat and waist circumference.
We also found evidence of differences by obesity classes in dyslipidemia, specifically
HDL. In the minimally adjusted model, only adjusted for BMI, Sex, and Age, the class with
higher overall adiposity over time (High Overall) has HDL values 3.2 mg higher on average than
the class with a lower BMI increasing over time and a higher percent body fat in 2015 (Lower
BMI, High % Body Fat). Our study suggests higher % body fat, in combination with a period of
increasing obesity, might result in potentially poorer HDL outcomes as compared to simply a
longer duration of obesity, which has been shown to be associated with the occurrence of
cardiometabolic risk factors21-23. The model adjusted additionally for alcohol intake and smoking
comparisons. Our findings do suggest there may be variation in risk across differential patterns
of obesity metrics and trajectories that are masked in more homogeneous measures of weight and
weight gain. These patterns are concerning as more recent, rapid weight gain is becoming
common in China and children are entering the adult years at higher body weights than in
previous generations. Approximately 80% of diabetes deaths occur in low- and middle-income
countries 24 and China has experienced rapid increases in diabetes and other cardiometabolic
diseases.25-27
Although this was the only outcome that had overall model significance, we were limited
by sample size. The vast majority of individuals, 87.4%, were classified as belonging to one
group, with a size of 5,468, with other classes ranging in size from 64 to 370 individuals. While
there could truly not be differences between other classes and other dyslipidemia markers, it
could also be that we have limited statistical power with such small class sizes. Thus, a
replication of these classes in other cohorts with larger sample sizes may allow us to understand
these results and associations better.
Additionally, we did not adjust for the multiple comparisons, using α = 0.05, for testing
for overall differences between eight different outcomes. Therefore, our findings with regards to
HDL could be by chance as by not controlling for multiple comparisons we have an inflated type
I error rate (probability of finding differences when there are none). However, due to the already
limited statistical power, we felt that these findings might still provide a valuable contribution to
FIGURES:
Fig.2 Results from latent class model controlling for age and sex, displaying BMI trajectory summaries with 2015 Body Fat.
0 5 10 15 20 25 30 35
1995 2000 2005 2010 2015
Predicted Average BMI By Class
Class 1 (N = 370) Class 2 (N = 127) Class 3 (N = 64)
Fig.3 Model 1: Predicted metabolic markers of dyslipidemia, generated from general linear mixed models. Data represent the expected outcomes with 95% CIs. Each y-axis corresponds to the outcome noted below the figure. Results are shown controlling for age, sex, and BMI in 2015. The percentage sample in each class is shown below the graphs. *p<0.05 for group differences in an overall test for weight trajectories. Weight trajectory summaries show a different color for each weight trajectory class, with percentage of sample in each class shown below.
Fig.4 Model 2: Predicted metabolic markers of dyslipidemia, generated from general linear mixed models. Data represent the expected outcomes with 95% CIs. Each y-axis corresponds to the outcome noted below the figure. Results are shown controlling for smoking, alcohol intake, age, sex, and BMI in 2015. The percentage sample in each class is shown below the graphs. *p<0.05 for group differences in an overall test for weight trajectories. Weight trajectory summaries show a different color for each weight trajectory class, with percentage of sample in each class shown below.
TABLES
Table 1. Descriptive Statistics for Overall 2015 Covariates, Trajectory Analysis Complete Sample, China Health and Nutrition Survey (N=6258)
Covariates Overall
Women % 50.5
Age in years in 2015, Mean (Std) 49.1 (10.72)
Urbanicity in 2015, %
Low Urbanicity 22.3
Medium Urbanicity 42.4
High Urbanicity 35.3
Baseline Wave, Mean (Std) 1999.5 (7.61)
Number of Observations, Median, Mean (Std) 5.1 (2.45)
Supplementary Table 1. Descriptive Statistics for Overall 2015 Covariates, Dyslipidemia Markers Analytic Subset Sample, China Health and Nutrition Survey (N=4683)
Covariates Overall
Women % 53.9
Age in years in 2015, Mean (Std) 50.3 (10.23)
Urbanicity in 2015, %
Low Urbanicity 23.1
Medium Urbanicity 42.5
High Urbanicity 34.4
Baseline Wave, Median (IQR) 1999.1 (7.55)
Table 2. Outcomes of BMI in 2015, waist circumference in 2015, percent body fat in 2015, and annual change in BMI from wave of entry to 2015. Estimates generated from general linear mixed models. Results are adjusted for age and sex. From Trajectory Analysis Complete, Sample China Health and Nutrition Survey (N=6258).
High Overall
Lower BMI, Low % Body Fat
Lower BMI,
High Waist Lower BMI
Lower BMI, High % Body Fat Mean BMI (kg/m2) 29.3 (0.18) 24.2 (0.30) 23.5 (0.48) 23.9 (0.07) 23.7 (0.23)
Mean waist circumference (mg) 96.8 (0.55) 85.1 (0.86) 111.3 (1.39) 84.1 (0.26) 85.6 (0.66)
Mean percent body fat 35.3 (0.35) 17.2 (0.54) 26.7 (1.00) 27.9 (0.14) 39.1 (0.41)
Mean annual change in BMI
(kg/m2/yr) 0.02 (0.02) 0.17 (0.03) 0.09 (0.04) 0.14 (0.01) 0.08 (0.02)
Supplementary Table 2. Outcomes of BMI in 2015, waist circumference in 2015, percent body fat in 2015, and annual change in BMI from wave of entry to 2015. Estimates generated from general linear mixed models. Results are shown adjusting for age and sex. From Dyslipidemia Markers Analytic Subset Sample, China Health and Nutrition Survey (N=4683).
High Overall
Lower BMI, Low % Body Fat
Lower BMI,
High Waist Lower BMI
Lower BMI, High % Body Fat
Mean BMI (kg/m2) 29.6 (0.20) 24.4 (0.32) 23.9 (0.61) 24.0 (0.08) 23.8 (0.25)
Mean waist circumference (mg) 97.3 (0.58) 85.3 (0.91) 111.6 (1.82) 84.2 (0.27) 85.6 (0.72)
Mean percent body fat 35.5 (0.36) 17.8 (0.57) 28.1 (1.10) 28.0 (0.14) 39.1 (0.45) Mean annual change in BMI
Table 3. Trajectory Descriptions, Median Posterior Probabilities and Group Membership Percentage, Trajectory Analysis Complete Sample, China Health and Nutrition Survey (N=6258).
Trajectory N
Median (IQR)
Posterior Probability Description
Percent Membership Class 1 370 0.83 (0.66, 0.95) Higher adiposity across all time
(High Overall)
5.91
Class 2 127 0.97 (0.82, 1.00) Lower BMI, increasing over time; lower % body fat in 2015 (Lower BMI, Low % Body Fat)
2.03
Class 3 64 1.00 (0.89, 1.00) Lower BMI, increasing over time; higher waist circumference in 2015 (Lower BMI, High Waist)
1.02
Class 4 5468 0.98 (0.91, 1.00) Lower BMI, increasing over time (Lower BMI)
87.38
Class 5 229 0.98 (0.9, 1.00) Lower BMI, increasing over time; higher % body fat in 2015 (Lower BMI, High % Body Fat)
3.66
Supplementary Table 3. Trajectory Descriptions, Median Posterior Probabilities and Group Membership Percentage, Dyslipidemia Markers Analytic Subset Sample, China Health and Nutrition Survey (N=4683)
Trajectory N
Median (IQR)
Posterior Probability Description
Percent Membership Class 1 294 0.83 (0.67, 0.96) Higher adiposity across all time
(High Overall)
6.28
Class 2 112 0.97 (0.84, 1.00) Lower BMI, increasing over time; lower % body fat in 2015 (Lower BMI, Low % Body Fat)
2.39
Class 3 44 1.00 (0.89, 1.00) Lower BMI, increasing over time; higher waist circumference in 2015 (Lower BMI, High Waist)
0.94
Class 4 4045 0.99 (0.95, 1.00) Lower BMI, increasing over time (Lower BMI)
86.38
Class 5 188 0.98 (0.89, 1.00) Lower BMI, increasing over time; higher % body fat in 2015 (Lower BMI, High % Body Fat)
Table 4. Descriptive Statistics for 2015 Covariates by Trajectory Class, Trajectory Analysis Complete Sample, China Health and Nutrition Survey (N=6258)
Covariates High Overall
Lower BMI, Low % Body Fat
Lower BMI,
High Waist Lower BMI
Lower BMI,
High % Body Fat p-value
Women % 54.1 78.0 50.0 51.0 18.8 <0.0001
Age in years in 2015, Mean
(Std) 50.6 (9.48) 53.5 (9.03) 43.7 (10.94) 48.9 (10.8) 50.4 (10.33) <0.0001
Urbanicity in 2015, % <0.0001
Low Urbanicity 19.2 37.8 20.3 22.2 23.1
Medium Urbanicity 43.8 28.4 62.5 42.7 34.1
High Urbanicity 37.0 33.9 17.2 35.1 42.8
Baseline Wave, Mean (Std) 1998.9 (7.31) 1997.7 (7.33) 2001.6 (7.63) 1999.5 (7.63) 1999.5 (7.64) 0.0075 Number of Observations,
Median, Mean (Std) 5 .3(2.29) 5.9 (2.45) 4.8 (2.30) 5.1 (2.46) 5.2 (2.41) 0.0009
Supplementary Table 4. Descriptive Statistics for 2015 Covariates by Trajectory Class, Dyslipidemia Markers Analytic Subset Sample, China Health and Nutrition Survey (N=4683)
Covariates High Overall
Lower BMI, Low % Body Fat
Lower BMI,
High Waist Lower BMI
Lower BMI,
High % Body Fat p-value
Women % 55.4 75.0 54.6 54.9 18.6 <0.0001
Age in years in 2015, Mean
(Std) 51.4 (9.19) 53.5 (9.10) 46.4 (10.86) 50.1 (10.32) 51.2 (9.91) <0.0001
Urbanicity in 2015, % <0.0001
Low Urbanicity 18.4 38.4 11.4 23.0 25.0
Medium Urbanicity 43.5 26.8 70.5 42.9 35.1
High Urbanicity 38.1 34.8 18.2 34.1 39.9
Baseline Wave, Median
(IQR) 1998.8 (7.25) 1997.2 (7.17) 2000.1 (7.02) 1999.1 (7.58) 1999.0 (7.72) 0.0830 Number of Observations,
REFERENCES:
1. Mozaffarian D, Fahimi S, Singh GM, Micha R, Khatibzadeh S, Engell RE, Lim S, Danaei G, Ezzati M and Powles J. Global Sodium Consumption and Death from Cardiovascular Causes. New England Journal of Medicine. 2014;371:624-634.
2. World Health Organization. Global status report on noncommunicable diseases 2014. 2014.
3. Eastern Stroke and Coronary Heart Disease Collaborative Research Group. Blood pressure, cholesterol, and stroke in eastern Asia. The Lancet. 1998;352:1801-1807.
4. Wu Z, Yao C, Zhao D, Wu G, Wang W, Liu J, Zeng Z and Wu Y. Sino-MONICA Project. Circulation. 2001;103:462-468.
5. Oguma Y, Sesso HD, Paffenbarger RS, Jr. and Lee IM. Weight change and risk of developing type 2 diabetes. Obesity research. 2005;13:945-51.
6. Colditz GA, Willett WC, Rotnitzky A and Manson JE. Weight gain as a risk factor for clinical diabetes mellitus in women. Ann Intern Med. 1995;122:481-6.
7. Chan JM, Rimm EB, Colditz GA, Stampfer MJ and Willett WC. Obesity, fat distribution, and weight gain as risk factors for clinical diabetes in men. Diabetes care. 1994;17:961-9. 8. Schienkiewitz A, Schulze MB, Hoffmann K, Kroke A and Boeing H. Body mass index history and risk of type 2 diabetes: results from the European Prospective Investigation into Cancer and Nutrition (EPIC)-Potsdam Study. Am J Clin Nutr. 2006;84:427-33.
9. Neiberg RH, Wing RR, Bray GA, Reboussin DM, Rickman AD, Johnson KC, Kitabchi AE, Faulconbridge LF, Kitzman DW and Espeland MA. Patterns of Weight Change Associated With Long-Term Weight Change and Cardiovascular Disease Risk Factors in the Look AHEAD Study. Obesity. 2012;20:2048-2056.
10. Waring ME, Eaton CB, Lasater TM and Lapane KL. Incident Diabetes in Relation to Weight Patterns During Middle Age. Am J Epidemiol. 2010;171:550-556.
11. Andruff H, Carrari N, Thompson A, Gaudreau P and Louvet B. Latent Class Growth Modelling: A Tutorial. Tutorials in Quantative Methods for Psychology. 2009;5:11-24. 12. Nagin DS. Analyzing developmental trajectories: A semiparametric, group-based approach. Psychological methods. 1999;4:139.
13. Nagin DS. Group-based modeling of development. Cambridge, MA: Harvard University Press; 2005.
14. Ostbye T, Malhotra R and Landerman LR. Body mass trajectories through adulthood: results from the National Longitudinal Survey of Youth 1979 Cohort (1981-2006). International journal of epidemiology. 2011;40:240-50.
15. Jun H-J, Corliss HL, Nichols LP, Pazaris MJ, Spiegelman D and Austin SB. Adult Body Mass Index Trajectories and Sexual Orientation: The Nurses' Health Study II. American Journal of Preventive Medicine. 2012;42:348-354.
16. Clarke PJ, O'Malley PM, Schulenberg JE and Johnston LD. Midlife health and
socioeconomic consequences of persistent overweight across early adulthood: findings from a national survey of American adults (1986-2008). American journal of epidemiology.
2010;172:540-8.
17. Popkin BM. Will China's nutrition transition overwhelm its health care system and slow economic growth? Health Aff (Millwood). 2008;27:1064-76.
19. Popkin BM, Du S, Zhai F and Zhang B. Cohort Profile: The China Health and Nutrition Survey--monitoring and understanding socio-economic and health change in China, 1989-2011. International journal of epidemiology. 2010;39:1435-40.
20. Muthen B and Muthen L. Mplus User’s Guide. Seventh Edition. Los Angeles, CA: Muthén & Muthén; 1998-2012.
21. Wildman RP, Muntner P, Reynolds K, McGinn AP, Rajpathak S, Wylie-Rosett J and Sowers MR. The Obese Without Cardiometabolic Risk Factor Clustering and the Normal Weight With Cardiometabolic Risk Factor Clustering: Prevalence and Correlates of 2 Phenotypes
Among the US Population (NHANES 1999-2004). Arch Intern Med. 2008;168:1617-1624. 22. Brochu M, Tchernof A, Dionne IJ, Sites CK, Eltabbakh GH, Sims EA and Poehlman ET. What are the physical characteristics associated with a normal metabolic profile despite a high level of obesity in postmenopausal women? J Clin Endocrinol Metab. 2001;86:1020-5.
23. Janssen I, Katzmarzyk PT and Ross R. Duration of overweight and metabolic health risk in American men and women. Ann Epidemiol. 2004;14:585-91.
24. WHO. The Global Status Report on Noncommunicable Diseases 2010 Editors: World Health Organization. 2011:176.
25. Lee CM, Huxley RR, Lam TH, Martiniuk AL, Ueshema H, Pan WH, Welborn T and Woodward M. Prevalence of diabetes mellitus and population attributable fractions for coronary heart disease and stroke mortality in the WHO South-East Asia and Western Pacific regions. Asia Pacific journal of clinical nutrition. 2007;16:187-92.
26. Gu D, Gupta A, Muntner P, Hu S, Duan X, Chen J, Reynolds RF, Whelton PK and He J. Prevalence of cardiovascular disease risk factor clustering among the adult population of China: results from the International Collaborative Study of Cardiovascular Disease in Asia (InterAsia). Circulation. 2005;112:658-65.