Suchi K. Parekh Quantitative Analysis to Compare Smart Cities. A Master’s Paper for the M.S. in I.S degree. May, 2020. 50 pages. Advisor: Arcot Rajasekar
Today, a lot of research is being done to determine the top smart cities in the world. Most of this research work rank the cities on the basis of qualitative analysis. Qualitative methods typically use subjective judgment and not statistical data and therefore,
although, they may provide valuable findings, it is difficult to prove the results. Our work is a step towards performing quantitative analysis to rank and compare smart cities. We randomly selected four smart cities and used their open data to figure out if we really have data that can be used to perform quantitative analysis to compare them. We focused on the ‘transportation’ dimensionality and devised a method to extract information from open data. Our method is also independent of dimensionality and data and therefore can be applied to other dimensionalities to gather an overall picture of the smart cities and perform quantitative research to compare them.
Headings:
Data Mining
QUANTITATIVE ANALYSIS TO COMPARE SMART CITIES
by Suchi K Parekh
A Master’s paper submitted to the faculty of the School of Information and Library Science of the University of North Carolina at Chapel Hill
in partial fulfillment of the requirements for the degree of Master of Science in
Information Science.
Chapel Hill, North Carolina May 2020
Approved by
Table of Contents
Section-1 Introduction ... 2
1.1 Background ... 2
1.2 Objectives ... 4
1.3 Research Questions ... 5
Section 2- Literature Review ... 6
2.1 What is a smart city? ... 6
2.2 Domains of Smart City ... 7
2.3 Which smart cities? ... 9
2.4 Methods to rank cities on smartness ... 12
2.4.1 Different modelling approaches for comparison ... 14
2.4.2 Benchmarking methods ... 16
2.4.3 Quantitative approaches ... 18
Section 3 - Methodology ... 20
3.1 Prepare initial Metadata ... 22
3.2 Select one category ... 23
3.3 Compare the metadata for the ‘transportation’ category ... 24
3.4 Collect more metadata ... 24
3.5 The comparison chart ... 25
3.5.1 The usefulness and completeness of the available metadata ... 26
3.5.2 Relation with other cities ... 27
Section 4: Results ... 28
4.1 Explanation for the grades ... 29
Section 5: Conclusion and Future work ... 30
Bibliography ... 32
Appendix A ... 38
Appendix B ... 40
Appendix C ... 42
Appendix D ... 46
Section-1 Introduction
1.1
Background
The ‘Internet of Things’ is the concept of basically connecting any device to the internet [67]. This includes cellphones, coffee makers, washing machines, refrigerators, wearable devices and almost anything else that we can think of. It is fast evolving today and is used across consumer (smart home, wearable technology), commercial (medical and health care, transportation), industrial (manufacturing, agriculture) and infrastructural spaces (energy management, environmental management, management of cities) [5]. Managing cities with the Internet of Things enables engineers to build smart cities with optimized city functions and economic growth, and the aim of quality of life of its citizens [6]. The Internet of Things also allows researchers to collect data from the connected devices, sensors, citizens and other assets which can be processed to analyze, monitor and further improve the transportation systems, power plants, water supply networks, waste management, crime detection, information systems, schools, libraries, hospitals and other community services [7].
automated to connect various devices and sensors enabling services like parking search, environmental monitoring, digital city agenda and more [5]. The Americas region as a whole is projected to reach 32% of the global smart cities information and communication technologies (ICT) spend by 2023, or $60.6 billion, according to the IDC [68]. In United States, New York, NY is leading smart city on several lists. New York has Automated Meter Reading (AMR) which provides city better data on water consumption, water leaks and water quality to efficiently manage water usage and quality [20]. Pittsburgh, PA implemented a network of smart traffic lights to reduce traffic congestion and better manage the traffic [68]. The European Union has devised strategy for achieving ‘smart’ urban growth for its metropolitan city regions [8] [9]. The EU has developed many programs under Europe’s Digital Agenda [10] and in 2010, the EU highlighted its focus on strengthening innovation and investment in Information and Communication Technology (ICT) services in order to improve public services and quality of life [9]. Arup estimates that the global market for smart urban services will exceed $400 billion per annum by 2020 [11]. Some more examples of cities where smart city technologies and programs have been implemented are Singapore [12], Dubai [13], Milton Keynes [14], Southampton [15], Amsterdam [16], Barcelona [17], Madrid [18] and Stockholm [19].
Qualitative analysis uses subjective judgement based on non-quantifiable information such as management expertise, industry cycles and labor relations [26]. It refers to the meanings, concepts, definitions, characteristics, symbols and description of things and not to their counts or measures [27]. Qualitative analysis allows subject materials to be evaluated in greater detail, the data may have predictive quality and it is based on human experiences and observations [28]. However, because it is very subjective, the data or the results may not be very accurate. It is also extremely difficult to determine the subjectivity or rigidity, or the perspectives involved in the data collected as well as the research results [28]. They also lack statistical representation. Therefore, qualitative methods may provide valuable findings, but it is very difficult to present and prove them [28].
1.2
Objectives
1.3
Research Questions
RQ1: To find out similarities or dissimilarities, the data should be comparable at the least. Therefore, one of the main research questions is to find out if we really have the data to compare the cities. If we do, then the subsequent step will be to calculate the similarities and dissimilarities.
RQ2: Are there enough data similarities among various cities that can enable the comparison of cities against known smartness indices?
Section 2- Literature Review
To understand the literature on smart cities, we performed analysis with findings from various sources like International Standards Organizations for smart city documents; Google Scholar and SCOPUS, with the combination of terms like “smart city”, “model” and “assessment”. We searched for articles (appearance of smart city concepts in literature) within the period of 1997 to early 2019. From more than 200 articles, we screened the articles by leaving out irrelevant publications (like “urban growth assessment”).
2.1 What is a smart city?
The term smart city is appearing in the literature since 1998 [27] [28] from the urban simulations and knowledge bases and it is still evolving to eco-cities [29]. Since 1998, smart cities’ definition has ranged from mesh metropolitan information and communication technology (ICT) environments [28]; to various ICT attributes in a city [32] [31]; to urban living labs [30]; or to the “smartness footprint” of a city, which is measured with indexes such as, the education level of its inhabitants, the innovative spirit of its enterprises, etc. [33]. All these different definitions indicate different interpretations, perspectives, school of thoughts, approaches and open-endedness of this term with respect to the researchers. Therefore, the term, “smart city” can be considered as confusing with regard to its meaning and context [28].
A city well performing in a forward-looking way in economy, people, governance, mobility, environment,
and living, built on the smart combination of endowments and activities of self-decisive, independent and
aware citizens. [33]
A city that monitors and integrates conditions of all of its critical infrastructures, including roads, bridges,
tunnels, rails, subways, airports, seaports, communications, water, power, even major buildings, can
better optimize its resources, plan its preventive maintenance activities, and monitor security aspects while
maximizing services to its citizens. [34]
A city “connecting the physical infrastructure, the IT infrastructure, the social infrastructure, and the
business infrastructure to leverage the collective intelligence of the city” [35]
A city striving to make itself “smarter” (more efficient, sustainable, equitable, and livable) [36]
A city “combining ICT and Web 2.0 technology with other organizational, design and planning efforts to
dematerialize and speed up bureaucratic processes and help to identify new, innovative solutions to city
management complexity, in order to improve sustainability and livability.” [37]
“The use of Smart Computing technologies to make the critical infrastructure components and services of
a city––which include city administration, education, healthcare, public safety, real estate, transportation,
and utilities––more intelligent, interconnected, and efficient” [38]
Table 2.1 Smart city definitions
2.2 Domains of Smart City
on the other hand conceptualized smart cities on the basis of the three dimensions: Technology, people and institutions.
With the above analysis, there are seven domains for smart city on a high level: Transportation, Urban Infrastructure, Living, Government, Economy and Coherence [39]. From these domains we have applied our methodology on the transportation domain to compare the similarities and dissimilarities between the smart cities. Our methodology is domain independent and therefore, can be applied on any other, in future.
2.3 Which smart cities?
There are a lot of cities pursuing the smart city strategy. The Intelligent community forum (ICF) conducts research, creates conference content, publishes information, recognizes smart communities and presents annual awards to a) explain the emergence, b) share the best practices of communities to help other communities speed their own development and c) and to celebrate the achievements of communities that have overcome the challenges [47]. ICF determines 21 communities every year based on the Intelligent Community Index questionnaire submitted by large and small communities around the world [47]. Table 2.2 presents 21 communities selected by ICF for last five years:
2019 2018 2017 2016 2015
1 Abbotsford,
Canada
Adelaide,
Australia
Astana,
Kazakhstan
Armidale, New
South Wales
Arlington
2 Adelaide, South
Australia,
Australia
Chiayi City,
Taiwan
Ottawa,
Ontario,
Canada
Mülheim an der
Ruhr, Germany
Prospect and the
Eastern Region
Alliance,
Australia
3 Binh Duong
Smart City,
Vietnam
Espoo, Finland Chiayi City,
Taiwan
Brabantse Kempen
Region, The
Netherlands
Astana,
Kazakhstan
4 Chiayi City,
Taiwan
Hamilton,
Canada
Pickering,
Canada
New Taipei City,
Taiwan
Rio de Janeiro,
Brazil
5 Chicago, USA Hudson, USA Edmonton,
Canada
Hamilton, Canada Aurora, Illinois,
USA
6 Curitiba,
Paraná, Brazil
Ipswich,
Australia
Prospect,
Australia
Oshawa, Canada Sherbrooke,
Canada
7 Greater
Victoria,
Canada
Issy-les-Moulineaux,
France
Grey County,
Canada
Hsinchu County,
Taiwan
Changhua
County, Taiwan
8 Hudson, Ohio,
USA
Kelowna,
Canada
Rochester,
USA
Ottawa, Canada Shiojiri City,
Japan
9
Issy-les-Moulineaux,
France
Kinmen County,
Taiwan
Ipswich,
Australia
Ipswich, Australia Columbus, Ohio,
USA
10 Keelung City,
Taiwan
Niagara Falls,
Canada
Sarnia-Lambton,
Canada
San Diego,
California, USA
Sunshine Coast,
Australia
11 Moscow,
Russia
Olds, Alberta,
Canada
Keelung City,
Taiwan
12 Nairobi County, Kenya Parkland County, Canada Sunshine Coast, Australia
Surrey, Canada Surrey, Canada
13 Prospect,
Australia
Pickering,
Canada
Knowle West,
United
Kingdom
Kaohsiung, Taiwan Edmonton,
Canada
14 Rochester, New
York, USA
Sarnia-Lambton
County, Canada
Tainan City,
Taiwan
Taitung County,
Taiwan
Taitung County,
Taiwan
15 Sarnia-Lambton
County, Canada
St. Albert,
Canada
Melbourne,
Australia
Lambton County,
Canada
Ipswich,
Australia
16 Sunshine Coast,
Australia
Sunshine Coast,
Australia
Taoyuan,
Taiwan
Taoyuan, Taiwan Taoyuan County,
Taiwan
17 Surat, India Tainan City,
Taiwan
Moscow,
Russia
Lethbridge, Canada Mitchell, USA
18 Tainan City,
Taiwan
Taoyuan,
Taiwan
Whanganui,
New Zealand
Whanganui, New
Zealand
Whanganui, New
Zealand
19 Taoyuan,
Taiwan
Western Valley,
Canada
Nelson,
Canada
Marlborough, USA Nairobi County,
Kenya
20 Westerville,
USA
Winnipeg,
Canada
Yilan County,
Taiwan
Winnipeg, Canada Whittlesea,
Australia
21 Winnipeg,
Canada
York (Regional
Municipality of),
Canada
New
Westminster,
Canada
Montreal, Canada New Taipei City,
Taiwan
Table 2.2 21 smart communities selected by ICF for last five years
independent, but also independent of the cities. It can be applied on any other city in future. The main aim in this research is to determine if the quantitative analysis we perform provides data to compare the smart cities.
2.4 Methods to rank cities on smartness
Giffinger et al. introduced a ‘Smart City ranking’ approach which helps to judge cities’ strengths and weaknesses and to define their goals and strategies for future development and better positioning [48]. Here, first they identify the characteristics of city rankings. Then, a selected number of city rankings are analyzed in order to identify different types of such rankings. Then they describe the methods of sequencing systematically in order to identify potential benefits and limits of rankings. In the next step they provide their own ranking approach for European medium-sized cities. The four objectives used for this approach are (1) transparent ranking of a selected group of cities (2) elaboration and illustration of specific characteristics and profiles of every city (3) the encouraging of benchmarking between selected cities (4) identification of strengths and weaknesses for strategic discussion and policy advice. This ranking approach was also used in 2007 by Giffinger, et al. for European medium-sized cities [49].
derived 74 indicators from public and freely available data, which jointly describe the factors of a smart city. They ranked the cities by comparing them on the basis of these indicators. They, however, did not describe how exactly they chose 74 indicators and on what basis they determined that those indicators jointly described factors of a smart city. With that respect, it is difficult to validate their findings. [49]
Garau et al. did a quantitative analysis to provide an objective assessment of smart mobility. This paper highlights the efficiency and effectiveness for the actions taken in the field of smart mobility. They chose 17 Italian cities to carry out this experiment. They constructed two types of indicators, Measurable and on/off indicators which can quantitative analyze the mobility on six variables of mobility. They adopted aggregation methodology to present these indicators after standardizing the indicators. Following the results of aggregation, they ranked the Italian cities based on their smartness. Also, these results can provide indication on improving urban mobility [50]. Like Giffinger et al. [49], this study also did not describe how they selected 2 indicators and 6 variables to analyze smartness. They consider certain factors that affect mobility, but they do not check how each element contributes to the smartness of the analyzed cities.
Profile, Economic Profile, Infrastructure Profile, E-Governance & computerization, Finance, Environmental, Progress Track, Security, and 80 indicators. Then, Distance-Based Algorithm was used to give positioning status. Their proposed model for the Indian smart city gives measurement and markers to the rank Indian urban city. [51]
2.4.1 Different modelling approaches for comparison
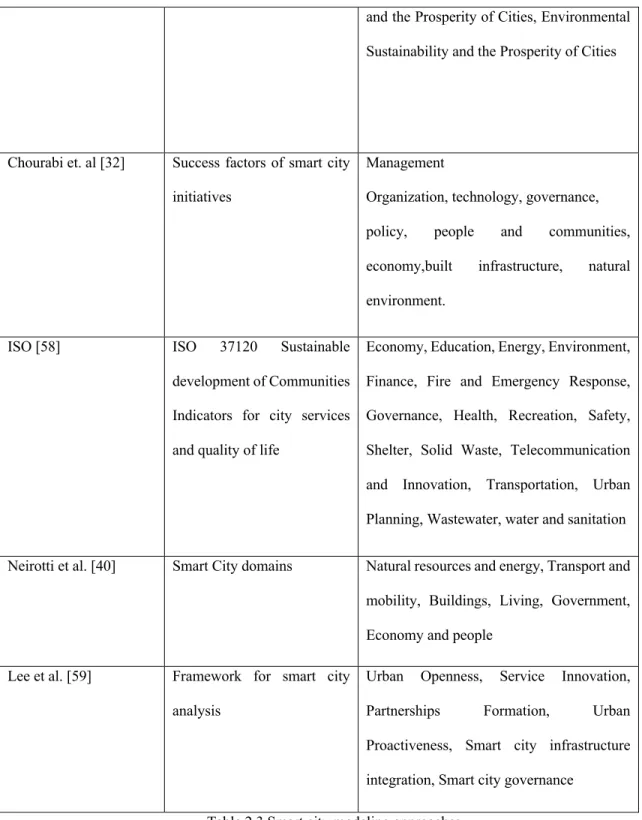
Anthopoulos et. al analyze the existing smart cities models and benchmarking methods. They analyze that most of the models are heterogeneous with some overlapping factor. [54] While the common factor between these models are six dimensions [45], for comparing smart cities various organizations and scholars have used different modelling approaches as shown in Table 2.3.
Model Dimensions
IBM [55] Nine Pillar Models Smarter
City Equation
Planning and Management Services
Infrastructure Services Human Services
Instrumentation (the transformation of
urban phenomena into data) +
Interconnection (of data) + Intelligence
(brought by software)
ITU [56] Smart Sustainable City Key
Performance Indicators
Environmental Sustainability, Productivity,
Quality of Life, Equity and Social Inclusion,
Infrastructure development
UN Habitat [57] Dimensions of City
Prosperity
Productivity and the Prosperity of Cities,
Urban Infrastructure: Bedrock of Prosperity,
and the Prosperity of Cities, Environmental
Sustainability and the Prosperity of Cities
Chourabi et. al [32] Success factors of smart city
initiatives
Management
Organization, technology, governance,
policy, people and communities,
economy,built infrastructure, natural
environment.
ISO [58] ISO 37120 Sustainable
development of Communities
Indicators for city services
and quality of life
Economy, Education, Energy, Environment,
Finance, Fire and Emergency Response,
Governance, Health, Recreation, Safety,
Shelter, Solid Waste, Telecommunication
and Innovation, Transportation, Urban
Planning, Wastewater, water and sanitation
Neirotti et al. [40] Smart City domains Natural resources and energy, Transport and
mobility, Buildings, Living, Government,
Economy and people
Lee et al. [59] Framework for smart city
analysis
Urban Openness, Service Innovation,
Partnerships Formation, Urban
Proactiveness, Smart city infrastructure
integration, Smart city governance
Table 2.3 Smart city modeling approaches
explain the relationships and influences between these factors. This framework is also useful to know about the influential factor in different times and in different context. The factors in their proposed framework are represented in two different levels of influence to show different level of impact. Outer factors (governance, people and communities, natural environment, infrastructure, and economy) are in some way filtered or influenced more than influential inner factors (technology, management, and policy) before affecting the success of smart city initiatives. This framework suggests directions and agendas for smart city research. Likewise, Neirotti et. al explain the classification of smart city by six domains and its sub-domain [40]. Lee et. al [59] develop a conceptual framework to better understand smart city practices and more effectively to identify and assess gaps where adaptation and improvement may be needed. They analyzed two leading cases from the U.S. and Asia through the lens of this new framework to identify heterogeneous characteristics in the process of planning and developing a smart city. Their research consists of 6 key conceptual dimensions and 17 sub-dimensions of smart city.
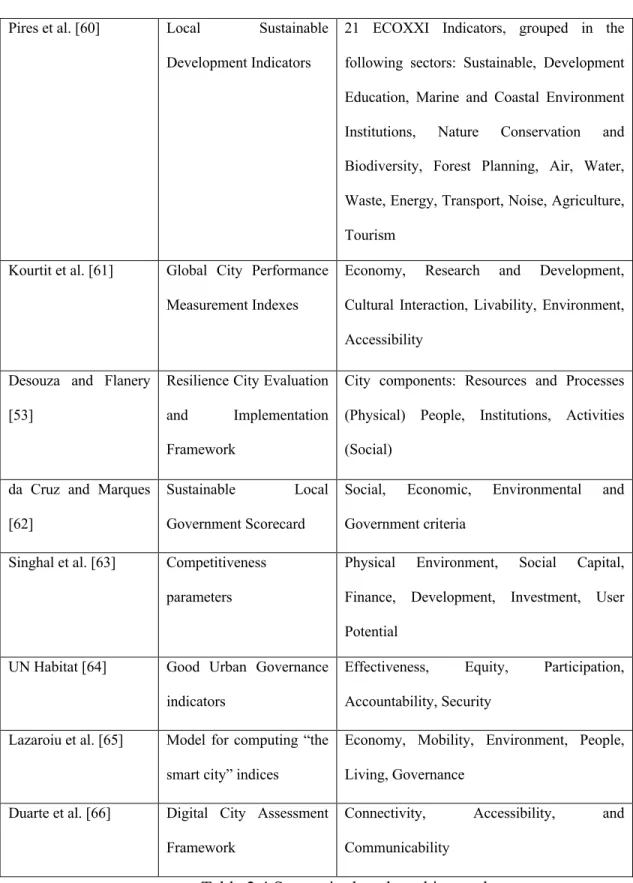
2.4.2 Benchmarking methods
Benchmarking methods are used to compare smart cities with each other based on various factors. Table 3 provides an overview of benchmarking methods aimed at measuring smart cities from different perspectives, such as sustainability [60]; global city performance [61]; resilience [53]; local government effectiveness [62]; urban competitiveness [63]; and good urban governance [64]. With regards to the 6 dimensions of smart city, only [66] defined a model with corresponding indices in an attempt to assess urban intelligence.
Pires et al. [60] Local Sustainable
Development Indicators
21 ECOXXI Indicators, grouped in the
following sectors: Sustainable, Development
Education, Marine and Coastal Environment
Institutions, Nature Conservation and
Biodiversity, Forest Planning, Air, Water,
Waste, Energy, Transport, Noise, Agriculture,
Tourism
Kourtit et al. [61] Global City Performance
Measurement Indexes
Economy, Research and Development,
Cultural Interaction, Livability, Environment,
Accessibility
Desouza and Flanery
[53]
Resilience City Evaluation
and Implementation
Framework
City components: Resources and Processes
(Physical) People, Institutions, Activities
(Social)
da Cruz and Marques
[62]
Sustainable Local
Government Scorecard
Social, Economic, Environmental and
Government criteria
Singhal et al. [63] Competitiveness
parameters
Physical Environment, Social Capital,
Finance, Development, Investment, User
Potential
UN Habitat [64] Good Urban Governance
indicators
Effectiveness, Equity, Participation,
Accountability, Security
Lazaroiu et al. [65] Model for computing “the
smart city” indices
Economy, Mobility, Environment, People,
Living, Governance
Duarte et al. [66] Digital City Assessment
Framework
Connectivity, Accessibility, and
Communicability
2.4.3 Quantitative approaches
Debnath et. al develop a methodological framework which allows comparative analysis among smart cities. The framework involves three key steps: 1) formulating a proper concept of smartness in the context of urban transport system, by specifying some basic and advanced smartness capabilities. 2) generating a generic matrix of indicators of smartness and 3) measuring smartness indices from scores of the indicators. The smart capabilities are used to identify the indicators of smartness. Under every smart capability, each sub-system could have multiple items, each of which is presented in a single cell. Each cell of the matrix consists of two components: (1) a description of smart capability that a technology should possess and (2) the Extent to which a smart technology is available. The primary reason for developing a smartness indicators matrix is to relatively identify smartness of the sub-systems across categories of the smart capabilities. To benchmark smart transport cities, a composite scoring system is developed to measure the smartness index (SI) of a city’s transportation system. However, this framework does not list the generic indicators which can match the dynamically changing society [52].
Section 3 - Methodology
Our first step in this research was to perform literature review and understand how smart cities are compared and ranked currently. That research originated the idea of performing quantitative analysis to compare the smart cities. To collect the data, we first looked at the open data of many smart cities like New York, Boston, Chicago, Zurich etc. Our next step was to decide the cities we will use in our project for quantitative analysis. We randomly chose four smart cities – Boston, Chicago, Barcelona and Singapore. Following are the reasons for randomly selecting the four cities:
i) We did not want to select the cities based on any bias, preference or order. ii) The primary thing in this project is the methodology followed rather than the
cities selected. The methodology can be applied to any number of cities to perform this analysis.
With the above reasons, we do not know if we will find comparable data between these cities to find out their similarities and dissimilarities. One of the main aims of this project is to figure out whether we find comparable data between the smart cities.
3.1 Prepare initial Metadata
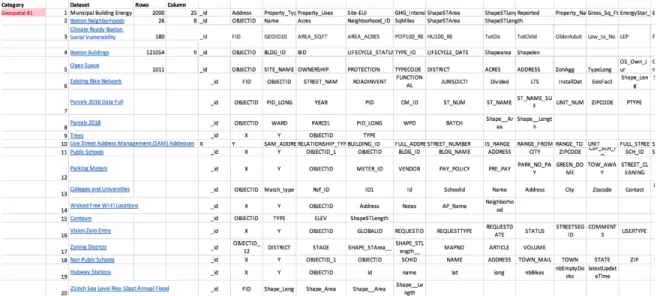
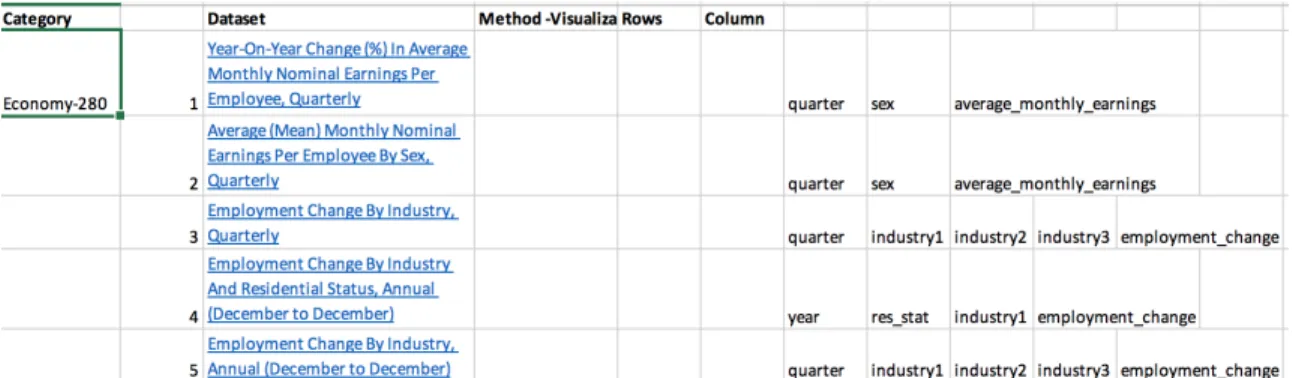
Post selecting the cities, we collected open data for all of them. Open data for cities has various categories like Geospatial, City Services, Education, Financial, Environment, Public Health, Transportation, Facilities, economy etc. We prepared metadata based on all the categories that were available in the metadata. Following diagram shows the metadata of one category for all the four cities.
Fig. 3.2 Boston Metadata for Geospatial Category
Fig. 3.4 Singapore Metadata for Economy Category
Fig. 3.5 Barcelona Metadata for Transportation Category
3.2 Select one category
The metadata collected for all the cities was a lot of data. It would not have been feasible to analyze data for all the categories at once. Therefore, it was important to select one category and focus on refining its metadata so that we can use that metadata to compare the four cities with respect to the selected category.
the cities. Moreover, the methodology which we will follow can be applied on other categories also.
3.3 Compare the metadata for the ‘transportation’ category
With the metadata prepared in the first step, we tried to determine the similarities and dissimilarities between the cities. However, we hardly found any comparable data between these cities. [We realized that we will have to refine the metadata further so as to accurately determine whether the cities have any comparable data between them.] We therefore decided to dig in a little deeper and collect more metadata with an aim to see if we can find useful and comparable data.
3.4 Collect more metadata
During our first phase of collecting metadata as explained in section 3.1, we collected the metadata from open data available online. In our next phase, we did not want to follow the same approach. We decided to collect answers of the following three questions for every dataset:
i) Who are the top three users?
ii) What are the top three reasons for why this data is collected?
iii) What they are using it for?
Fig. 3.6 below shows sample report for Singapore’s traffic related data with answers to all the three questions. Likewise, we collected this information for all the datasets.
Fig. 3.6 Sample Analysis report
3.5 The comparison chart
Our final step then was to use the metadata collected in section 3.1 and 3.4 and find similar datasets across the four cities and determine the following:
ii) Relation with other cities
Using the above properties, we created an excel chart which gave a clear picture of the relations between the cities as well as whether the dataset has enough information to be used in any quantitative analysis.
3.5.1 The usefulness and completeness of the available metadata
We decided the usefulness and completeness of the metadata based on the following five factors. We graded every dataset based on these factors. Every factor has a weightage of 1 and therefore the maximum grade a dataset would get is a grade of 5 indicating satisfactory information available for all the five factors.
i) Number of records in the metadata collected in section 3.1
The total number of records for a dataset is an important factor as that information would typically help to further analyze the data. If this information is not adequate, then it would be difficult to further analyze and find relations with other cities.
ii) Number of columns in the meta collected in section 3.1
Like number of rows, number of columns is also a very important factor. There were some datasets which very few columns providing very little information like the id and the page views. That much information will not be sufficient for further analysis and find relations with other cities.
iii) Uses and users of the dataset
These correspond to the questions 1 and 3 covered in the section 3.4. Collecting this information is also important as it helps to know the users as well as the use of the dataset.
This corresponds to the question 2 covered in the section 3.4 is again important as it helps to figure out why the data for the dataset is collected at first place.
v) When dataset was last updated
It is also important to work with the latest and the updated data rather than old data. We therefore collected this information and gave point 1 if the last updated date was at least in 2017. If the date was older than 2017, we assigned a grade lower than 1.
3.5.2 Relation with other cities
Section 4: Results
For the comparison chart, we used datasets related to some of the common transportation segments like road traffic, bicycles, car parking, streetlights and bus routes. We graded such datasets as explained in section 3.5.1 and also showed if they are related to other cities. Figure 4.1 shows the results.
Fig. 4.1. The comparison chart
4.1 Explanation for the grades
For Barcelona’s dataset Traffic state information by sections of the city of Barcelona, the value is 3[] which indicates that the grade is 3 and the dataset is not related with other cities’ datasets. The grade 3 is because the dataset has only tram related data and there is no information about why the data is being collected. Also, there is limited information about the users and uses of the dataset. Therefore, the dataset gets the grade of 1, 0.5, 0.5, 0, 1 which makes a total of 3. Similarly, Singapore’s dataset Road Traffic Conditions during Peak Hours gets a grade of 3.5 because the dataset has two tables – one updated in 2014 and other one updated in 2017 and the table updated in 2014 has a smaller number of rows and columns. Therefore, partial credit was provided for number of rows, number of columns and last updated date which makes the grades as 0.5, 0.5, 1, 1, 0.5. Therefore, the total grade became 3.5. However, this dataset is related to the datasets of Chicago and Boston. Figure 4.2 provides the reason for every grade shown in the figure 4.1.
Section 5: Conclusion and Future work
Our comparison chart consists of a limited number of datasets out of so many datasets we had for all the four cities. While typically, it would be ideal to prepare the comparison chart for all the datasets of the four cities, our main aim here was to figure out if we have the data which can further be used for quantitative analysis. We did not need all the datasets in the comparison chart, instead, we only needed as many datasets which would help us figure out whether the data is useful enough or not. We therefore tried to use datasets belonging to some of the most common areas of the transportation
Another major finding of the comparison chart is that there is quantifiable information for all the datasets, indicating that we have the data which can be further used for
quantitative analysis. This answers our first research question which was about whether we have the data to help compare the cities. While we do know that we have the data for quantitative analysis, performing the quantitative analysis is out of scope for this research work. We consider that as part of our future work.
Bibliography
[1] Luciano, M., & Luciano, M. (2017). Top 10 Smartest Cities In The World. Retrieved from https://www.ecnmag.com/blog/2017/11/top-10-smartest-cities-world.
[2] Laura Mullan. (2019). Top 10 smart cities in the world. Retrieved from
https://www.gigabitmagazine.com/big-data/top-10-smart-cities-world.
[3] Qualitative research. (2019). Retrieved from
https://en.wikipedia.org/wiki/Qualitative_research.
[4] Chief, E. in. (n.d.). 23 Advantages and Disadvantages of Qualitative Research. Retrieved from https://vittana.org/23-advantages-and-disadvantages-of-qualitative-research.
[5] Internet of things. (2019). Retrieved from
https://en.wikipedia.org/wiki/Internet_of_things.
[6] Rouse, M., Shea, S., Burns, E., Rouse, M., & Rouse, M. (n.d.). What is a Smart City?
Definition from WhatIs.com. Retrieved from
https://internetofthingsagenda.techtarget.com/definition/smart-city.
[7] Smart city. (2019). Retrieved from https://en.wikipedia.org/wiki/Smart_city.
[8] Komninos, Nicos. (2009). Intelligent cities: Towards interactive and global innovation environments. International Journal of Innovation and Regional Development - Int J Innovat Reg Dev. 1. 10.1504/IJIRD.2009.022726.
[9] Paskaleva, K (2009). "Enabling the smart city:The progress of e-city governance in Europe". International Journal of Innovation and Regional Development. 1 (4): 405– 422(18). doi:10.1504/ijird.2009.022730.
[10] Olsen, Jonathan & McCormick, John. (2018). The European Commission. 10.4324/9780429494512-8.
[12] Singapore best performing 'smart city' globally: Study. (2018). Retrieved from https://www.channelnewsasia.com/news/singapore/singapore-best-performing-smart-city-globally-study-10038722.
[13] Smart Dubai. Retrieved from https://www.smartdubai.ae/.
[14] The MK:Smart Project. (2015). Retrieved from http://www.mksmart.org.
[15] SmartCities Card. (2015). Retrieved from https://www.southampton.gov.uk/roads-parking/travel/smartcities-card/.
[16] Amsterdam Smart City ~ Projects. (2015). Retrieved from
https://amsterdamsmartcity.com/projects.
[17] Barcelona Smart City. (2015). Retrieved from
https://ajuntament.barcelona.cat/bombers/en/noticia/barcelona-a-world-leader-in-developing-smart-cities_154146
[18] Buenas Practicas de la Ciudad de Madrid.(2016). Retrieved from
https://www.madrid.es/UnidadWeb/Contenidos/Publicaciones/RelacionesInternacionales/ CatalogoBuenasPracticas/MedioAmbiente/RegeneracionUrbanaySocialdeColoniasMunic ipales.pdf
[19]The Smart City. Stockholms stad. (2015). Retrieved from
https://international.stockholm.se/governance/smart-and-connected-city/
[20] CityBridge – LinkNYC. Retrieved from http://www.isralink.org.il/en/citybridge-linknyc/ [21] School, I. E. S. E. B. (2019). These Are The Smartest Cities In The World For 2019. Retrieved from https://www.forbes.com/sites/iese/2019/05/21/these-are-the-smartest-cities-in-the-world-for-2019/#544bae5b1429.
[22] Citi. (2019). The Top 50 Smart Cities In The World 2019. Retrieved from
https://citi.io/2019/06/27/the-top-50-smart-cities-in-the-world-2019/.
[23] -, S., By, -, & Smartcity. (2019). The Annual IESE Cities in Motion Index 2019 - Top 10 Smart Cities. Retrieved from https://www.smartcity.press/top-10-smart-cities-of-2019/. [24] The Top 50 Smart Cities In The World 2019. (2019). Retrieved from
https://sensative.com/buzz/the-top-50-smart-cities-in-the-world-2019-citi-io/.
[25] IESE Cities in Motion Index. (2019) IESE Buisness School University of Navarra. Retrieved from: https://media.iese.edu/research/pdfs/ST-0509-E.pdf
[27] Van Bastelaer, B. (1998). Digital cities and transferability of results. In the Proceedings of the 4th EDC Conference on Digital Cities.
[28] Mahizhnan, A. (1999). Smart cities: The singapore case. Cities, 16(1), 13–18.
[29] Anthopoulos, L., & Fitsilis P. (2013). Using classification and roadmapping techniques for smart city viability’s realization. Electronic Journal of e-Government, 11(1), 326–336, ISSN1479- 439X
[30] Komninos, N. (2002). Intelligent cities: Innovation, knowledge systems and digital spaces (1st ed.). London: Routledge.
[31] Allwinkle, S., & Cruickshank, P. (2011). Creating smarter cities: An overview.
Journal of Urban Technology, 18(2), 1–16.
[32] Chourabi, H., Nam, T., Walker, S., Gil-Garcia, J. R., Mellouli, S., Nahon, K., Pardo, T. A., & Scholl, H. J. (2012). Understanding smart cities: An integrative framework. In Proceedings of the 45th Hawaii International Conference on System Sciences.
[33] Giffinger, R., C., Fertner, H., Kramar Meijers, E., & Pichler-Milanovic, N. (2007). Smart cities: Ranking of European medium-sized cities. http://www.smart-cities.eu/download/smart_cities_final_report.pdf. Accessed Dec 2013
[34] Hall, R. E. (2000). The vision of a smart city. In Proceedings of the 2nd International Life Extension Technology Workshop, Paris, France, September 28, Available from http://www.osti.gov/bridge/servlets/purl/773961- oyxp82/webviewable/773961.pdf. [35] Harrison, C., Eckman, B., Hamilton, R., Hartswick, P., Kalagnanam, J., Paraszczak, J., & Williams, P. (2010). Foundations for Smarter Cities. IBM Journal of Research and Development, 54(4).
[36] Natural Resources Defense Council. What are smarter cities? Available from http://smartercities.nrdc.org/about.
[37] Toppeta, D. (2010). The Smart City Vision: How Innovation and ICT Can Build Smart, “Livable”, Sustainable Cities. The Innovation Knowledge Foundation. Available from http://www.thinkinnovation.org/file/research/23/en/Top peta_Report_005_2010.pdf. [38] Washburn, D., Sindhu, U., Balaouras, S., Dines, R. A., Hayes, N. M., & Nelson, L. E. (2010). Helping CIOs Understand "Smart City" Initiatives: Defining the Smart City, Its Drivers, and the Role of the CIO. Cambridge, MA: Forrester Research, Inc. Available from http://public.dhe.ibm.com/partnerworld/pub/smb/smarterplanet/forr_help_cios_und_smar t_city_initiatives.pdf.
Successful Smart Cities. Public Administration and Information Technology, vol 8. Springer, Cham
[40] Neirotti, P., De Marco, A., Cagliano, A. C., & Mangano, G. (2014). Current trends in smart city initiatives: Some stylised facts. Cities, 38, 25–36.
[41] Yigitcanlar, T., & Lee, S. H. (2014). Korean ubiquitous-eco-city: A smart-sustainable urban form or a branding hoax? Technological Forecasting & Social Change, 89, 100– 114.
[42] Piro, G., Cianci, I., Grieco, L.A., Boggia, G., & Camarda, P. (2014). Information centric services in smart cities. The Journal of Systems and Software, 88, 169–188.
[43] Desouza, K. C., & Flanery, T. H. (2013). Designing, planning, and managing resilient cities: Aconceptual framework. Cities, 35, 88–89.
[44] Wey, W-M., & Hsu, J. (2014). New urbanism and smart growth: Toward achieving a smart National Taipei University District. Habitat International, 42, 164–174.
[45] Madakam, Somayya. (2014). Smart Cities - Six Dimensions (A Scholarstical Articles Review). International Journal Of Advances In Computer Science And Its Applications. 4. 20-23. 10.3850/978-981-07-8859-9_09.
[46] Taewoo Nam and Theresa A. Pardo. (2011) Conceptualizing smart city with dimensions of technology, people, and institutions. In Proceedings of the 12th Annual International Digital Government Research Conference: Digital Government Innovation in Challenging Times (dg.o ’11). ACM, New York, NY, USA, 282-291. DOI=http://dx.doi.org/10.1145/2037556.2037602
[47] Intelligent Community Forum. (2019). The Smart21 Communities of the Year. [online] Available at: https://www.intelligentcommunity.org/smart21 [Accessed 9 Nov. 2019]. [48] Giffinger, Rudolf & Gudrun, Haindlmaier & Gudrun, & Haindlmaier, Gudrun. (2010). Smart cities ranking: An effective instrument for the positioning of the cities. ACE: Architecture, City and Environment.
[49] Giffinger, R., Fertner, C., Kramar, H., Kalasek, R., Pichler-Milanović, N., Meijers, E. (2007): Smart Cities: Ranking of European Medium-Sized Cities. Vienna University of Technology,Vienna
[50] Garau, C., Masala, F., & Pinna, F. (2015). Benchmarking smart urban mobility: A study on italian cities doi:10.1007/978-3-319-21407-8_43 Retrieved fromwww.scopus.com
[51] Sharma, K., & Tayal, S. (2019). Indian smart city ranking model. International Journal
of Recent Technology and Engineering, 8(2), 4820-4832.
[52] Debnath, A. K., Chin, H. C., Haque, M. M., & Yuen, B. (2014). A methodological framework for benchmarking smart transport cities. Cities, 37, 47-56. doi: 10.1016/j.cities.2013.11.004
[53] K.C. Desouza, and T.H. Flanery, (2014) “Designing, planning, and managing resilient cities: A conceptual framework,” Cities, 35, pp. 88-89.
[54] Anthopoulos, Leonidas & Janssen, Marijn & Weerakkody, Vishanth. (2015). Comparing Smart Cities with different modeling approaches. 525-528. 10.1145/2740908.2743920.
[55] Ola Söderström, Till Paasche & Francisco Klauser (2014) Smart cities as corporate storytelling, City: analysis of urban trends, culture, theory, policy, action, 18:3, 307-320, DOI: 10.1080/13604813.2014.906716
[56] International Telecommunications Union (ITU), (2014) “Overview of key performance indicators in smart sustainable cities,” [Online]. Available: http://www.itu.int/en/ITUT/focusgroups/ssc/Pages/default.aspx
[57] United Nations (UN), (2014) “State of the World’s Cities 2012/2013,” [Online]. Available:
http://mirror.unhabitat.org/pmss/listItemDetails.aspx?publicationID=3387
[58] International Standards Organization (ISO), (2014) “ISO 37120:2014 - Sustainable development of communities --Indicators for city services and quality of life,”.
[59] J.H. Lee, M.G. Hancock, and M-C Hu, (2013) “Towards an effective framework for building smart cities: Lessons from Seoul and San Francisco,” Technological Forecasting & Social Change, http://dx.doi.org/10.1016/j.techfore.2013.08.033
[60] M. Pires, T. Fidelis, and T.B. Ramos, (2014) “Measuring and comparing local sustainable development through common indicators: Constraints and achievements in practice,” Cities, 39, pp. 1-9.
[61] K. Kourtit, C. Macharis, and P. Nijkamp, (2014) “A multi-actor multi-criteria analysis of the performance of global cities,” Applied Geography, 49, pp. 24-36.
[62] N.F. da Cruz, and R.C. Marques, (2014) “Scorecards for sustainable local governments,” Cities, 39, pp. 165-170.
[63] S. Singhal, S. McGreal, and J. Berry, (2013) “Application of a hierarchical model for city competitiveness in cities of India,” Cities, 31, pp. 114-122.
[64] United Nations (UN) Habitat, (2014) “Urban Governance Index (UGI): A tool to measure progress in achieving good urban governance,” [Online]. Available:
[65] G.C. Lazaroiu, and M. Roscia, (2012) “Definition methodology for the smart cities model,” Energy, 47, pp. 326-332.
[66] F. Duarte, F. de Carvalho Figueiredo, L. Leite, and D.A. Rezende, (2014) “A Conceptual Framework for Assessing Digital Cities and the Brazilian Index of Digital Cities: Analysis of Curitiba, the First-Ranked City,” Journal of Urban Technology, 21:3, 37-48. DOI: 10.1080/10630732.2014.940709
[67] Morgan, J. (2017). A Simple Explanation Of 'The Internet Of Things'. Retrieved from
https://www.forbes.com/sites/jacobmorgan/2014/05/13/simple-explanation-internet-things-that-anyone-can-understand/#72bfc0c61d09.
[68] 4 Examples of Smart City Innovations in the U.S. and Canada. (n.d.). Retrieved from
https://blog.equinix.com/blog/2019/08/06/4-examples-of-smart-city-innovations-in-the-u-s-and-canada/.