https://openaccess.leidenuniv.nl
License: Article 25fa pilot End User Agreement
This publication is distributed under the terms of Article 25fa of the Dutch Copyright Act (Auteurswet) with explicit consent by the author. Dutch law entitles the maker of a short scientific work funded either wholly or partially by Dutch public funds to make that work publicly available for no consideration following a reasonable period of time after the work was first published, provided that clear reference is made to the source of the first publication of the work.
This publication is distributed under The Association of Universities in the Netherlands (VSNU) ‘Article 25fa implementation’ pilot project. In this pilot research outputs of researchers employed by Dutch Universities that comply with the legal requirements of Article 25fa of the Dutch Copyright Act are distributed online and free of cost or other barriers in institutional repositories. Research outputs are distributed six months after their first online publication in the original published version and with proper attribution to the source of the original publication.
You are permitted to download and use the publication for personal purposes. All rights remain with the author(s) and/or copyrights owner(s) of this work. Any use of the publication other than authorised under this licence or copyright law is prohibited.
If you believe that digital publication of certain material infringes any of your rights or (privacy) interests, please let the Library know, stating your reasons. In case of a legitimate complaint, the Library will make the material inaccessible and/or remove it from the website. Please contact the Library through email:
Article details
Brown J.I., Koopmans T., Strien J. van, Martin N.I. & Frankel A. (2018), Kinetic analysis of
PRMT1 reveals multifactorial processivity and a sequential ordered mechanism,
ChemBioChem 19(1): 85-99.
Very Important Paper
Kinetic Analysis of PRMT1 Reveals Multifactorial
Processivity and a Sequential Ordered Mechanism
Jennifer I. Brown,
[a]Timo Koopmans,
[b]Jolinde van Strien,
[c]Nathaniel I. Martin,*
[b]and
Adam Frankel*
[a]Introduction
Arginine-methylated proteins are involved in many important cellular functions, including RNA processing, epigenetic tran-scription regulation, signal transduction, and DNA repair.[1]
Considering that approximately 0.5% of arginine residues in the human proteome are methylated, this post-translational modification is thought to be a major regulatory element.[2,3]
Therefore, arginine methylation profiles of proteins need to be under strict control by maintenance enzymes to ensure proper cellular function. One method of regulating arginine methyla-tion is through demethylases. Jumonji domain-containing 6 (JMJD6) protein oxygenase was previously identified as an argi-nine demethylase in humans; however, its demethylation activ-ity has not been substantiated.[4,5] In contrast, the enzymes
responsible for arginine methylation have been well character-ized.
Protein arginine N-methyltransferase (PRMT) enzymes are responsible for post-translationally methylating the guanidine moiety of specific arginine residues in target protein substrates
while, in the process, converting the methyl donorS
-adenosyl-l-methionine (SAM) into S-adenosyl-l-homocysteine (SAH). Nine members of the human PRMT family are categorized based on the type of methylated product(s) each forms: type I enzymes (PRMT1–4, PRMT6, and PRMT8) catalyze the formation of Nh-monomethyl- and asymmetric Nh,Nh-dimethylarginine (MMA and aDMA, respectively); type II enzymes (PRMT5 and PRMT9) catalyze the formation of MMA and symmetric Nh1,Nh2-dimethylarginine (sDMA); and the type III enzyme PRMT7 is only able to form MMA (Scheme 1).[6–14]Many groups
have demonstrated that active site steric interactions surround-ing the substrate arginine residue contribute to enzyme prod-uct specificity. For example, changes to one or two residues within the PRMT1 active site have been shown to either alter the distribution of MMA and aDMA products or shift the enzy-matic regioselectivity from aDMA to sDMA.[15–17] This
regiose-lective shift from one or two amino acid changes was also ob-served in PRMT7 fromTrypanosoma brucei, in which an E181D variant expanded this enzyme’s product formation to include aDMA, and a E181D/ Q329A double variant formed sDMA.[18,19]
Two native glutamate residues in PRMT7 (E181 and E172) de-marcate an invariant “double E loop” that coordinates the posi-tive charge of arginine within the acposi-tive site. Glutamic acid to glutamine conversions within the double E loop have been shown to compromise enzyme activity in different PRMTs,[19–22]
underscoring the functional importance of this conserved se-quence motif.
Another conserved and notable sequence motif within the PRMT active site is referred to as the THW loop. Variations on this sequence motif specific for each PRMT product type were demonstrated in the mutagenesis study ofTbPRMT7, as well as identified in a recent structural study of PRMT6.[19,23]As
prod-Arginine methylation is a prevalent post-translational modifica-tion in eukaryotic cells. Two significant debates exist within the field: do these enzymes dimethylate their substrates in a proc-essive or distributive manner, and do these enzymes operate using a random or sequential method of bisubstrate binding? We revealed that human protein arginine N -methyltransfer-ase 1 (PRMT1) enzyme kinetics are dependent on substrate sequence. Further, peptides containing an Nh-hydroxyarginine generally demonstrated substrate inhibition and had improved KMvalues, which evoked a possible role in inhibitor design. We
also revealed that the perceived degree of enzyme processivity is a function of both cofactor and enzyme concentration, sug-gesting that previous conclusions about PRMT sequential methyl transfer mechanisms require reassessment. Finally, we demonstrated a sequential ordered Bi–Bi kinetic mechanism for PRMT1, based on steady-state kinetic analysis. Together, our data indicate a PRMT1 mechanism of action and processivity that might also extend to other functionally and structurally conserved PRMTs.
[a]J. I. Brown, Dr. A. Frankel
Faculty of Pharmaceutical Sciences, University of British Columbia 2405 Wesbrook Mall, Vancouver, BC V6T 1Z3 (Canada)
E-mail: [email protected] [b]Dr. T. Koopmans, Dr. N. I. Martin
Department of Chemical Biology and Drug Discovery
Utrecht Institute for Pharmaceutical Sciences, University of Utrecht 3584 CG Utrecht (The Netherlands)
E-mail: [email protected] [c] J. van Strien
Leiden Institute for Chemistry, Gorlaeus Laboratories Einsteinweg 55, 2333CC Leiden (The Netherlands)
uct specificities of PRMTs appear tunable through mutagenesis and diverge merely due to a small number of active site resi-due differences, it is likely that all PRMTs share a common cata-lytic mechanism, regardless of enzyme type.
The presence of conserved structural motifs in PRMTs pro-vides further evidence to support a common mechanism. PRMTs contain a seven-b-strand structural motif that is repre-sentative of the largest superfamily of SAM-dependent methyl-transferases.[24]This Rossmann-like structural core makes
sever-al conserved contacts with SAM and, in PRMTs, seversever-al pieces of structural evidence suggest that cofactor binding induces a conformational change within the enzyme, whereby an N-ter-minala-helix buries it within the interior of the protein and, as a consequence, completes the formation of the nearby pep-tide-binding groove.[23,25–29] Binding studies between PRMTs
and either peptides or small-molecule inhibitors (ligands that bind in the peptide-binding groove) using isothermal titration calorimetry (ITC) have demonstrated cofactor (SAM or SAH) de-pendence in order to elicit a binding isotherm, which supports a sequential order of substrate binding to enzyme.[27,30–34]
De-spite mechanistic implications surrounding these observations, enzyme kinetic studies of different PRMTs have generated con-flicting data as to whether SAM binding precedes peptide sub-strate binding (i.e., sequential ordered mechanism) or not (i.e., random mechanism). Interpretations of kinetic and molecular modeling data for PRMT1,[11,32, 35–37] CARM1,[27,38] PRMT5,[39, 40]
and PRMT6[23,31, 41,42] have varied between sequential and
random mechanisms. Therefore, further kinetic and structural research into these enzymes needs to be performed while con-sidering the extent of the published literature to help settle
this debate and establish consensus on a shared PRMT mecha-nism.
The dimerization arm that extends from the C-terminal b -barrel domain is another shared structural motif within the PRMT enzyme family whose function suggests a common mechanism. For most PRMTs, crystal structures show that the dimerization arm of one subunit makes reciprocal contacts with the other subunit to form an overall toroidal shape in which the two active sites face inward and across from one another.[20,25,26,28,31,40, 43–47]In the absence of a dimerization arm,
recombinantly expressed versions of mammalian PRMT1 and its yeast homologue Rmt1p/Hmt1p are monomeric, unable to bind to SAM, and inactive.[20,48] CARM1 phosphorylation at a
conserved serine residue near the dimer interface was shown to inhibit dimerization and prevent SAM binding, thereby reg-ulating enzyme function during cell cycle progression.[49] In
addition to dimerization being a requirement for SAM binding, our group found that SAM and SAH influenced the dissociation constants for PRMT1 and PRMT6 homodimers.[50]PRMT
dimeri-zation and its relationship with cofactor binding, therefore, are undoubtedly important aspects of enzyme activity.
One of the aspects of enzyme activity for which consensus has not been established in the literature is in the sequential transfer of methyl groups onto a single substrate arginine resi-due (i.e., dimethylation). A processive enzyme, in this instance, does not release the substrate prior to the second methylation in aDMA or sDMA formation, whereas a distributive enzyme re-leases substrate after the first methylation to give MMA as the predominant product. Several studies offer compelling data and rationales in support of processive or distributive mecha-nisms for PRMT1,[11,32,36,37,41,51–54]PRMT2,[11]PRMT3,[54]CARM1,[38]
PRMT5,[39,55–57]PRMT6,[6,41, 42]PRMT7,[44]and PRMT9.[19]
The purpose of the current research was to use steady-state enzyme kinetics to further explore PRMT1’s methylation activi-ty, in terms of catalytic mechanism and degree of processiviactivi-ty, with several biologically relevant peptide substrates. Our lab previously studied the effect of univalent isosteric replacement of the methyl group in MMA with a hydroxy substituent, which lowered the pKa of the arginine guanidino group from
12.5 to 8.7, and found that it was amenable to methylation.[58]
Here, we demonstrate that hydroxy-substituted substrates behave similarly to monomethylated substrates and, in the context of the H4 peptide, result in the strongest substrate in-hibition. We also demonstrate, in congruence with previous findings, that the degree of enzyme processivity is substrate dependent. Additionally, we show, for the first time, that the degree of processivity was dependent on cofactor and enzyme concentrations. Finally, we demonstrate that PRMT1 acts in a sequential ordered Bi–Bi mechanism, which differs from recent-ly reported findings.[36,38] These results are significant in that
they provide for a better understanding of how PRMT1 catalyz-es sequential methylation reactions. Thcatalyz-ese insights likely extend to other PRMT family members.
Results and Discussion
PRMT1 kinetics are dependent on substrate sequence We first sought to investigate single and double methyl trans-fers by PRMT1 on well-characterized peptide substrates due to a lack of consensus regarding the enzyme kinetic mechanism of PRMT1. Unmethylated, monomethylated, and hydroxylated versions of peptides representing the following PRMT1 sub-strates were studied: histone H4 (H4), eukaryotic initiation factor (eIF4A1), and two fibrillarin-based peptides (KRK and RKK).[59–63] An acetylated version of the fibrillarin-based (R1)
peptide from our previous study on arginine isosteres[58] was
used as a reference substrate for comparison with other pep-tide sequences (Table 1). The hydroxylated peppep-tides were used to investigate the differences in PRMT1 kinetics between mon-omethylated and hydroxylated isosteric substrates.
The rate of methyl transfer was assessed by quantifying the incorporation of radiolabeled methyl groups into peptides in a p81 filter binding assay, except in the case of the R1 peptide, where we measured radioactivity in gel slices. In all cases, 200 nm of purified PRMT1 (Figure S1 in the Supporting Infor-mation) and 50mmSAM were used, which is a saturating con-dition (the KMvalue for SAM is 1.0mm).[11]Reactions were
per-formed for one hour, within the linear range of the enzyme (Figure S2 in the Supporting Information). The rate values were fitted to Michaelis–Menten Equation (1) or (2), from which the apparent Vmax (pmol min@1, normalized to nmol enzyme), KM,
andkcatvalues were estimated. We found that for almost all of
the peptide substrates, PRMT1 displays the highest activity towards the unmodified peptides. Specifically, unmodified eIF4A1, KRK, and RKK peptides exhibit the highestVmaxvalues,
whereas the monomethylated and hydroxylated isosteres reveal comparably lowerVmaxvalues (Figure 1 and Figure S3 in
the Supporting Information).
These observations were expected, because monomethylat-ed and hydroxylatmonomethylat-ed substrates are sterically similar and allow
for only one methyl transfer at the methylation site. However, unmodified and monomethylated H4 peptides exhibited simi-larly high apparent Vmax values, whereas the value for the
hydroxylated peptide was unexpectedly and appreciably lower. This result indicates that PRMT1 had similar catalytic activity towards unmodified and modified H4 substrates alike, which is revealed by their comparableKMandkcatvalues (Table 2).
Fur-thermore, although PRMT1 appears to display approximately twofold higher catalytic efficiency (kcat/KM) towards
hydroxylat-ed H4 and eIF4A1 peptide substrates comparhydroxylat-ed to their mono-methylated counterparts, PRMT1 catalysis is less efficient for the hydroxylated KRK and RKK substrates (Table 2). A consis-tently observed trend, however, is that PRMT1 requires less hydroxylated substrate to achieve half-maximal velocity com-pared to its unmodified and monomethylated counterparts, as observed by the lower apparentKMvalues for each
hydroxylat-ed peptide. The failure to observe a prhydroxylat-edicthydroxylat-ed increase in turn-over number for all hydroxylated peptides suggested that the presence of theNh-hydroxyarginine had differential effects on PRMT1 catalysis, based on peptide sequence context, under-scoring substrate-dependent effects on PRMT1 enzyme kinetics seen previously with unmodified and monomethylated forms of these peptides.[53]
It was further observed that some datasets fit better to a modified Michaelis–Menten inhibition model [Eq. (2)]. As seen in Figure 1 and Table 2, H4-OH, eIF4A1-OH, KRK, KRK-CH3,
KRK-OH, RKK-CH3, and RKK-OH display an inhibitory effect on
PRMT1 catalysis at higher substrate concentrations. The hy-droxylated KRK and eIF4A1 peptides exhibit some substrate inhibition, but did not adequately fit to the inhibition model from whichKivalues were derived. Generally,Kivalues for
pep-tides are high, but variable depending on the peptide se-quence. It is unclear why some peptides lead to an inhibitory effect, but we have previously observed that the substrate inhibition effect can be mitigated by increasing enzyme con-centration.[64]Therefore, we performed steady state kinetics
ex-periments on the H4-OH peptide at different PRMT1 concen-trations and found that doubling or quadrupling the enzyme concentration to 400 or 800 nm eradicates substrate inhibition (Figure S4). Additionally, different PRMT1 concentrations dis-play different kinetic parameters (Table S2) similar to what has been shown for methylation activity towards unmodified his-tone H4 and Tat peptides.[35, 64]
PRMT1 kinetic data with the unsubstituted H4 peptide pre-sented here are consistent with data prepre-sented by Dillon et al., with all calculated apparent enzyme kinetic values falling within the same order of magnitude.[65]This previous
publica-tion used a radioactive gel-based assay, comparable to what we used to calculate apparent kinetic data for the R1 peptide. The apparent KM, kcat, and kcat/KM values for unmodified and
monomethylated eIF4A1, KRK, and RKK peptides differed com-pared to what has been reported by Hevel and co-workers by an order of magnitude.[53] Whereas Gui et al. reported an
apparent higher catalytic efficiency for each monomethylated peptide compared to its unmethylated counterpart,[53]we only
observed a higher catalytic efficiency for the monomethylated RKK peptide. Many experimental design variations could
con-Table 1.Peptide substrates synthesized to contain either an unmodified arginine residue or anNh-hydroxyl-,Nh-monomethyl-, orNh,Nh -dimethyl-substituted arginine residue (shown in bold).
Peptide Sequence
H4 Ac-SGRGKGGKGLGKGGAKR
H4-CH3 Ac-SGRMeGKGGKGLGKGGAKR
H4-OH Ac-SGROHGKGGKGLGKGGAKR
eIF4A1 Ac-YIHRIGRGGR
eIF4A1-CH3 Ac-YIHRIGRMeGGR
eIF4A1-OH Ac-YIHRIGROHGGR
KRK Ac-KGGFGGRGGFGGKW
KRK-CH3 Ac-KGGFGGRMeGGFGGKW
KRK-OH Ac-KGGFGGROHGGFGGKW
RKK Ac-GGRGGFGGKGGFGGKW
RKK-CH3 Ac-GGRMeGGFGGKGGFGGKW
RKK-OH Ac-GGROHGGFGGKGGFGGKW
RKK-(CH3)2 Ac-GGRMe2aGGFGGKGGFGGKW
tribute to these differences. Our methodology included a radi-oactive assay approach, compared to a continuous spectro-photometric assay. In our assay, all background automethyla-tion of the enzyme was subtracted based on an enzyme-only reaction, whereas the continuous spectrophotometric assay ac-counted for both substrate methylation and enzyme autome-thylation. The limit of detection of our radiometric assay was approximately 0.1 pmol of methyl groups transferred, com-pared to a 10 pmol limit of detection (10mmin a 1.0 cm cuv-ette) reported for the continuous spectrophotometric assay.[53]
The lower limit of detection for our assay allowed us to collect data over a broad range of substrate concentrations, leading to a comprehensive curve when fit to the Michaelis–Menten equation. Furthermore, the enzyme concentrations used (200 nm in this study versus 4.0mm) might also contribute to these differences. Finally, Gui et al. used SAH nucleosidase and adenine deaminase to decompose SAH and prevent its feed-back inhibition of PRMT1 in their assay, which might have also contributed to differences between our apparent kinetic pa-rameters.
Our substrate inhibition data support, in part, an inhibition theory proposed by Zheng and co-workers, who suggested
that substrate inhibition could be due to the accumulation of a binary or ternary complex with the enzyme that has not un-dergone a conformational change and is, therefore, catalytical-ly inactive.[32]Their analysis did not take into account that
sub-strate inhibition was observed at low enzyme concentrations. We have previously argued that PRMT1 in solution contains concentration-dependent enzyme populations in various oligo-meric states whose kinetic behaviors differ.[64] At a lower
enzyme concentration, PRMT1 was susceptible to substrate inhibition, whereas at a high concentration—well above theKD
value of dimerization (110 nm)[50]—a kinetically distinct PRMT1
population was no longer susceptible to substrate inhibition. As the inhibition effect on H4-OH peptide is alleviated at higher enzyme concentrations, our results further support our prevailing theory.
In summary, PRMT1 displays the highest catalytic activity to-wards unmodified peptide substrates, whereas it methylates hydroxy-substituted peptides comparably to their monometh-ylated isosteres (with the exception of the H4 peptide). For some peptide substrates, including some hydroxylated pep-tides, PRMT1 kinetics modelled to substrate inhibition. Taken together, these data suggest that the enzyme kinetics of
PRMT1 vary and are affected by substrate sequence, which complements what was seen by Hevel and co-workers,[53]and
arginine modification. The finding that arginine hydroxylation generally led to an inhibitory effect, as well as to a largely im-provedKMvalue compared to unmodified counterparts, could
suggest a benefit to using hydroxy groups in potential PRMT1 active site inhibitor design.
PRMT1 degree of processivity increases with both cofactor and enzyme concentration
Our observation that PRMT1 displays differential apparent kinetic parameters based on substrate identity led us to specu-late that peptide substrates might also affect the level of methylated product. Therefore, we aimed to discern relative amounts of MMA and aDMA produced on each unmodified substrate under various experimental conditions. We first investigated the ratio of MMA and aDMA produced on saturat-ing concentrations of unmodified peptide substrates under conditions used for steady-state kinetics experiments described above (methylation reactions for 1 h with 200 nm PRMT1, 50mm SAM, 100mm peptide). We expected to see different aDMA/MMA ratios if PRMT1 activity was dependent on sub-strate sequence, which has previously been shown for these peptides.[53] We found that for eIF4A1, KRK, and RKK peptide
substrates, approximately 1.4-fold more MMA was produced than aDMA after 1 h, whereas 4.4-fold more MMA was pro-duced than aDMA on the H4 peptide substrate (data not shown). These different observed ratios brought into question the effect of substrate sequence on enzyme processivity. Given the experimental conditions and reaction time within the linear range, a processive PRMT1 would predominantly pro-duce dimethylarginine, whereas a distributive PRMT1 would mostly produce monomethylarginine, with the dimethylargi-nine species accumulating only after the concentration of monomethylated substrate rose to the level of the unmodified
substrate concentration. An enzyme that produces an appreci-able amount of both the monomethylated and dimethylated species might be described as acting semi-processively.[36]
Using these definitions, we find PRMT1 acting distributively towards the H4 peptide and semi-processively towards the eIF4A1, KRK, and RKK peptides under the described experimen-tal conditions.
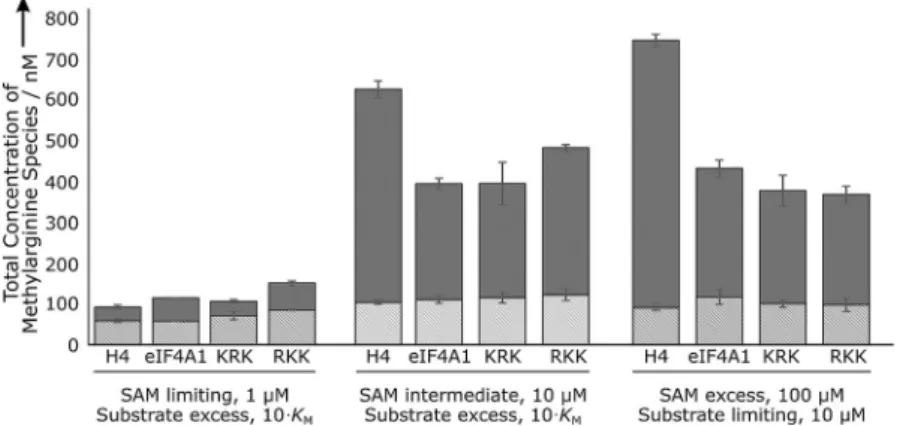
We designed additional experiments to measure the amount of enzyme processivity under limiting or excess concentrations of SAM and unmodified peptides. Methylation reactions were performed in which SAM was limiting (1.0mm) and peptides were in excess (10KM), SAM was twofold (10mm) in excess of
enzyme concentration and peptides were in excess (10KM), and
finally, SAM was in excess (100mm) and peptides were limiting (10mm). The degree of processivity was assessed by measuring aDMA/MMA ratios. Enzyme was removed from each methyla-tion reacmethyla-tion and the remaining methylated targets were acid hydrolyzed to individual amino acid components. Ratios were quantified by using ultra-high-performance liquid chromatog-raphy tandem mass spectrometry (UHPLC-MS/MS). The limit of detection for aDMA and MMA from the 60mL reaction volume with this method is 1.2 pmol and 0.6 pmol, respectively. In order to ensure that we observed enough product to accurate-ly quantify, we used 5.0mmPRMT1 in these reactions.
For each peptide, MMA and aDMA were produced with vari-ous aDMA/MMA ratios by PRMT1 under different conditions tested (Figure 2 and Table 3). The H4 peptide yielded aDMA/ MMA ratios of 5.0:1 and 7.2:1 for intermediate and SAM-excess conditions, respectively, which is an appreciably higher ratio than what we see for the other three substrates. These conditions suggest that PRMT1 acts more processively towards the H4 substrate peptide than it does towards other tested substrates. Under SAM-limiting conditions, the level of PRMT1 processivity was strikingly different from SAM-intermediate and SAM-excess conditions. In this case, both the H4 and KRK peptide substrates yielded approximately twofold more mono-methylated than dimono-methylated product, whereas eIF4A1 and RKK peptide substrates bear approximately equal levels of both methylarginine species. PRMT1 appears to behave less processively towards H4 and KRK under SAM limiting condi-tions. Together, these results demonstrate that relative SAM concentration directly affects PRMT1 processivity, whereas the peptide concentration does not.
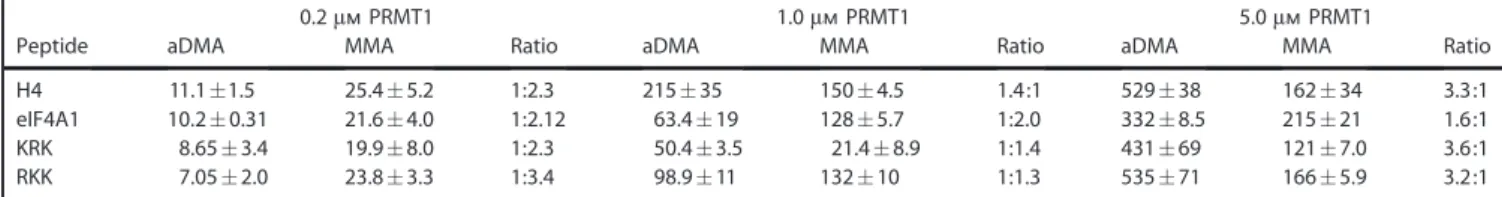
We turned our attention to the effect of enzyme concentra-tion on processivity by testing different PRMT1 concentraconcentra-tions with constant saturating levels of SAM and peptide. Our results show that the aDMA/MMA ratio increases for each peptide with a concomitant increase in PRMT1 concentration (Figure 3 and Table 4), demonstrating that PRMT1 processivity is directly linked to enzyme concentration. Additionally, these results show that the increase in aDMA disproportionally contributes to the overall increase in methylated product as compared to MMA at the highest enzyme concentration tested. This result supports the notion that PRMT1 processivity is a function of enzyme concentration.
Our observations that both cofactor and enzyme concentra-tion affect PRMT1 processivity led us to quesconcentra-tion what
influen-Table 2.Apparent enzyme kinetic parameters of PRMT1 with unmethylat-ed, monomethylatunmethylat-ed, and hydroxylated H4, eIF4A, KRK, and RKK peptides, as well as unmodified R1 peptide.
Peptide KM kcat(V10@4) kcat/KM(V10@2) Ki
[mm] [s@1] [m@1s@1] [mm]
H4 2.30:0.36 7.60:0.27 330:53 – H4-CH3 3.94:0.58 7.92:0.28 202:30 –
H4-OH 2.03:0.49 7.20:0.73 355:93 47.6:12 eIF4A1 25.9:2.6 3.30:1.3 12.7:5.3 – eIF4A1-CH3 22.0:3.9 1.53:0.10 6.97:1.3 –
eIF4A1-OH 6.17:1.1 0.92:0.05 14.9:2.8 [a] KRK 2.64:0.40 3.80:0.23 144:67 250:120 KRK-CH3 4.48:1.8 1.75:0.33 39:17 72.5:34
KRK-OH 3.35:1.1 0.97:0.08 28.8:10 [a] RKK 11.3:1.3 4.63:1.5 41.0:14 – RKK-CH3 2.70:1.1 2.67:0.48 98.8:43 56.5:25
ces the degree to which PRMT1 acts processively. From a mechanistic point of view, we know that higher concentrations of PRMT1 revealed a correspondingly increased level of dimeri-zation and higher order oligomers.[35,50]Therefore, we
hypothe-sized that factors that enhance enzyme dimerization might in turn increase processivity. We previously showed through FRET measurements that the addition of excess SAM lowered the KD value of dimerization between mCer-PRMT1 and
mCit-PRMT1.[50] Here, we used this FRET pair to determine how
di-merization was affected by different concentrations of cofactor
and peptide alone or in combination in an effort to better un-derstand PRMT1 behavior and establish a model for its activity (Figure 4). To our surprise, we found that PRMT1 dimerization increased in response to increased concentrations of SAM, SAH, or KRK peptide. At the highest concentrations, KRK ap-peared to cause the greatest increase in FRET signal as com-pared to SAM or SAH cofactor. Interestingly, the addition of both KRK peptide and SAM reveal an additive effect on FRET signal, thus suggesting that the PRMT1:SAM:peptide complex best promotes an equilibrium shift in favor of PRMT1
dimeriza-Figure 2.PRMT1 degree of processivity for substrate peptides. Reactions containing 5.0mmPRMT1 and the indicated concentrations of SAM and unsubstitut-ed peptides were incubatunsubstitut-ed at 378C for 1 h. PRMT1 was removed from the sample to eliminate automethylation, and remaining methylated targets were acid hydrolyzed. Concentrations of aDMA (dark gray) and MMA (light gray) were determined by UHPLC-MS/MS. Error bars represent standard deviation (n=3).
Table 3.PRMT1 degree of processivity for substrate peptides.
Limiting SAM, excess peptide Intermediate SAM, excess peptide Excess SAM, limiting peptide
Peptide aDMA MMA Ratio aDMA MMA Ratio aDMA MMA Ratio
H4 33.6:5.5 58.8:3.7 1:1.8 543:22 108:5.5 5.0:1 657:15 91.0:7.0 7.2:1
eIF4A1 57.3 57.8 1:1.0 294:15 115:9.6 2.6:1 316:21 118:19 2.7:1
KRK 35.5:4.5 71.1:9.4 1:2.0 290:54 120:14 2.4:1 277:38 101:9.5 2.7:1 RKK 66.5:5.2 85.2:1.3 1:1.3 374:7.6 127:15 2.9:1 271:21 98.1:16 2.8:1 aDMA/MMA ratios were determined for reactions as described in Figure 2. Values are listed as nmconcentrations (:standard deviation of three replicates), and ratios are listed as aDMA/MMA.
Figure 3.PRMT1 degree of processivity, varying enzyme concentration. Reactions containing 0.2, 1.0, or 5.0mmPRMT1, 100mmSAM, and peptide substrate (at least tenfold higher concentration than theKMvalue: 25mmfor H4, 300mmfor eIF4A1, 35mmfor KRK, and 130mmfor RKK) were incubated for 1 h at
tion, which might represent a mechanism by which PRMT1 processivity proceeds.
Although we were the first group to identify that SAM con-centration affects the level of PRMT processivity, this study is not the first published example. Other studies of PRMT1 and PRMT5 have shown that higher SAM concentrations can lead to more aDMA and sDMA, respectively, even though SAM was not implicated as a possible cause.[53,55]Similarly, although we
were the first to explicitly show that enzyme concentration af-fects processivity, our conclusion is actually well represented in published studies that have classified different PRMT enzymes as acting processively or distributively.[6,11,19,32, 36–39,42,51–55] Not
only does the lack of consensus in the literature suggest that PRMT kinetics could be dependent on substrate identity, but our current findings also demonstrate that inherent differences in experimental design, such as enzyme and cofactor concen-tration, contribute to observed differences regarding distribu-tive or processive mechanisms. For example, our group, as well as Wahle and co-workers, have concluded that PRMT1 acts dis-tributively when tested at low nanomolar concentrations.[11, 54]
Other groups found PRMT1 to act semi-processively at higher nanomolar and micromolar concentrations.[51,53] Therefore,
conclusions drawn about PRMT processivity in the literature are largely consistent and predictable, based on cofactor and enzyme concentrations used in the assay.
Based on our product formation and FRET results, we theor-ized that PRMT1 dimerization might explain how the enzyme is capable of performing processively. Most processive en-zymes are toroidal in shape and bear a central cavity contain-ing one or more active sites.[66] PRMT dimers share this
struc-tural feature[20, 48,67] and are capable of processive arginine
di-methylation under certain assay conditions, as discussed above. It is, however, uncertain exactly how PRMT dimers behave processively. With two active sites per PRMT dimer, it is tempting to speculate that each site contributes to arginine di-methylation. This notion is supported by the fact that the stoi-chiometry of ligand binding to PRMT6 was shown by native mass spectrometry to be 2:2:1 for the PRMT6:SAH:peptide ter-nary complex.[28] However, we previously showed that mixed
dimers of 25 nm active PRMT1 and 750 nm inactive (E153Q) PRMT1 formed approximately twofold more aDMA than MMA on full-length histone H4 after a 1 h reaction, providing some evidence that processive dimethylation can occur at one active site.[21] More recently, different amino acid residue changes
within the one viable active site of PRMT7 converted it from a type III enzyme to a type I or type II enzyme,[18,19]thus
provid-ing additional evidence that dimethylation can occur at one active site. What remains unclear is how the target arginine can remain in one active site for two rounds of methylation, which might not necessarily be a prerequisite for processivity. PRMT1 has been shown to contain, in addition to the peptide binding groove adjacent to the active site, two additional exo-site binding grooves that interact with substrate polypep-tides.[20] It is plausible that these exosites could prevent
sub-strates from completely dissociating from the enzyme after the first methylation event. This rationale is supported by the ob-servation that histone H4 peptide length and distal elements were shown to strongly influence the catalytic efficiency of PRMT1,[51] indicating that binding interactions outside the
active site are important for methylation.
Overall, the results from this set of experiments shine a new light on our understanding of PRMT1 processivity. We con-clude that PRMT1 processivity is a multifactorial effect. Al-though the degree of PRMT1 processivity can depend on pep-tide substrate sequence identity,[53] we found that it is not
af-fected by peptide concentration. Instead, we determined that enzyme and cofactor concentrations are the primary variables affecting apparent enzyme processivity. Although we only report this effect for PRMT1, it is logical to extend these con-siderations in determining processivity of other type I and type II arginine methyltransferases.
Table 4.PRMT1 degree of processivity with various enzyme concentrations.
0.2mmPRMT1 1.0mmPRMT1 5.0mmPRMT1
Peptide aDMA MMA Ratio aDMA MMA Ratio aDMA MMA Ratio
H4 11.1:1.5 25.4:5.2 1:2.3 215:35 150:4.5 1.4:1 529:38 162:34 3.3:1 eIF4A1 10.2:0.31 21.6:4.0 1:2.12 63.4:19 128:5.7 1:2.0 332:8.5 215:21 1.6:1 KRK 8.65:3.4 19.9:8.0 1:2.3 50.4:3.5 21.4:8.9 1:1.4 431:69 121:7.0 3.6:1 RKK 7.05:2.0 23.8:3.3 1:3.4 98.9:11 132:10 1:1.3 535:71 166:5.9 3.2:1 aDMA/MMA ratios were determined for reactions described in Figure 3. Values are listed as nanomolar concentrations (:standard deviation of three repli-cates), and ratios are listed as aDMA/MMA.
Figure 4.Cofactor and peptide contribution to PRMT1 dimerization. The FRET signal for PRMT1 dimerization, as measured by using both mCer- and mCit-PRMT1 (100 nmeach), increases in the presence of KRK (^), SAM (&), or
PRMT1 uses a sequential ordered Bi–Bi mechanism of action
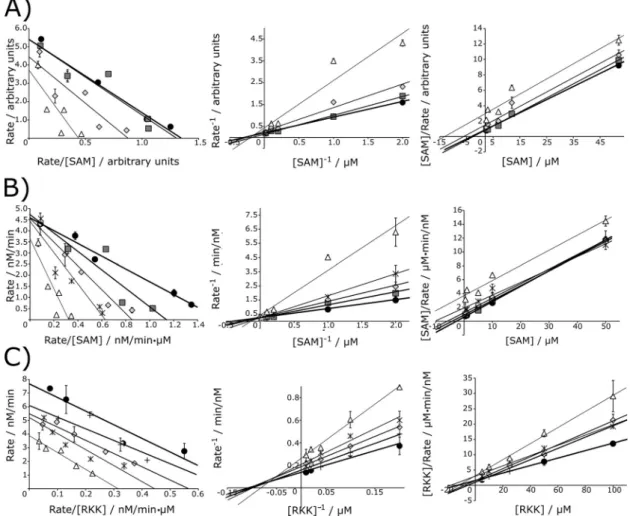
A series of product inhibition experiments were designed to observe the effect of SAH and RKK-aDMA inhibitors on PRMT1 activity in the presence of varying SAM or RKK substrates by using the radiometric p81 filter binding assay. Transferred methyl groups were used to calculate the enzyme rate of reac-tion. Each dataset was fit to nonlinear models for competitive [Eq. (3)], uncompetitive [Eq. (4)], noncompetitive [Eq. (5)], and mixed [Eq. (6)] inhibition. Data sets were assessed as best fit-ting to models based on the best coefficient of determination and the lowest error. Data were also qualitatively presented in Eadie–Hofstee plots (rate versus rate/substrate), double-recip-rocal Lineweaver–Burk plots (recipdouble-recip-rocal rate versus recipdouble-recip-rocal substrate), and Hanes–Woolf plots (substrate/rate versus sub-strate) for each product inhibitor concentration. These plots aided in determining which model best fit the data in some in-stances in which nonlinear regression analyses provided similar accuracy of fit and errors for multiple inhibition equations. The combination of these three plots gave a clear indication of the observed trend, rather than relying solely on the commonly used Lineweaver–Burk plot, which overemphasizes the data values collected at various low substrate concentrations, there-by heavily weighting regression of the line and enlarging the error.[68] Two leading kinetic mechanisms—rapid equilibrium
random mechanism with dead-end EAP/EBQ complexes (terna-ry complexes comprising enzyme bound to one substrate and one product) and sequential ordered mechanism—were con-sidered (Table 5). These kinetic mechanisms both have well-es-tablished and characteristic product inhibition patterns.[69] Our
product inhibition data were analyzed to determine which mechanism was best supported by our results.
First, with increasing concentrations of SAH and varying SAM concentrations at 25 and 130mm concentrations of RKK peptide, data sets best fit to a competitive model, suggesting that SAH displays competitive inhibition towards PRMT1 under these conditions (Table S3). Consistent with this analysis, all three linear plots also reveal a competitive inhibition pattern (Figure 5A and B), in which apparent Vmax does not change,
but apparentKMincreases with increasing inhibitor
concentra-tion. As SAM and SAH bind to the same binding site on PRMT1, product inhibition with SAH is expected to demon-strate classic competitive inhibition when varying SAM. Second, with increasing concentrations of SAH and varying RKK peptide concentrations at 50mm SAM, the data sets fit equally well to noncompetitive and mixed models (Table S3), which is also seen on each linear plot (Figure 5C). In this case, the apparentVmaxdecreases and apparentKMremains constant
with increasing inhibitor concentration. An inhibition experi-ment with a high SAM concentration and varying RKK peptide was not conducted because it would not help distinguish between sequential ordered and random mechanisms. Overall, the results from SAH product inhibitor data sets were consis-tent with both a sequential ordered Bi–Bi mechanism and a rapid equilibrium random Bi–Bi mechanism with dead-end EAP/EBQ complexes. Further experiments with the RKK-aDMA
product inhibitor were pursued to distinguish between these two mechanisms.
Data sets corresponding to increasing RKK-aDMA inhibitor with varying SAM concentrations and 25mm RKK peptide fit equally well to uncompetitive, noncompetitive, and mixed inhibition models (Table S3). As a consequence of assaying PRMT1 at this peptide concentration close to itsKMvalue, the
resulting low activity of the enzyme contributed to error in these measurements. To aid in analysis, we looked to the linear plots, which demonstrate a noncompetitive/mixed inhibition pattern (Figure 6A), consistent with both the random and se-quential mechanisms. Together, these results best support that RKK-aDMA acts as a noncompetitive/mixed inhibitor towards PRMT1 under these conditions.
Next, with increasing concentrations of RKK-aDMA and vary-ing SAM concentrations at 130mm RKK peptide substrate
(&10KM), the data sets fit best to the noncompetitive and
mixed inhibition models. However, the data sets also fit appre-ciably well, with relatively low error, to the uncompetitive model (Table S3). Each plot is also consistent with this result in that it is difficult to confidently discern between a noncompe-titive, mixed, or uncompetitive inhibition pattern when both apparentVmaxandKMvalues decreased with increasing
inhibi-tor concentration (Figure 6B). Taken together, this evidence best suggests that RKK-aDMA displays mixed/noncompetitive/ uncompetitive inhibition under these conditions. Although it is difficult to assign a single inhibition model, it is important to remark that, under a sequential ordered mechanism, we would expect to see uncompetitive inhibition under these conditions, but under a rapid equilibrium random mechanism with dead-end EAP/EBQ complexes, we would expect to see no inhibi-tion.[69]
Finally, with increasing concentrations of RKK-aDMA and var-ious RKK concentrations at both 5.0 and 50mmconcentrations of SAM, these data sets reveal similarly low errors and coeffi-cients of determination for noncompetitive and mixed inhibi-tion models (Table S3), which is also consistently seen on the linear plots (Figure 6C and D). These results, therefore, suggest that RKK-aDMA displayed mixed/noncompetitive inhibition
Table 5.Inhibition patterns for rapid equilibrium random mechanism with dead-end EAP/EBQ complexes and sequential ordered Bi–Bi mecha-nism under various SAM, peptide, SAH, and dimethylated peptide prod-uct concentrations.
Varied SAM Varied peptide Product inhibitor Low
peptide High peptide Low SAM High SAM
Rapid equilibrium random mechanism (with dead-end EAP/EBQ)
peptide product mixed no inhibition competitive competitive SAH competitive competitive mixed no
inhibition
Sequential ordered mechanism
peptide product mixed uncompetitive mixed mixed SAH competitive competitive mixed no
under these conditions. It is important to also discern that under a sequential ordered mechanism, we would expect to see mixed inhibition under these conditions, but under a rapid equilibrium random mechanism with dead-end EAP/EBQ com-plexes, we would expect to see competitive inhibition.[69]
These data sets have much lower coefficients of determination when fit to the competitive model, accompanied by apprecia-bly higher estimates of error. We also observed high Ki
values in the range of 400 to 1000mmfor the RKK-aDMA inhib-itor (Table S3), which suggests that RKK-aDMA is a weak PRMT1 inhibitor. Accordingly, large inhibitor concentrations were used.
The key difference between a rapid equilibrium random Bi– Bi mechanism with dead-end EAP/EBQ complexes and a se-quential ordered Bi–Bi mechanism is whether or not substrate binding and product release occur in a random or ordered fashion. The latter mechanism has been assigned to PRMT2[11]
and PRMT6,[42] whereas the former mechanism has been
as-signed to PRMT1,[36] CARM1,[38] PRMT5,[39] and PRMT6.[41] Our
current nonlinear regression analyses and graphical representa-tions provide the strongest evidence that PRMT1 operates by using a sequential ordered Bi–Bi mechanism instead of a rapid equilibrium random Bi–Bi mechanism with dead-end EAP/EBQ complexes. Specifically, if PRMT1 operated by using a rapid equilibrium random mechanism, we would have expected to see no inhibition when using the RKK-aDMA inhibitor with varied SAM concentration and a high RKK peptide concentra-tion, but these conditions unquestionably showed inhibition. Furthermore, we would have expected to see competitive inhibition by RKK-aDMA when varying RKK peptide concentra-tion, but both nonlinear and linear regression analyses re-vealed mixed/noncompetitive inhibition under these condi-tions. Therefore, results from our steady-state kinetic product inhibition experiments imply that it is more probable that PRMT1 uses a sequential ordered Bi–Bi mechanism rather than a random mechanism.
Our product inhibition results contrast with findings from other studies.[36,38,39,41]The source of this discrepancy resides in
the interpretation of product inhibition or dead-end inhibition curves involving peptide inhibitors (for example, RKK-aDMA). One issue that groups have encountered is highKi values for
inhibitor peptides, which require high enough concentrations to elicit inhibitory effects that can be accurately measured and properly interpreted. Another issue is reliance on Lineweaver–
Burk double reciprocal plots, which tend to yield unequal weighting of data points over a range of substrate concentra-tions. Eadie–Hofstee and Hanes–Woolf plots, on the other hand, more evenly distribute data points so that patterns can be more readily discernible by visual inspection. We found in our own data that, in some instances, single plots were not able to clearly elucidate an inhibition pattern. For example, when using the RKK-aDMA inhibitor and various RKK
trations at a low SAM concentration (Figure 6C), the Linewea-ver–Burk plot appears unclear and could suggest an uncompe-titive pattern. However, in this instance, both the Eadie–Hof-stee and Hanes–Woolf plots strongly suggest a mixed inhibi-tion pattern. This example demonstrates how the double re-ciprocal plot can be subject to user interpretation and further emphasizes the importance of assessing all plots as a comple-ment to nonlinear regression and as an interpretive tool. Final-ly, the transformation of nonlinear kinetic models [Eqs. (3)–(6)] to a linear plot like the double reciprocal plot allows for visual inspection of the model rather than the acquired product in-hibition data. In this instance, line patterns are not reflective of data points and are forced through a single x- ory-intercept, as seen in some PRMT studies.[39,41]Furthermore, it is surprising
that regression metrics are not regularly reported in literature. This information would not only provide more robust support for authors’ claims, but would also invite transparency and allow readers to draw their own conclusions from the presented data. The evaluation of product and dead-end inhibition studies does bear some pitfalls for misinterpretation of kinetic data, but they can be overcome when considering these issues.
Zheng and co-workers used transient kinetic measurements to establish a PRMT1 kinetic mechanism in which both SAM and histone H4 peptide were capable of independently bind-ing to the enzyme, but the catalytically active ternary complex (PRMT1:SAM:H4) required that SAM bound first to PRMT1 before the peptide bound.[32] We were also able to conclude
that cofactor and peptide could independently bind to PRMT1 when measuring dimerization by FRET (Figure 4). As we ob-served that some substrates led to enzyme inhibition at high concentrations (Figure 1), we questioned if this was due to the formation of dead-end EBQ, BEB, or BE complexes. The EBQ dead-end complex would be formed when the peptide sub-strate bound to the catalytically inactive PRMT1:SAH complex. The latter complexes would be theoretically formed when one or two peptide substrates bound to PRMT1 (BE and BEB, respectively) and prevented cofactor binding. To distinguish between these dead-end complexes, we conducted a series of experiments with various concentrations of H4-OH peptide (2, 5, 10, 25, 50, and 100mm) and various concentrations of SAM (1, 2, 5, 10, and 50mm). A double reciprocal plot of reciprocal rate versus reciprocal SAM concentration was used to reveal which dead-end complexes were formed.[70] We observe that,
at low H4-OH concentrations (1–25mm), the data sets intersect on the x-axis and share the same apparent KM value, but at
high H4-OH peptide concentrations (50–100mm), the data sets intersect along the y-axis and share the same apparent Vmax
value (Figure 7A and Table S4). This pattern is characteristic of the formation of dead-end BE and BEB complexes. If we were observing inhibition by the formation of EBQ complexes, we would expect to see a decrease in KM/Vmax to a minimum as
substrate concentrations increase. After this point, data sets at higher substrate concentrations would maintain the minimum KM/Vmax, but would show an increasing reciprocal rate.[70]
There-fore, our evidence does not support the formation of an EBQ complex as an underlying mechanism for observed substrate inhibition.
In considering other mechanisms for substrate inhibition, it is important to note that the two substrate binding sites in PRMT1 are not mutually exclusive, as a dead-end BEB complex would suggest. For a BEB complex to form, A (SAM) and B (peptide) must be structurally similar in order for B to indis-criminately bind the enzyme at A and B binding sites. This mode of substrate inhibition seems unlikely, as no additional evidence exists to support such a mechanism. The alternative mechanism supported by kinetic data (Figure 7A) is formation of the dead-end BE complex, in which peptide binds the enzyme at the B binding site, such that binding of A is pre-vented from occurring. This mechanism for PRMT1 substrate inhibition seems logical, as the SAM binding site is occluded by an occupied peptide binding groove and inhabits a space contiguous to the arginine binding pocket, as observed in vari-ous PRMT crystal structures. These results, therefore, support the formation of a dead-end BE complex as an explanation for substrate inhibition observed within the oligomeric enzyme states that exist under low enzyme concentrations.
Despite the possibility of peptide binding first, the model presented by Zheng et al. and the evidence we present here both support the sequential ordered Bi–Bi mechanism for PRMT1. In their model, formation of a PRMT1:H4 complex was deemed catalytically inconsequential to methylation.[32] Here,
we demonstrate that the formation of a BE complex prevents productive cofactor binding. This kinetic mechanism is further supported by published ITC data suggesting that peptide sub-strates do not readily bind PRMTs in the apo form,[30–32]as well
as structural data that provide visual evidence for cofactor binding as a prerequisite to peptide docking.[25–29]
Conclusion
Our study reveals that PRMT1 enzyme kinetics are largely de-pendent on substrate sequence, enzyme processivity is a mul-tifactorial effect, and PRMT1 uses a sequential ordered Bi–Bi ki-netic mechanism. These results have many implications for the field. Future research into PRMT processivity needs to consider the effect of enzyme and cofactor concentration on perceived enzyme dimerization and processivity. The processive nature of PRMT1 at high enzyme concentrations, however, might not be representative of conditions within a biological system. Fur-thermore, our data demonstrate the importance of using mul-tiple linear plots as a complement to nonlinear analyses when interpreting kinetic data. The conflicting reports, therefore, might indicate previous misinterpretations that could be recti-fied through a more robust analysis of product inhibitor data sets. Our own results support published biophysical data that, although PRMTs can bind peptide substrate in the absence of cofactor, productive methylation is only accomplished if the peptide substrate binds in the presence of cofactor. In light of our findings and the structural and catalytic similarities be-tween PRMT family members, we surmise that these enzymes share a common mechanism.
Experimental Section
Peptides: The various PRMT1 substrate peptides (Table 1 and Table S1) were prepared following standard Fmoc solid-phase pep-tide synthesis (SPPS) protocols. The requisiteNh-hydroxy-l-arginine and Nh-methyl-l-arginine building blocks were prepared as previ-ously described.[58]Peptides were assembled on 2-chlorotrityl resin
(0.25 mmol scale). With the exception of the modified l-arginine building blocks, peptide couplings were performed by using pro-tected Fmoc amino acid (4.0 equiv), BOP reagent (4.0 equiv), and DIPEA (8.0 equiv) in DMF (total volume 10 mL) at ambient temper-ature for 1 h. Alternatively, incorporation of the modifiedl-arginine building residues was performed by using modified l-arginine building blocks (2.0 equiv), BOP reagent (2.0 equiv), and DIPEA (4.0 equiv) in DMF (total volume 10 mL) at ambient temperature overnight. Peptide couplings were verified by using the Kaiser and Bromophenol Blue tests. Upon completion of SPPS, peptides were cleaved from the resin and deprotected by using TFA/TIS/H2O
(95:2.5:2.5), followed by Et2O precipitation to yield the crude
pep-tides. Each peptide was purified to homogeneity by RP-HPLC, and its identity was confirmed by MS analysis.
The absorbance at 280 nm was used to estimate the concentra-tions of KRK, RKK, and R1 peptide soluconcentra-tions by using an extinction coefficient of 5500m@1cm@1for KRK and RKK, and 13 980m@1cm@1
for R1. The absorbance at 205 nm was used to estimate the con-centrations of H4 and eIF4A1 peptides by using an extinction coef-ficient of 31 mgmL@1cm@1.[71]The monomethylated and
asymmet-rically dimethylated RKK peptides were purchased from Canada Peptide.
Expression and purification of PRMT1: A rat PRMT1 H161Y mutant was used as humanized PRMT1.[50] Construction of the
pET28a(++)-His6-PRMT1 and pET28a(++)-mCerulean/mCitrine-His6
-PRMT1 plasmids was previously described, and -PRMT1 (UniProt Ac-cession ID: Q99873) proteins were expressed and purified accord-ing to established protocols.[50] Briefly, the plasmids were
trans-formed into BL21(DE3) plysS (Stratagene) cells, and protein expres-sion was induced at an OD600of 0.8 with isopropylb-d
-1-thiogalac-topyranoside (IPTG; 1.0 mm) at 308C with shaking at 250 rpm for 16 h. Cells were harvested by centrifugation at 10000gfor 15 min at 48C, and cell pellets were frozen at@808C. Thawed pellets were resuspended in lysis buffer (2 mL lysis buffer per gram of cell pellet): HEPES·KOH (50 mm, pH 7.6), NH4Cl (1.0m), MgCl2(10 mm),
Triton X-100 (0.1%, v/v), lysozyme (0.1%, w/v), DNAse 1 (25 UmL@1),b-mercaptoethanol (b-Me; 7.0 mm),
phenylmethanesul-phonyl fluoride (PMSF; 1.0 mm), and EDTA-free protease inhibitor cocktail (1.0 mm; Roche: 04693132001). Cells were further lysed at 48C by using a Branson Sonifier 450 with eight 30 s pulses at 50% duty cycle with 30 s pauses. The lysate was clarified through centri-fugation at 35000gfor 1 h at 48C and filtered through 0.45mm low protein binding Durapore membrane (Millipore). The lysate was applied to a pre-equilibrated HisTrap FF column (GE Health-care) with wash buffer [HEPES (50 mm, pH 7.6), NH4Cl (1.0m), MgCl2
(10 mm), b-Me (7 mm), imidazole (10 mm), PMSF (1 mm)]. The bound fraction was eluted by using the same buffer with imidazole (400 mm) added. Eluted fractions containing PRMT1 were pooled and applied to a pre-equilibrated HiLoad 26/600 Superdex 200 pg size-exclusion column (GE Healthcare) column. His6-PRMT1 was
ap-plied by using a Tris running buffer [Tris·HCl (50 mm, pH 7.5), NaCl (100 mm)]. Eluted fractions were pooled and concentrated by using Amicon Ultra 15 mL filters with 30 K molecular weight cut-off (MWCO; Millipore). Fractions appeared to be greater than 90% pure (Figure S1). His6-PRMT1 was further exchanged into storage
buffer [HEPES·KOH (100 mm, pH 8), NaCl (200 mm), DTT (1 mm), glycerol (10%), and EDTA (2 mm)].
The concentration of His6-PRMT1 was estimated according to the
Edelhoch method, in which absorbance at 280 nm of the dena-tured protein was measured in guanidine·HCl (6.6m) in potassium phosphate buffer (40 mm, pH 6.5).[72] Concentrations of mCit- and
mCer-PRMT1 were quantified by measuring the absorbance of the protein at 516 and 434 nm, respectively, and with extinction coeffi-cients of 77000 and 43000m@1cm@1, respectively.[73]
PRMT1 Michaelis–Menten enzyme kinetics: P81 filter binding assay: Reactions containing PRMT1 (200 nm),S-adenosyl-l
-[methyl-14C]-methionine ([14C]SAM; 58 mCimmol@1 in H
2SO4/ethanol (9:1,
10 mm); PerkinElmer NEC363050UC; 50mm), and increasing con-centrations of unmethylated, monomethylated, or hydroxylated substrate peptide (0.5–100mm) were incubated for 1 h at 378C in methylation buffer [HEPES (50 mm, pH 8.0), NaCl (10 mm), DTT (1.0 mm); total volume: 27mL]. The linear range was determined by incubating PRMT1 (200 nm) and [14C]SAM (50mm) with each
un-modified peptide (100mm) for 20–180 min (Figure S2). A P81 filter binding assay was used to measure PRMT1 activity in the presence of substrate, in which the positively charged peptides were immo-bilized onto Whatman P81 phosphocellulose filter paper (Fisher Scientific 3698-915).[74]Each reaction was spotted (12mL) onto the
counter. Linear ranges were determined by plotting methyl transfer versus time. The observed reaction rates were fitted to the Michae-lis–Menten equation (1) or MichaeMichae-lis–Menten substrate inhibition equation (2) by using SigmaPlot 12 (Systat), from which the appar-entKM,kcat,Vmax, and standard error values were estimated.
v¼ ðVmax½SAÞ=ðKMþ ½SAÞ ð1Þ
v¼ ðVmax½SAÞ=ðKMþ ½SAð1þ ½SA=KiÞÞ ð2Þ
Radioactive tricine gel assay: In order to estimate apparent PRMT1 enzyme kinetics with the R1 peptide, a radioactive gel assay was used. Reactions containing PRMT1 (200 nm), [14C]SAM
(50mm), and R1 peptide (0–100mm) in methylation buffer (total volume: 100mL) were incubated for 1 h at 378C. Reactions were concentrated by using a Savant ISS110 SpeedVac Concentrator (Thermo Scientific) on high temperature and speed for 1 h. Reac-tions were reconstituted in tricine sample buffer (32mL; Tris·HCl (50 mm, pH 6.8), glycerol (13%), SDS (0.2%), Coomassie Brilliant Blue G-250 (0.02%), andb-mercaptoethanol (0.4%)]. After loading each reaction (15mL) in duplicate on a tricine gel (16.5%), sample proteins and peptides were electrophoretically separated. After separation, peptides were fixed in gels by using glutaraldehyde (5%) in boric acid (0.5m, pH 6.2). The gels were stained with Coo-massie Brilliant Blue (0.025%). Each lane was excised and dissolved in hydrogen peroxide (30%, total volume: 4 mL) at 708C for 4 h in 20 mL scintillation vials (PerkinElmer 6000477).[75]Afterwards,
Scinti-verse E scintillation cocktail (10 mL) was added, and the mixture was stirred until a gel formed. The DPM of each sample was mea-sured, and apparent enzyme kinetic parameters were estimated as described above.
Peptide methylation analyses by mass spectrometry: Methyla-tion reacMethyla-tions containing PRMT1, SAM (in 0.5 mm HCl), and un-modified peptide in methylation buffer were incubated for 1 h at 378C. To stop the reaction and remove confounding automethyla-tion, PRMT1 was separated from reactions by filtration through a 30 K MWCO filtration device (VWR 82031-352) that was prewashed with deionized water (1 mL). Reactions were then transferred to 6V50 mm Pyrex glass tubes (Corning 9820-6) and dried in a Savant ISS110 SpeedVac Concentrator on high temperature and speed for 1.5 h. Dried reaction tubes were transferred to a reaction vial assembly (Eldex 1163), with HCl (6n, 200mL) in the bottom of the reaction vial. Samples were acid hydrolyzed in vacuo for 20– 24 h at 1108C by using a Waters Pico Tag work station. Each re-action was resuspended in mobile phase A [100mL; formic acid (0.1%) and trifluoroacetic acid (TFA; 0.05%) in water], and all in-soluble debris was removed by centrifugation to enable UHPLC-MS/MS analysis of MMA and aDMA production.
The UHPLC-MS/MS procedure closely followed a previously de-scribed method.[11] A Water Acquity UHPLC bridged ethylene
hybrid C18column (2.1 mmV100 mm) was used at a flow rate of
0.15 mLmin@1 at 458C. Mobile phase A (described above) and
mobile phase B [formic acid (0.1%), TFA (0.05%), and methanol (30%) in water] were used in a linear gradient of 0–100% phase B over 2.90 min. A Linear Ion Trap Quadrupole QTRAP 5500 mass spectrometer (Sciex 1024945-AM) was operated in positive-ion mode with electrospray ionization in multiple reaction monitoring mode to detect parent and product ions of MMA and aDMA. For MMA, a cone voltage of 30 V and 17 eV collision energy was used to detect the parent ion (189m/z) and product ion (74 m/z). For aDMA, a 30 V cone voltage and 20 eV collision energy were used to detect the parent ion (203 m/z) and product ion (46 m/z). A sample injection volume of 5.0mL was used. MMA and aDMA
standards were initially reconstituted in deionized water and were diluted in mobile phase A to prepare linear standard curves (0.02– 5.0mm). Concentrations of MMA and aDMA present in each reac-tion were interpolated from the standard curves, and the aDMA/ MMA ratios were calculated.
To observe methylation ratios of unmodified peptides under condi-tions used in the Michaelis–Menten enzyme kinetic assays, PRMT1 (200 nm), SAM (50mm), and each peptide (100mm) were incubated (total volume: 60mL) at 378C for 1 h. Reactions were subsequently subjected to PRMT1 removal, acid hydrolysis, and UHPLC-MS/MS analysis. To observe methylation ratios of unmodified peptides with variable substrate concentrations, all reactions contained PRMT1 (5.0mm) and one of the following conditions: limiting SAM (1.0mm) and excess substrate, corresponding to a concentration at least ten times higher than the KMvalue of each peptide (25mm
for H4, 300mmfor eIF4A1, 35mmfor KRK, and 130mmfor RKK); in-termediate SAM (10mm) and excess substrate; or limiting peptide substrate (10mm), and excess SAM (100mm) in triplicate (total volume: 60mL). To observe methylation ratios of unmodified pep-tides with increasing enzyme concentrations, reactions contained constant saturating concentrations of SAM (100mm), substrate concentrations at least ten times higher than the KM value as
before, and varying PRMT1 concentrations (0.2, 1.0, or 5.0mm)in at least duplicate (total volume: 60mL).
FRET assay: Reactions containing mCerulean-PRMT1 (100 nm; mCer-PRMT1) and mCitrine-PRMT1 (100 nm; mCit-PRMT1) fluores-cent proteins in methylation buffer were incubated with varying concentrations of KRK peptide, SAM, or SAH (0, 2.5, 5.0, 10, 20, 40, 50mm) at 378C for 1 h (80mL initial volume; the buffer-only control showed that small changes to the volume from the addition of stock solutions had a negligible impact on changes to FRET signal). Reactions were also prepared containing varying KRK peptide con-centrations in the presence of SAM (50mm) and varying SAM con-centrations in the presence of KRK peptide (50mm). PRMT1 dimeri-zation was assessed by exciting reactions in individual wells in a 384-well black polystyrene non-binding surface microplate (Corn-ing #3575) at 434 nm and measur(Corn-ing the fluorescence at 475 and 529 nm by using a Synergy MX microplate reader (BioTek) with ex-citation and emission slit widths of 9 nm and sensitivity adjusted with an 8 mm height correction from the upper plane of the sample wells. The ratios of fluorescence at 529 nm and 475 nm were calculated to measure FRET for each equilibrated reaction mixture.
PRMT1 product and substrate inhibition:A radioactive P81 filter binding assay (described above) was used to determine the kinetic mechanism of PRMT1 by using SAM or RKK substrate with SAH or RKK-aDMA inhibitor and PRMT1 (200 nm) in methylation buffer. Assays that contained constant RKK peptide (25 or 130mm) were performed with various SAM (0.5, 1.0, 5.0, 10, 25, 50mm) and vari-ous SAH (0, 0.5, 2.0, 5.0, 10, 25mm) or various RKK-aDMA (300, 450, 600, 800, 1000mm) concentrations. Assays that contained constant SAM (5.0 or 50mm) were performed with various RKK peptide (5.0, 10, 15, 25, 50, 100mm) and variable SAH (0, 0.5, 2.0, 5.0, 10, 25mm) or various RKK-aDMA (300, 450, 600, 800, 1000mm) concentrations. Data were interpreted through both quantitative nonlinear and qualitative linear analyses. For quantitative analysis, each data set was fit to equations corresponding to competitive [Eq. (3)], uncom-petitive [Eq. (4)], noncomuncom-petitive [Eq. (5)], and mixed [Eq. (6)] inhib-ition by using SigmaPlot 12 (Systat Software, Inc.),
v¼ Vmax½SA
v¼ Vmax½SA
KMþ ½SAð1þ ½IA=KiÞ ð4Þ
v¼ Vmax½SA
KMð1þ ½IA=KiÞ þ ½SAð1þ ½IA=KiÞ ð5Þ
v¼ Vmax½SA
KMð1þ ½IA=KiaÞ þ ½SAð1þ ½IA=KibÞ ð6Þ
in which Vmaxand KM were held constant. Best fitting of the data
was determined by comparing standard errors of the fits. For quali-tative analysis, Eadie–Hofstee [Eq. (7)], Lineweaver–Burk [Eq. (8)], and Hanes–Woolf [Eq. (9)] plots were generated directly from prod-uct inhibition data sets by using linear regression (i.e., transforma-tions of nonlinear models were not employed). These linear plots were used to visualize data and supplement nonlinear analyses.
v¼ Vmax
1þ ½IA=Kib@
ð1þ ½IA=KiaÞKM
1þ ½IA=Kib
v
½SA ð7Þ
1
v¼ð1þ ½VIAmax=KiaÞKM
1
½SA þ1þ ½VmaxIA=Kib ð8Þ ½SA
v ¼1þ ½VmaxIA=Kib½SA þ
ð1þ ½IA=KiaÞKM
Vmax ð9Þ
A radioactive P81 filter binding assay was similarly used to observe substrate inhibition of PRMT1 (200 nm) by using various concentra-tions of H4-OH substrate peptide (2, 5, 10, 25, 50, and 100mm) with various concentrations of SAM (1, 2, 5, 10, and 50mm). A Line-weaver–Burk [Eq. (8)] plot was directly generated from the data and used to observe apparent enzyme kinetic parameters under such conditions.
Acknowledgements
We thank Andr#s Szeitz for providing mentorship and expertise in mass spectrometry. This work was supported by the Natural Sciences and Engineering Research Council of Canada (NSERC) RGPIN-2015–04450 Discovery Grant (A.F.), NSERC CGS-M (J.I.B.), the Shaughnessy Hospital Volunteer Society Fellowship in Health Care (J.I.B.), and the Walter C. Koerner Fellowship (J.I.B.). Addition-al support provided by Utrecht University and the Netherlands Organization for Scientific Research is acknowledged (T.K., J.v.S., and N.I.M.).
Conflict of Interest
The authors declare no conflict of interest.
Keywords: enzyme catalysis · kinetics · peptides · protein modifications·transferases
[1] R. S. Blanc, S. Richard,Mol. Cell2017,65, 8–24. [2] M. Matsuoka,Seikagaku1972,44, 364– 370.
[3] W. K. Paik, S. Kim,Natural Occurrence of Various Methylated Amino Acid Derivatives, Wiley, New York,1975.
[4] B. Chang, Y. Chen, Y. Zhao, R. K. Bruick,Science2007,318, 444– 447. [5] A. Bçttger, M. S. Islam, R. Chowdhury, C. J. Schofield, A. Wolf,Biochem. J.
2015,468, 191 –202.
[6] A. Frankel, N. Yadav, J. Lee, T. L. Branscombe, S. Clarke, M. T. Bedford,J. Biol. Chem.2002,277, 3537– 3543.
[7] C. I. Zurita-lopez, T. Sandberg, R. Kelly, S. G. Clarke,J. Biol. Chem.2012, 287, 7859– 7870.
[8] W. J. Lin, J. D. Gary, M. C. Yang, S. Clarke, H. R. Herschman,J. Biol. Chem.
1996,271, 15034–15044.
[9] D. Chen, H. Ma, H. Hong, S. S. Koh, S. M. Huang, B. T. Schurter, D. W. Aswad, M. R. Stallcup,Science1999,284, 2174– 2177.
[10] J. Tang, J. D. Gary, S. Clarke, H. R. Herschman,J. Biol. Chem.1998,273, 16935 –16945.
[11] T. M. Lakowski, A. Frankel,Biochem. J.2009,421, 253–261.
[12] T. L. Branscombe, A. Frankel, J. H. Lee, J. R. Cook, Z. H. Yang, S. Pestka, S. Clarke,J. Biol. Chem.2001,276, 32971–32976.
[13] J. Lee, J. Sayegh, J. Daniel, S. Clarke, M. T. Bedford,J. Biol. Chem.2005, 280, 32890 –32896.
[14] J. R. Cook, J. H. Lee, Z. H. Yang, C. D. Krause, N. Herth, R. Hoffmann, S. Pestka,Biochem. Biophys. Res. Commun.2006,342, 472 –481.
[15] S. Gui, W. L. Wooderchak, M. P. Daly, P. J. Porter, S. J. Johnson, J. M. Hevel,J. Biol. Chem.2011,286, 29118– 29126.
[16] S. Gui, S. Gathiaka, J. Li, J. Qu, O. Acevedo, J. M. Hevel,J. Biol. Chem.
2014,289, 9320 – 9327.
[17] S. Gathiaka, B. Boykin, T. C#ceres, J. M. Hevel, O. Acevedo,Bioorg. Med. Chem.2016,24, 4949 –4960.
[18] E. W. Debler, K. Jain, R. A. Warmack, Y. Feng, S. G. Clarke, G. Blobel, P. Stavropoulos,Proc. Natl. Acad. Sci. USA2016,113, 2068 –2073. [19] K. Jain, R. A. Warmack, E. W. Debler, A. Hadjikyriacou, P. Stavropoulos,
S. G. Clarke,J. Biol. Chem.2016,291, 18299 –18308. [20] X. Zhang, X. Cheng,Structure2003,11, 509– 520.
[21] M. L. Pak, T. M. Lakowski, D. Thomas, M. I. Vhuiyan, K. Hesecken, A. Frankel,Biochemistry2011,50, 8226 – 8240.
[22] Y. H. Lee, S. S. Koh, X. Zhang, X. Cheng, M. R. Stallcup,Mol. Cell. Biol.
2002,22, 3621 –3632.
[23] H. Wu, W. Zheng, M. S. Eram, M. Vhuiyan, A. Dong, H. Zeng, H. He, P. Brown, A. Frankel, M. Vedadi, M. Luo, J. Min, Biochem. J. 2016, 473, 3049 –3063.
[24] T. C. Petrossian, S. G. Clarke,Mol. Cell. Proteomics2009,8, 1516 –1526. [25] W. W. Yue, M. Hassler, S. M. Roe, V. Thompson-Vale, L. H. Pearl,EMBO J.
2007,26, 4402 –4412.
[26] N. Troffer-Charlier, V. Cura, P. Hassenboehler, D. Moras, J. Cavarelli,EMBO J.2007,26, 4391 –4401.
[27] J. S. Sack, S. Thieffine, T. Bandiera, M. Fasolini, G. J. Duke, L. Jayaraman, K. F. Kish, H. E. Klei, A V. Purandare, P. Rosettani, S. Troiani, D. Xie, J. A. Bertrand,Biochem. J.2011,436, 331– 339.
[28] L. Bonnefond, J. Stojko, J. Mailliot, N. Troffer-Charlier, V. Cura, J. M. M. Wurtz, S. Cianf8rani, J. Cavarelli,J. Struct. Biol.2015,191, 175 –183. [29] P. A. Boriack-Sjodin, L. Jin, S. L. Jacques, A. Drew, C. Sneeringer, M. P.
Scott, M. P. Moyer, S. Ribich, O. Moradei, R. A. Copeland,ACS Chem. Biol.
2016,11, 763 –771.
[30] C. Wang, Y. Zhu, J. J. Chen, X. Li, J. Peng, J. J. Chen, Y. Zou, Z. Zhang, H. Jin, P. Yang, J. Wu, L. Niu, Q. Gong, M. Teng, Y. Shi,PLoS One2014,9, e87267.
[31] C. Wang, Y. Zhu, T. B. Caceres, L. Liu, J. Peng, J. Wang, J. Chen, X. Chen, Z. Zhang, X. Zuo, Q. Gong, M. Teng, J. M. Hevel, J. Wu, Y. Shi,Structure
2014,22, 756– 768.
[32] H. Hu, C. Luo, Y. G. Zheng,J. Biol. Chem.2016,291, 26722 – 26738. [33] M. S. Eram, Y. Shen, M. Szewczyk, H. Wu, G. Senisterra, F. Li, K. V. Butler,
H. 3. Kaniskan, B. A. Speed, C. dela SeÇa, A. Dong, H. Zeng, M. Schapira, P. J. Brown, C. H. Arrowsmith, D. Barsyte-Lovejoy, J. Liu, M. Vedadi, J. Jin, ACS Chem. Biol.2016,11, 772– 781.
[34] Y. Shen, M. M. Szewczyk, M. S. Eram, D. Smil, H. 3. Kaniskan, R. Ferreira De Freitas, G. Senisterra, F. Li, M. Schapira, P. J. Brown, C. H. Arrowsmith, D. Barsyte-Lovejoy, J. Liu, M. Vedadi, J. Jin, J. Med. Chem. 2016, 59, 9124 –9139.
[35] Y. Feng, N. Xie, M. Jin, M. R. Stahley, J. T. Stivers, Y. G. Zheng, Biochem-istry2011,50, 7033 –7044.
[36] O. Obianyo, T. C. Osborne, P. R. Thompson, Biochemistry 2008, 47, 10420 –10427.
[37] H. L. Rust, C. I. Zurita-Lopez, S. Clarke, P. R. Thompson, Biochemistry
2011,50, 3332 –3345.
[39] M. Wang, R. M. Xu, P. R. Thompson,Biochemistry2013,52, 5430– 5440. [40] L. Sun, M. Wang, Z. Lv, N. Yang, Y. Liu, S. Bao, W. Gong, R. M. Xu,Proc.
Natl. Acad. Sci. USA2011,108, 20538 –20543.
[41] O. Obianyo, P. R. Thompson,J. Biol. Chem.2012,287, 6062 –6071. [42] T. M. Lakowski, A. Frankel,J. Biol. Chem.2008,283, 10015 –10025. [43] X. Zhang, L. Zhou, X. Cheng,EMBO J.2000,19, 3509 –3519.
[44] M. Hasegawa, S. Toma-Fukai, J. D. Kim, A. Fukamizu, T. Shimizu,FEBS Lett.2014,588, 1942– 1948.
[45] W. C. Lee, W. L. Lin, T. Matsui, E. S. W. Chen, T. Y. W. Wei, W. H. Lin, H. Hu, Y. G. Zheng, M. D. Tsai, M. C. Ho,Biochemistry2015,54, 7514 –7523. [46] V. Cura, N. Marechal, N. Troffer-Charlier, J. M. Strub, M. J. van Haren, N. I.
Martin, S. Cianferani, L. Bonnefond, J. Cavarelli,FEBS J.2016,283, 77– 96.
[47] V. Cura, N. Troffer-Charlier, J. M. Wurtz, L. Bonnefond, J. Cavarelli,Acta Crystallogr. Sect. D2014,70, 2401 –2412.
[48] V. H. Weiss, A. E. McBride, M. A. Soriano, D. J. Filman, P. A. Silver, J. M. Hogle,Nat. Struct. Biol.2000,7, 1165 –1171.
[49] K. Higashimoto, P. Kuhn, D. Desai, X. Cheng, W. Xu,Proc. Natl. Acad. Sci. USA2007,104, 12318 –12323.
[50] D. Thomas, T. M. Lakowski, M. L. Pak, J. J. Kim, A. Frankel,Protein Sci.
2010,19, 2141 –2151.
[51] T. Osborne, O. Obianyo, X. Zhang, X. Cheng, P. R. Thompson, Biochem-istry2007,46, 13370 –13381.
[52] K. M. Dorgan, W. L. Wooderchak, D. P. Wynn, E. L. Karschner, J. F. Alfaro, Y. Cui, Z. S. Zhou, J. M. Hevel,Anal. Biochem.2006,350, 249 –255. [53] S. Gui, W. L. Wooderchak-Donahue, T. Zang, D. Chen, M. P. Daly, Z. S.
Zhou, J. M. Hevel,Biochemistry2013,52, 199– 209.
[54] K. Kçlbel, C. Ihling, K. Bellmann-Sickert, I. Neundorf, A. G. Beck-Sickinger, A. Sinz, U. Kehn, E. Wahle,J. Biol. Chem.2009,284, 8274 –8282. [55] M. Wang, J. Fuhrmann, P. R. Thompson,Biochemistry2014, 53, 7884 –
7892.
[56] S. Antonysamy, Z. Bonday, R. M. Campbell, B. Doyle, Z. Druzina, T. Gheyi, B. Han, L. N. Jungheim, Y. Qian, C. Rauch, M. Russell, J. M. Sauder, S. R. Wasserman, K. Weichert, F. S. Willard, A. Zhang, S. Emtage,Proc. Natl. Acad. Sci. USA2012,109, 17960 –17965.
[57] E. S. Burgos, C. Wilczek, T. Onikubo, J. B. Bonanno, J. Jansong, U. Reime, D. Shechter,J. Biol. Chem.2015,290, 9674 – 9689.
[58] D. Thomas, T. Koopmans, T. M. Lakowski, H. Kreinin, M. I. Vhuiyan, S. A. Sedlock, J. M. Bui, N. I. Martin, A. Frankel, ChemBioChem 2014, 15, 1607 –1613.
[59] H. Wang, Z. Q. Huang, L. Xia, Q. Feng, H. Erdjument-Bromage, B. D. Strahl, S. D. Briggs, C. D. Allis, J. Wong, P. Tempst, Y. Zhang, Science
2001,293, 853 –857.
[60] S. Huang, M. Litt, G. Felsenfeld,Genes Dev.2005,19, 1885– 1893. [61] W. L. Wooderchak, T. Zang, Z. S. Zhou, M. AcuÇa, S. M. Tahara, J. M.
Hevel,Biochemistry2008,47, 9456 –9466.
[62] C. H. Lin, H. M. Huang, M. Hsieh, K. M. Pollard, C. Li,J. Protein Chem.
2002,21, 447– 453.
[63] Q. Liu, G. Dreyfuss,Mol. Cell. Biol.1995,15, 2800 –2808.
[64] P. ’t Hart, D. Thomas, R. van Ommeren, T. M. Lakowski, A. Frankel, N. I. Martin,MedChemComm2012,3, 1235 – 1244.
[65] M. B. C. Dillon, H. L. Rust, P. R. Thompson, K. A. Mowen,J. Biol. Chem.
2013,288, 27872–27880.
[66] S. F. M. Van Dongen, J. A. A. W. Elemans, A. E. Rowan, R. J. M. Nolte, Angew. Chem. Int. Ed.2014,53, 11420 –11428;Angew. Chem.2014,126, 11604– 11612.
[67] R. Zhou, Y. Xie, H. Hu, G. Hu, V. S. Patel, J. Zhang, K. Yu, Y. Huang, H. Jiang, Z. Liang, Y. G. Zheng, C. Luo,J. Chem. Inf. Model.2015,55, 2623 – 2632.
[68] J. E. Dowd, D. S. Riggs,J. Biol. Chem.1965,240, 863– 869. [69] W. W. Cleland,Adv. Enzymol. Relat. Areas Mol. Biol.1967, 1–32. [70] I. H. Segel,Enzyme Kinetics: Behaviour and Analysis of Rapid Equilibrium
and Stead-State Enzyme Systems, Wiley, New York1993. [71] R. K. Scopes,Anal. Biochem.1974,59, 277 –282. [72] H. Edelhoch,Biochemistry1967,6, 1948– 1954.
[73] M. L. Markwardt, G. J. Kremers, C. A. Kraft, K. Ray, P. J. C. Cranfill, K. A. Wilson, R. N. Day, R. M. Wachter, M. W. Davidson, M. A. Rizzo,PLoS One
2011,6, e17896.
[74] G. Blum, G. Ib#Çez, X. Rao, D. Shum, C. Radu, H. Djaballah, J. C. Rice, M. Luo,ACS Chem. Biol.2014,9, 2471– 2478.
[75] R. Young, H. Fulhorst,Anal. Biochem.1965,11, 389 –391.