Cover Page
The handle http://hdl.handle.net/1887/67090 holds various files of this Leiden University dissertation.
Author: Houwelingen, M.J. van
Title: Measurement numeracy education for prospective elementary school teachers :
effects of inductive and deductive teaching on classroom interaction and student performance
Mark van Houwelingen
Measurement Numeracy Education for Prospective
Elementary School Teachers
Effects of inductive and deductive teaching on classroom interaction and student
Measurement Numeracy Education for Prospective
Elementary School Teachers
Effects of inductive and deductive teaching on classroom interaction and student
performance
Houwelingen, Mark J. van
Measurement Numeracy Education for Prospective Elementary School Teachers: Effects of inductive and deductive teaching on classroom interaction and student performance
Copyright © 2018 Mark van Houwelingen Printed by Hogeschool Rotterdam Uitgeverij
All rights reserved. No part of this book may be reproduced, stored in a retrieval system, or transmitted, in any form or by any means, electronically, mechanically, by photocopy, by recording, or otherwise, without prior written permission from the author.
Measurement Numeracy Education for Prospective Elementary School Teachers: Effects of inductive and deductive teaching on classroom interaction and student performance
PROEFSCHRIFT
Ter verkrijging van de graad van doctor aan de Universiteit Leiden, op gezag van de Rector Magnificus prof. mr. C.J.J.M. Stolker,
volgens besluit van het College voor Promoties te verdedigen op dinsdag 27 november 2018
klokke 11:15 uur
Promotor:
prof. dr. W. J. Heiser
Copromotores:
dr. C. M. van Putten
dr. E. J. van Schooten (Hogeschool Rotterdam)
Leden van de promotiecommissie:
prof. dr. P.H. Vedder prof. dr. F.J.J.M. Janssen
dr. R. Keijzer (Hogeschool iPabo Amsterdam/Alkmaar) dr. M. Hickendorff
Acknowledgement:
v
Table of contents
1 General introduction ... 1
1.1 Measurement numeracy ... 2
1.2 Instructional practices ... 4
1.3 The didactic factor: deductive versus inductive teaching ... 7
1.4 The factor classroom interaction ... 8
1.5 Contents of this dissertation ... 11
2 Research participants ... 13
2.1 Introduction ... 13
2.2 Sample characteristics... 13
2.3 Participation in pretest and posttest, and lesson attendance ... 14
2.4 Student characteristics ... 16
2.5 Correspondences and differences between student characteristics ... 18
2.6 Conclusion ... 26
3 Dimensionality of measurement numeracy ... 27
3.1 Introduction ... 27
3.2 Method ... 28
3.2.1 Research groups ... 29
3.2.2 Instruments and procedures ... 29
3.2.3 Data analyses ... 32
3.3 Results ... 33
3.3.1 Results of the pilot study ... 33
3.3.2 Results of the main study ... 34
3.4 Conclusion ... 38
3.5 Discussion ... 38
4 Development of the lesson series ... 41
4.1 Introduction ... 41
4.1.1 Background on classroom interaction ... 42
4.1.2 Background on measurement ... 43
4.2 Method ... 45
4.3 Results ... 47
4.3.1 Interviews ... 47
4.3.2 Results of the focus group meetings ... 48
4.3.3 Results of the final revision ... 53
4.4 Discussion ... 55
5 Effects on classroom interaction ... 59
5.1 Introduction ... 59
vi
5.2.1 Sample ... 60
5.2.2 Materials ... 61
5.2.3 Data analyses ... 64
5.3 Results ... 65
5.3.1 Between-groups effects ... 65
5.3.2 Within-groups effects ... 71
5.4 Conclusion and discussion ... 76
6 Effects on student performance ... 79
6.1 Introduction ... 79
6.2 Method ... 80
6.2.1 Sample ... 80
6.2.2 Materials ... 80
6.2.3 Design and procedure ... 81
6.2.4 Statistical analyses ... 82
6.3 Results ... 89
6.4 Conclusion and discussion ... 94
7 General discussion ... 97
7.1 Conclusions ... 97
7.1.1 Test construction and measurement of numeracy sub-skills ... 97
7.1.2 Development of the lesson series ... 98
7.1.3 Effects on classroom interaction ... 100
7.1.4 Effects on student performance ... 100
7.2 Limitations ... 101
7.3 Future directions ... 103
7.4 Final remarks ... 107
References ... 109
List of Figures ... 119
List of Tables ... 121
Appendix ... 123
Nederlandse samenvatting ... 127
Dankwoord ... 133
1
CHAPTER 1
General introduction
This dissertation examines classroom interaction and two different didactic approaches (deductive and inductive) to the teaching of the measurement aspect of numeracy (measurement numeracy) to students of elementary school teacher training colleges. An important goal of the research is to estimate the effect of these approaches on classroom interaction and on student performance. Before going directly into the details of the research, let us first look at what measurement numeracy entails, and the challenges that teacher educators face. Measurement numeracy includes the following aspects: estimating measures, understanding relationships within the metric system, calculating with scale, and calculating length, area and volume. For instance, students learn how to convert units in the metric system, and how to calculate the size of a scale model of a living room or an airport. Do you remember how you learned to do that, and how your understanding grew? Let us look at a problem in this mathematical domain.
The volume of a pack of lemonade is 1.5 liters. The pack is 7.5 cm long, and 1 dm wide. Calculate the height of the pack. Explain.
2
complexity, a chain of competences of all teachers and learners involved is set out in the text box below.
teacher trainers’ understanding of measurement,
teacher trainers’ ability to solve measurement problems, teacher trainers’ ability to teach measurement and to guide prospective teachers in their learning,
↓
prospective teachers’ ability to learn about measurement, prospective teachers’ understanding of measurement,
prospective teachers’ ability to solve measurement problems, prospective teachers’ ability to teach measurement and to guide pupils in their learning,
↓
pupils’ ability to learn about measurement, pupils’ understanding of measurement,
pupils’ ability to solve measurement problems.
This introduction provides a framework for this research by discussing the role of different instructional practices within mathematics education and their influence on students’ numeracy. Classroom interaction and two specific didactical approaches (inductive and deductive) will be discussed in more detail. Measurement numeracy is defined, and the need for research on classroom interaction and didactic approaches in mathematics classes within teacher training colleges is argued. The final paragraph gives an overview of the contents of each chapter in this dissertation.
1.1 Measurement numeracy
Many students, even in higher education, have difficulty keeping up with elementary school mathematics (Expertgroep Doorlopende Leerlijnen, 2008; National Research Council, 2001). This is also true for students at teacher training colleges, who are expected to teach
mathematics to elementary school children later on. These students are more likely to perform worse if they lack numeracy skills (Hill, Rowan, & Loewenberg Ball, 2005). In the
3
Although this norm for prospective teachers seems rather low (Van Zanten & Van den Brom-Snijders, 2007), many first-year students (25%) do not pass this test (Keijzer & Hendrikse, 2013). Especially freshmen with MBO1 education, who accounted for 36% of the Dutch
teacher training college freshmen between 2007 and 2012, seem to lack numeracy skills: on average, their WISCAT score has been 97, which is below the norm of 103 (Eggen & Straetmans, 2013). While for most learners it might be enough to know only one strategy to solve a problem, and gain only procedural knowledge, prospective teachers must also have conceptual knowledge of mathematics (Anderson, 1983; Hiebert, 2013). For teaching to be effective, a high level of professional knowledge is required, including a firm grasp of the mathematics itself (Ball, Thames, & Phelps, 2008; Shulman, 1986). The Royal Netherlands Academy of Arts and Sciences (KNAW) suggested that immediate action is required to improve the quality of mathematics education in Dutch teacher training colleges (KNAW, 2009).
Elementary school mathematics in The Netherlands encompasses the following domains: whole numbers, ratios, decimals, percentages, fractions, data representation (diagrams, tables, graphs), geometry, and measurement (Van Zanten, Barth, Faarts, Gool, & Keijzer, 2009). Teacher training colleges cover the same domains. Mathematics curricula in the United States and high-performing Asian countries have many similarities (Chen, Reys, & Reys, 2009), and they differ only slightly from the Dutch curriculum. Some Dutch teacher training colleges choose to teach numeracy and the didactics of mathematics in the same courses; others choose to teach those subjects separately. The teacher training college of Rotterdam University of Applied Science (where this research took place) has eight separate numeracy courses in its curriculum, in addition to the didactics courses. Although it is not known how teacher training students perform on different aspects of numeracy nationwide, the experience of the School of Education of Rotterdam University of Applied Sciences is that measurement is one of the aspects that leaves the most room for improvement. Also, the Trends in International Mathematics and Science Study (TIMSS) shows that on average, Dutch elementary school children score lower on measurement in comparison with their
4
overall mathematics score (524 versus 540 in TIMSS 2011, 522 versus 535 in TIMSS 2007) (Mullis, Martin, Foy, & Arora, 2012, p. 142; Mullis, Martin, Foy, & Arora, 2008, p. 120). For that reason, this study focuses on the measurement aspect of numeracy. In this dissertation we refer to measurement as the process of determining dimensions of a physical object (we will not capture the measurement of mental states like anxiety or happiness). In measurement courses, students learn to structure and quantify reality by estimating measures through developing personal reference measurements, by understanding relationships within the metric system, by calculating with scale, and by calculating length, area, and volume.
Measurement differs from, for example, whole numbers, ratios, decimals, percentages, and fractions, in that there is an obvious relationship between measurement and daily practice, also in most text books and mathematics classes. In the past, calculations with whole
numbers, fractions, and ratios were mostly exercised without any context (i.e.: 27 + 49 = …, ¾ x 16 = …). Nowadays, influenced by the Realistic Mathematics Education (RME)
movement (e.g. Gravemeijer, 1997; Torbeyns, Verschaffel, & Ghesquière, 2005; Treffers, 1993), most educators make an effort to use contexts as the basis for learning, even for simple calculations. However, pupils still need to learn specific procedures (the most efficient ones), and they are still required to solve problems without any context. In most measurement problems, students need to read and interpret a context, establish a plan to find the answer, select the appropriate strategies, models, and/or procedures, perform the calculations, and formulate an answer. It would appear that one needs more and other skills for measurement numeracy than for other mathematical domains. This may affect instructional practices, which will be discussed in the next section.
1.2 Instructional practices
5
discovery (when students need it, and which can gradually be decreased as student skills grow) can be useful (Alfieri, Brooks, Aldrich, & Tenenbaum, 2011; National Research Council, 2013). In Tobias and Duffy’s Constructivist Instruction (2009), several authors from both sides (for or against constructivism) shed light on constructivism. Even though most constructivist authors think that constructivist instruction leads to better results, many believe that more traditional approaches may be favorable for well-structured domains like
mathematics (Schwartz, Lindgren, & Lewis, 2009; Spiro & DeSchryver, 2009). Mayer (2009) states that constructivism is a theory of learning (not of teaching: there is much confusion about that difference in the literature), and that students’ behavior in discovery learning does little for learning (whereas cognitive activity does). Kirschner (2009) argues that children may not have the necessary skills for discovery learning, as most adults do. Clark (2009) and Sweller (2009) argue that children need accurate and complete demonstrations, because they need to imitate an expert, and Fletcher (2009) shows empirical evidence indicating that drilling and practicing have positive effects on student performance, that students appreciate this approach, and that it costs less time than discovery learning.
Under the influence of constructivists, mathematics education shifted from teachers explaining (traditional teaching) how and why rules apply and how and why procedures work, to guiding (reform teaching) students in their individual knowledge construction, and from aiming for students’ procedural expertise to discovery learning that starts in informal contexts and allegedly allows students to acquire deeper understanding about strategies (Gravemeijer, 1997; Kilpatrick, Swafford, & Findell, 2001). Before constructivism, the aim of mathematics education was to make sure students were flawlessly able to follow procedures, and to put them into practice in increasingly difficult problems. Constructivist ideas caused mathematics education to shift towards guiding students to construct meaning from their own experience, which emerges from interaction between students, and from meaningful and increasingly complex contexts. Reflection on how tasks were performed, self-regulation, cooperation with peers and problem-solving became increasingly important aspects of mathematics education. Piaget for instance believed that students do not learn enough simply from the transfer of information. Instead, they should construct their own knowledge (Ultanir, 2012). However, when students construct their own knowledge, they may also create their own misconceptions (VanLehn, 1990).
In the Netherlands, RME was questioned by Van de Craats (2007) at a national
6
constructivist learning on student outcomes is not always as high as constructivists would like (Birenbaum & Dochy 1996), and recent empirical research on solving multiplication and division problems (Fagginger Auer, 2016, p. 120) suggested that “while attention to informal strategies may be fruitful in the earlier stages of the educational process, performance may benefit from a focus on standardized procedures at the end of the instructional trajectory”. Van Putten and Hickendorff (2006) reported the strong effect of teachers on students’ use of strategy in division problems, and showed that 40% of the teachers used a traditional teaching method, even though they worked with reform-type textbooks: the enacted curriculum often differed from the intended curriculum. They also showed that when compared with 1997, in 2004, more pupils answered division problems by heart (instead of a less risky written calculation). Since there are strong performance differences between strategies (Fagginger Auer, Hickendorff, Van Putten, Béguin, & Heiser, 2016), it is likely that teachers’ didactic approach will affect student performance. At present, some Dutch elementary schools revert to mathematics textbooks that use a traditional approach. One reason for this may be the required high level of teacher skills: if teachers do not adequately put the RME principles into practice, results may suffer (Gravemeijer, Bruin-Muurling, Kraemer, & Van Stiphout, 2016).
The mathematics teaching of teacher educators not only has an effect on prospective teachers’ numeracy, it also has an effect on how prospective teachers form their ideas on how to teach mathematics in elementary schools. Although teacher educators might make other educational choices in their classes with prospective teachers than elementary school teachers would in their classes with pupils, teacher educators must be aware of the possibility that prospective teachers might see them as role models. Prospective teachers may use the teacher educator’s educational methods in the elementary school class. For example, how discovery learning (Bishop, Clopton, & Milgram, 2012; Boaler & Staples, 2008) is used in class, might depend on the previous knowledge of the group. While elementary school pupils might not possess the knowledge about what needs to be discovered, chances are that in a group of prospective teachers some will have various ideas on the subject, because they learned about it earlier. With discovery learning, perhaps possessing previous knowledge of the subject is an advantage, because without that, it will be difficult to discover anything.
7
specific didactic approaches regarding mathematics teaching: a deductive approach and an inductive approach.
1.3 The didactic factor: deductive versus inductive teaching
Deductive reasoning is viewed as the most certain way of reasoning: if the premises are true, and the rules of logic are followed, the conclusion must necessarily be true. An example of deductive reasoning is the following: 1) the pressure of an enclosed gas is directly
proportional to its temperature, i.e. P1/T1 = P2/T2, 2) therefore, the pressure of an enclosed gas
increases if its temperature increases. Inductive reasoning, however, does not hold this certainty, it is a probabilistic type of reasoning. An example of inductive reasoning is the following: 1) I got a meal every day for the last five years, 2) therefore, I will probably get a meal tomorrow. The difference between the two types of reasoning is clear, especially if you think of the inductive reasoner as a turkey on the day before Thanksgiving (e.g. Bertrand Russel’s famous example). Although inductive reasoning is uncertain, we must still rely on it, because in most practical cases (for example in educational research settings: which didactic approach works best? Or in everyday life: should I take an umbrella with me?) we lack the certain laws to reason deductively.
In a deductive mathematics class, the teacher explains a general rule, after which students apply the rule in different contexts (top-down teaching). For example: after
explaining the concept of ‘area’, the teacher explains how to calculate the area of a rectangle: by multiplying length by width. After that, students apply the rule to calculate the areas of different rectangles. Inductive reasoning searches for generalizations from specific contexts, whereas deductive reasoning searches for applications from a generalization (Klauer,
Willmes, & Phye, 2002). In an inductive mathematics class, the teacher introduces one or more contexts, after which students search for the general rule that connects similar contexts (bottom-up teaching). For example:
How many squares of 1 cm by 1 cm are in this rectangular chocolate bar? What is the area of this rectangle?
If the rectangle were 3 squares in length, and 5 squares in width, what would be the area? If the rectangle were 2.5 squares in length, and 4 squares in width, what would be the area? If a rectangle were 2 cm by 6.3 cm, what would be the area?
8
The deductive approach relates to traditional mathematics teaching, and the inductive approach relates to discovery learning. Most of us would not dispute the need for students to be able to apply rules in different contexts. However, despite claims that guiding students to rediscover rules might induce deeper understanding, not everyone believes that all students need to learn how to rediscover already existing generalizations (either because these
generalizations do not require rediscovery, or because these claims have not been sufficiently substantiated). Besides that, most standard exams do not test for rediscovery skills. Some argue that bottom-up teaching is more time consuming than top-down teaching. Others argue that bottom-up teaching induces deeper understanding and active learning, which shortens instructional time in the future, and gives students advantages after they leave school (Schwartz et al., 2009).
1.4 The factor classroom interaction
In our aim to improve the quality of numeracy courses, other factors that correlate positively with student performance may also play a role. The aim of identifying these factors in the Netherlands is shared with many other countries, one of which being the Unites States of America. The National Mathematics Advisory Panel (NMAP) in the USA studied 16,000 research reports and concluded that only a small number showed significant effects of instruction variables on student performance in mathematics. Positive effects on student performance were found in studies in which teachers keep learners productively engaged, and give them opportunities to help each other to learn (Slavin & Lake, 2008). Based on the available empirical evidence, Slavin and Lake concluded that the didactics and curricula have less effect on student performance in mathematics than classroom interaction between
students and with the teacher. Although these positive effects have only been found in elementary schools, we expect to find the same effects in teacher colleges. After all, productively engaged students probably learn more than silent listeners, and sharing mathematical ideas and discussing them with peers and the teacher probably sharpens the mathematical mind of teacher college students, too. Hence, we hypothesize that improving classroom interaction in mathematics classes will have a positive effect on student
performance.
9
discussions, dialogues, discussing theorems, quizzing, allowing room for questions after instruction, instruction through classroom interaction, scaffolding2, asking students to develop
test questions and discussing them, et cetera (Roefs, 2010). Classroom interaction can be organized in several ways, for example: in discussions involving the whole class, in smaller student groups where students interact with each other and where the teacher divides his time between groups, or in unguided student groups followed by whole class evaluation. In
addition to these activity structures, research on classroom interaction also focused on classroom norms, identity, student engagement, student thinking, student argumentation, encouraging argumentation, animating and positioning students, re-voicing, and high-level questioning, but little research has been done on patterns in classroom talk itself (Pearson, 2008). Pearson concluded that students benefit from “elevated responsive classrooms” (teachers who ask the right question at just the right time, who ask students to elaborate on their own or others’ ideas, instead of giving away the answers too soon).
Effective mathematics teaching includes engaging students in classroom discussions and allowing them to share and learn about mathematical ideas and arguments on how and why things work, so that they learn to see things from different perspectives (Leinwand et al., 2014). Alfieri et al. (2011) suggest that teachers should use scaffolding to guide students in their tasks, give timely feedback on student explanations, and/or provide worked examples. Conversations on content should be deep and meaningful (Alexander, 2008), in order to optimize chances that students will come up with fundamental ideas, big ideas. “A Big Idea is
a statement of an idea that is central to the learning of mathematics, one that links numerous mathematical understandings into a coherent whole” (Charles & Carmel, 2005, p. 10). An example is the Big Idea of equivalence: representation of numbers and measures can be done in many different ways (Askew, 2013). 50% is equivalent to 1/2 and 0.5; 999 is equivalent to 9 times 100 plus 9 times 10 plus 9 times 1, but it is also equivalent to 1 times 1000 minus 1 times 1 (which is very helpful in multiplication by 999); 100 cm is equivalent to 10 dm and to 1 m. Although it is sometimes more prudent to explain and evaluate, as students may not always make fundamental discoveries (Charles & Carmel, 2005), using students’
mathematical ideas in classroom interaction has proven to have a positive influence on student performance (Pearson, 2008).
10
Asking questions is one of the most obvious starting points of classroom interaction. The depth of the classroom interaction depends greatly on the type of questions. Consider the two following questions: 1) A scale model of the Statue of Liberty (scale 1:1000) is 9.3 cm high, what is the height of the Statue of Liberty? 2) Ashley says that a scale model of the Statue of Liberty (scale 1:1000) cannot be higher than a bottle of milk, what do you think about this? The second type of question is more likely to induce critical thinking and a deep discussion around mathematical ideas than the first (Nelissen, 2002). The didactic approach also affects classroom interaction. In an inductive approach, classroom interaction will be mainly about students’ ideas while they are rediscovering mathematical rules and concepts. Teachers ask questions like: “Are you sure about your idea, is it certain? What do you think of Mike’s strategy?”. In a deductive approach, classroom interaction will be mainly about
students’ application of rules and concepts that have been explained by the teacher. Teachers ask questions like: “Which rule applies here, and why? How do you proceed?”.
Research has been done on many different aspects of classroom interaction in mathematics classes, but analysis of classroom interaction is time consuming, so most quantitative research in this area uses small samples. Therefore, little is known about the effects of particular aspects of classroom interaction on student performance (Pierson, 2008). This is also true for students’ classroom interaction time (the part of classroom interaction that is taken up by student talk). Although Pierson coded different kinds of classroom discourse, estimation of the effects on student performance was done using ratios between different types of classroom discourse, without accounting for the time spent on the discourse, and without accounting for the time students talked. Since the time students talk might be an indicator for student engagement, which has a positive effect on student performance (Slavin & Lake 2008), measuring classroom interaction time differences across didactic approaches might shed a light on the effectiveness of these approaches.
To this day, how types of teacher questions and classroom interaction time vary across didactic approaches, remains unknown. In this dissertation, the differential effects of a
11
1.5 Contents of this dissertation
To estimate differential effects of an inductive and a deductive didactic approach on classroom interaction and on students’ measurement numeracy, a field experiment was conducted at the teacher training college (School of Education) of the Rotterdam University of Applied Sciences. Sample characteristics are reported in Chapter 2. After evaluating the dimensionality of measurement numeracy (using confirmatory factor analyses: is
13
CHAPTER 2
Research participants
2.1 Introduction
This dissertation describes a) the development of a test for measurement numeracy of elementary school teacher training college students, b) the development, in focus groups, of two lessons series on measurement numeracy (one with a deductive didactic approach, one with an inductive didactic approach), c) the measurement of certain aspects of classroom interaction, and d) the effects of teachers and of the two didactic approaches on learning outcomes (with a pretest-intervention-posttest design).
The research was conducted at the School of Education at Rotterdam University of Applied Science (RUAS). RUAS has one of 27 elementary school teacher training colleges in the Netherlands (27 different colleges spread over 41 separate locations in 2017). Rotterdam is one of the three Dutch cities with the highest immigrant percentages (around 50%, whereas the national mean was approximately 20% in 2017). In this chapter the samples are
characterized.
2.2 Sample characteristics
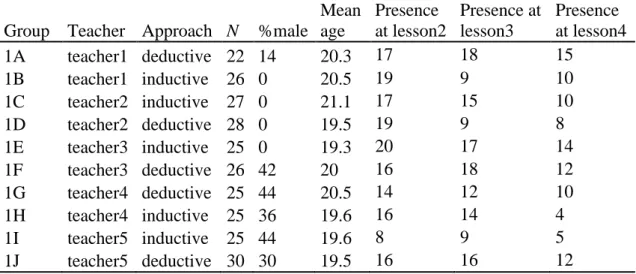
The sample for the test development (a) consisted of 264 RUAS freshmen in the academic year 2013-2014 (pilot study), and 259 RUAS freshmen in the academic year 2014-2015 (main study). Table 2.1 shows how many of them participated in the pretest, and how many of them participated in the posttest.
Table 2.1. Number of students (percentage of males) in pretest and posttest in 2013-2014 and 2014-2015; Mean age in years.
14
In the academic year 2013-2014, the sample for the development of lesson series (b) consisted of five out of nine RUAS mathematics teachers. These five teachers, three women, and two men (mean age 40 years, range 33-55, with a mean teaching experience of eight years, range 3-15), participated in two focus groups.
The samples for the measurement of classroom interaction (c) consisted of the five RUAS teacher educators who participated in the focus groups, 259 RUAS freshmen, and two master psychology students (who coded the classroom interaction from the recorded lessons), in the school year 2014-2015. The sample for the main study (d) was the same as the sample of (c) (without the master students).
2.3 Participation in pretest and posttest, and lesson attendance
Of the total of 259 freshmen in 2014-2015, 153 participated in both the pretest and the posttest (see Table 2.2). Many students (94) did not participate in the posttest: 2 for personal reasons, and 92 because they left school between the pretest and the posttest (it is a common phenomenon for students to reconsider their academic career at Christmas of their first year, which fell between the pretest and the posttest). Reasons for not participating in the
compulsory pretest (i.e. no motivation, ill, etc.) were not recorded.
Table 2.2. Number of students who participated (or not) in the pretest and the posttest.
posttest yes no total pretest yes 153 57 210
no 12 37 49 total 165 94 259
Teachers were pre-assigned to the 10 pre-existing student groups by the School of Education administration. Each of the five teachers taught two student groups, one group using a
deductive didactic approach, and one group using an inductive didactic approach. Under these conditions, student groups were randomly assigned to the didactic approach, using the
15
Table 2.3. Number of students (number of males in parentheses) in each student group, for the 153 students participating in both the pretest and the posttest (left), and for the whole sample of 259 students (right).
Made both tests Whole sample Deductive Inductive Deductive Inductive Teacher 1 16 (0) 18 (0) 22 (3) 26 (0) Teacher 2 23 (0) 9 (0) 28 (0) 27 (0) Teacher 3 15 (8) 19 (0) 26 (11) 25 (0) Teacher 4 14 (6) 18 (6) 25 (11) 25 (9) Teacher 5 12 (2) 9 (2) 30 (9) 25 (11) Total 80 (16) 73 (8) 131 (34) 128 (20)
Note: In an attempt to reduce the number of male dropouts, RUAS decided to form four student groups with only females, because otherwise male students would form a very small part in all groups. As a result, most male students were in the groups of teacher 3 (deductive), teacher 4 and teacher 5.
Since the lessons were not mandatory for students, not all students attended all lessons. Reasons for not attending (i.e. no need, no motivation, ill, etc.) were not recorded. Attendance was only recorded for lessons 2, 3, and 4 (see Chapter 3). Table 2.4 shows the attendance per lesson. Mean attendance percentages (over the three lessons) did not differ much per
condition (made both tests: M deductive = 60%; M inductive = 59%; whole sample: M
deductive = 48%; M inductive = 48%), but they did differ per teacher (made both tests: M
teacher 1 = 75%; M teacher 2 = 50%; M teacher 3 = 68%; M teacher 4 = 47%; M teacher 5 = 56%; whole sample: M teacher 1 = 61%; M teacher 2 = 43%; M teacher 3 = 60%; M teacher 4 = 38%; M teacher 5 = 38%).
Table 2.4. Percentage of students attending class, per lesson, for the 153 students in both the pretest and the posttest (left), and for the whole sample of 259 students (right).
Made both tests Whole sample lesson2 lesson3 lesson4 lesson2 lesson3 lesson4
Mean % 73% 56% 50% 60% 45% 38%
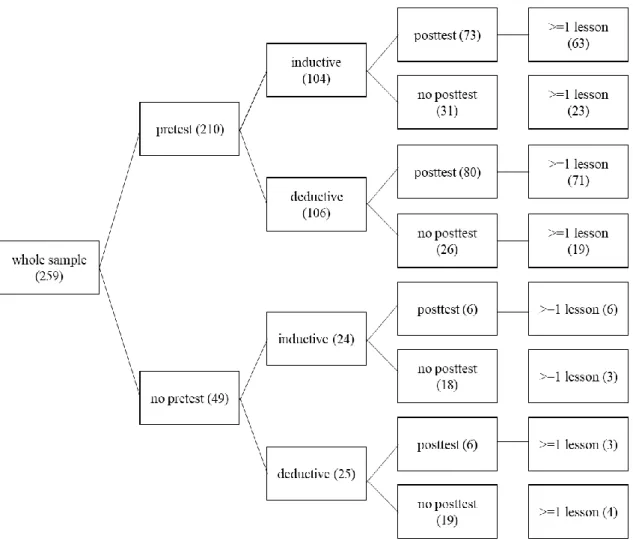
Figure 2.1 gives an overview of the number of students, split by a) whether or not they
16
Figure 2.1. Number of students in the whole sample, split by pretest participation, condition, and posttest participation (lesson attendance in the last column)
2.4 Student characteristics
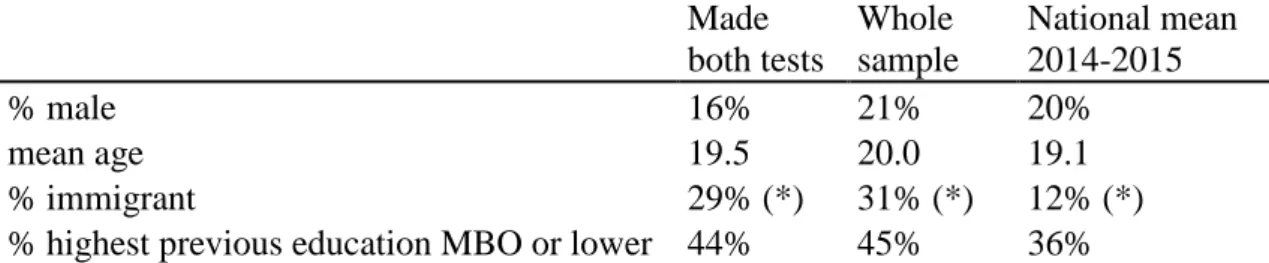
Compared to national means, the sample had substantially more immigrants, and more
17
Table 2.5. Percentage of males, mean age, percentage immigrants, and highest previous education for the 153 students who participated in both the pretest and the posttest (left), and the whole sample of 259 students (middle), compared to national numbers in 2014-2015 (right) (Central Bureau for Statistics, 2018).
Made both tests Whole sample National mean 2014-2015
% male 16% 21% 20%
mean age 19.5 20.0 19.1
% immigrant 29% (*) 31% (*) 12% (*)
% highest previous education MBO or lower 44% 45% 36%
(*) In the sample the home language was recorded. If a student spoke another language besides Dutch at home, the student was categorized as immigrant. In the sample of 153 students who made both tests, 35 students were immigrant, and 84 students spoke only Dutch at home (34 students did not answer this question). The CBS data included the origin of the student (a student is labelled immigrant, unless the student and both parents were born in The Netherlands).
The mean WISCAT (a mandatory national mathematics test for elementary school teacher training college freshmen) score of the whole sample was 99.0. 133 students had not yet passed this test (the norm is 103), and 31 students had not taken this test prior to the posttest. This mean was substantially lower than the national mean between 2007 and 2012 (see Table 2.6). This difference might be partially explained by the higher percentage of immigrants (mean WISCAT score 90.0, versus 103.0 for native students) and of MBO or lower educated students (mean WISCAT score 86.8, versus 108.2 for HAVO or higher educated students) in the sample (see Table 2.5).
Table 2.6. Mean WISCAT score of students in the Netherlands participating in the WISCAT test for the first time, for the 153 students who participated in both the pretest and the posttest (left), and the whole sample of 259 students (middle), compared to national mean between 2007 and 2012 (right) (Eggen & Straetmans, 2013).
Made both tests Whole sample National mean between 2007-2012
M SD M SD M
100.9 24.9 99.0 25.7 112.9
18
Table 2.7. Percentage of students’ and their parents’ highest previous education, for the 153 students who participated in both the pretest and the posttest (left), and the whole sample of 259 students (right).
Made both tests Whole sample
students mothers fathers students mothers fathers
MBO or lower 44% 44% 42% 45% 33% 31%
HAVO or higher 56% 25% 24% 55% 20% 20%
unknown 0% 31% 34% 0% 47% 49%
Note. Dutch children attend elementary school between the ages of four and twelve. After that, the elementary school advises children - depending on their potential - to continue their education at preparatory middle-level applied education (VMBO), higher general continued education (HAVO), or preparatory scholarly education (VWO). Many pupils with a VMBO-diploma go on to Secondary vocational education (MBO). MBO is oriented towards vocational training, and takes up to four years, depending on the level of training. Holders of a level 4 MBO certificate may go on to higher professional education (HBO). HBO in the Netherlands (for example: the teacher training college) is open to graduates of MBO, HAVO, and VWO. If a student is 21 years old or older, and does not hold a VWO, HAVO, or MBO degree, a successful admission test can also grant access to the teacher training college.
Table 2.8. Number of students in the sample who scored sufficiently at mathematics in their previous education, compared to students who did not follow mathematics classes or scored insufficiently, for the 153 students who participated in both the pretest and the posttest (left), and the whole sample of 259 students (right).
Made both tests Whole sample
sufficient 64 88
no math or weak 55 71
unknown 34 100
Total 153 259
2.5 Correspondences and differences between student characteristics
In addition to describing separate student characteristics, as is shown above, relationships between student characteristics may shed another light on the sample. An important part of these relationship analyses was to find out whether or not student characteristics differed between the two experimental conditions and between teachers. After all, for example, if it were the case that 90% of the students who scored high on the pretest were taught with a deductive approach, it would be more difficult to compare the two conditions properly. A Categorical Principal Component Analysis (CATPCA) (Meulman & Heiser, 2012) was used to describe correspondences and differences between student characteristics. CATPCA (or: non-linear PCA) is a dimension reduction technique, with which students and variables can be represented in a low dimensional space.
19
score, age (interval variables, which were treated as ordinal variables), student education, gender (dichotomous variables, which were treated as ordinal variables3), and father’s
education, mother’s education, home language, and mathematical history (categorical
variables, which were treated as nominal variables). The last four variables were dichotomous variables with a fair number of missing values. To preserve object standardization (M=0 and
SD=1), we chose to impute a particular value (3) for missing values for these four variables, and to impute the mean for missing values for pretest score and WISCAT score. Outlier effects were diminished for the variables age (categories 16 and 17 were merged, and categories 31 and 32 were merged with category 29) and pretest score (scores of 27 through 31 were merged with 26), and the large amount of different WISCAT scores was reduced by creating eleven categories. With CATPCA, three values (one value for each dimension) were calculated per student. The greater the distance between two different student points, the more student characteristics between those two students differ.
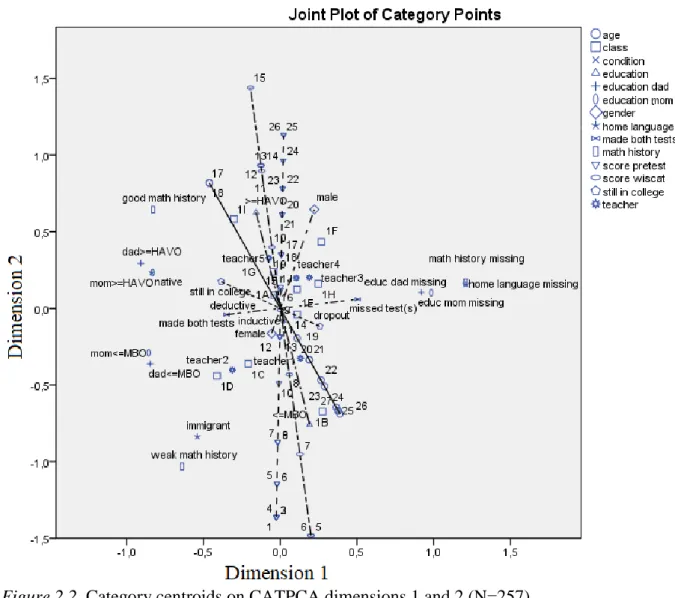
As we expected, the first CATPCA dimension was a ‘missing data dimension’: a dimension that separated students with and without missing data (see Figure 2.2). All centroids of the missing data (for the variables math history, home language, mother’s education, and father’s education) are on the right side, and the centroids for the other values for those variables are all on the left. The centroids for ‘still in college’ and for ‘completed both tests’ are also divided between left and right, because overall, dropouts and students who did not make both tests took up the most part of the missing data. Figure 2.2 shows that the other variables scarcely loaded on this missing data dimension. This means that neglecting this dimension would result in minimal information loss. Therefore, we focused on the other two dimensions.
20
Figure 2.2. Category centroids on CATPCA dimensions 1 and 2 (N=257)
Figure 2.3 shows the scores per student on the other two dimensions. The 257 points
(standardized: M=0 and SD=1) show quite a continuous spread of student scores: there are no separate clusters of students, and there are no clear spaces without any students. If, for
21
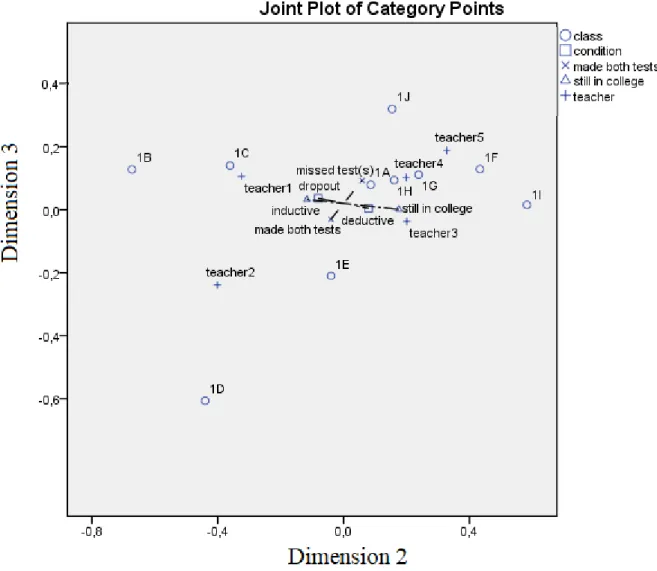
Figure 2.3. Students’ standardized scores on the CATPCA dimensions 2 and 3 (N=257)
Note. Scores were standardized with M = 0 and SD = 1.
Note. Two outliers were removed: one because even though the WISCAT and pretest score were extremely high, this student dropped out (and other student characteristics were missing); the other because the student made no pretest, no posttest, and no WISCAT (and did not attend any lessons).
22
Figure 2.4 indicates that students over 18 years old often had a weaker mathematical background, as well as a lower education (which is to be expected, since the MBO route to teacher training college takes two years longer than the HAVO route). Dimension 2 seems to be mostly made up of pretest score, WISCAT score, previous education, and math history (low scores on the left, high scores on the right). Dimension 3 seems to be mostly made up of mother’s and father’s education (high scores at the top, low scores at the bottom). Home language, age, and gender seem to contribute to both dimensions. Figure 2.4 shows the following subgroups of students: students with a weak math history and a low previous
23
Figure 2.4. Category centroids of active variables on the CATPCA dimensions 2 and 3 (N=257)
24
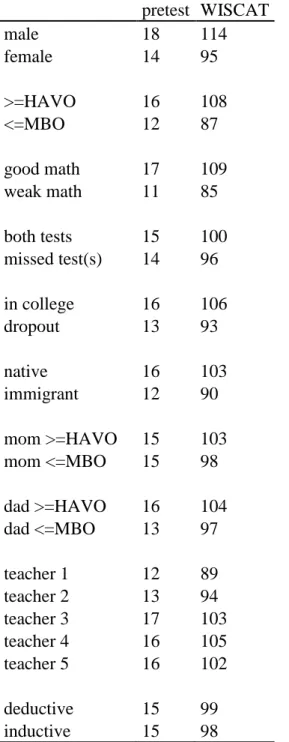
Table 2.9. Mean pretest score and mean WISCAT score of different student categories.
pretest WISCAT
male 18 114
female 14 95
>=HAVO 16 108
<=MBO 12 87
good math 17 109
weak math 11 85
both tests 15 100 missed test(s) 14 96
in college 16 106
dropout 13 93
native 16 103
immigrant 12 90
mom >=HAVO 15 103 mom <=MBO 15 98
dad >=HAVO 16 104 dad <=MBO 13 97
teacher 1 12 89
teacher 2 13 94
teacher 3 17 103
teacher 4 16 105
teacher 5 16 102
deductive 15 99
inductive 15 98
25
solution is shown as was presented in Figure 2.4 (and in Figure 2.3), but now only the supplementary variables are shown, and the scale of the dimensions is different from the one in Figure 2.4.
Figure 2.5. Category centroids of supplementary variables on the CATPCA dimensions 2 and 3 (N=257)
26
college at the end of the school year (mean pretest score 16, and mean WISCAT score 106) was also at a distance from the centroid of the students who left school at or prior to the posttest (mean pretest score 13, and mean WISCAT score 93). The centroid of students who completed both the pretest and the posttest was also separate from the centroid of the students who missed one or both tests, but the mean scores on the pretest and the WISCAT did not differ very much.
2.6 Conclusion
Compared to national means, the sample had substantially more immigrants, and more students in the sample had a previous education of MBO or lower. The average of the sample students’ WISCAT scores was lower than the national average.
In the sample, immigrants, female students, students with a previous education of MBO or lower, and students with a weak mathematical background scored relatively lower on
WISCAT than native students, male students, students with a higher previous education, and students with a solid mathematical background. Higher WISCAT scores seemed to
correspond with higher pretest scores, which means that, overall, students who scored higher on WISCAT (which measures overall numeracy) also scored higher on the pretest (the specific subject of measurement numeracy).
For the intervention study, student differences between conditions and teachers were
27
CHAPTER 3
Dimensionality of measurement numeracy
Prospective elementary school teachers' measurement numeracy: one skill?
3.1 Introduction
Since many teacher training college students do not have all necessary basic mathematics skills and understanding (see Chapter 1), most teacher training colleges offer numeracy courses, either during or supplementary to didactics courses. The teacher training college at Rotterdam University of Applied Science (RUAS School of Education) chose to offer
didactics and numeracy courses separately. Although student performance across the country on different aspects of numeracy is unknown, the RUAS experience is that measurement is one of the aspects that leaves the most room for improvement. Since it is also true that Dutch elementary school children score lower on measurement than on other aspects of mathematics (Mullis et al., 2012; Scheltens et al., 2013), this study focuses on the measurement aspect of numeracy. In this chapter we will refer to the measurement aspect of elementary school numeracy as ‘measurement numeracy’. We will not capture the measurement of mental states like anxiety or happiness; we will refer to measurement numeracy as the ability to reason with the length, area, volume, or weight of physical objects. We did not find a shared
conceptualization of measurement in the literature. In the Dutch knowledge base for elementary school mathematics teachers (Van Zanten et al., 2009), four different measurement numeracy sub-skills are mentioned: estimating measures, understanding relationships within the metric system, calculating with scale, and calculating length, area and volume. These four sub-skills, along with time and money calculus and the ability to use and interpret results from measurement instruments (Treffers, de Moor, & Feijs, 1994), are also the measurement base for Dutch mathematics elementary school textbooks (Huitema et al., 2011) and for Dutch teacher trainer college textbooks (Gravemeijer et al., 2007; Van den Heuvel-Panhuizen & Buijs, 2004). In TIMSS (Mullis & Martin, 2013), measurement and geometry are conceptualized together. The sub-domain geometric measurement contains the following topic areas: estimate lengths, areas and volumes, and select and use appropriate measurement formulas for perimeters, circumferences, areas, surface areas, and volumes. Converting units in the metric system is not mentioned separately in the TIMSS
28
showed that although there are differences in topic weight and learning expectations within the measurement strand, curricula in de US and high-performing Asian countries have many similarities.
To guide students in their efforts to improve their measurement numeracy, we need to know what this concept entails: is it an umbrella over the above mentioned distinguishable sub-skills, or is it just a single skill? Does measurement numeracy have more than one dimension, and if so, how do the underlying sub-skills relate to each other? If measurement numeracy boils down to a single skill, teachers do not need to differentiate between different sub-skills. On the other hand, if it encompasses more than one skill, students may be good at one sub-skill and poor at another, which would have consequences for didactics in the classroom, for testing students and diagnostics, and for determining goals for every single sub-skill related to the importance of any of them. Understanding of the dimensionality of measurement numeracy is also important for research in this domain. After all, if
measurement numeracy has more than one dimension, all underlying sub-skills must be identified and operationalized.
Although there is a long tradition of dividing measurement numeracy into different aspects (Treffers, 2015), we did not find any previous research on the dimensionality of measurement numeracy. Hence, little is known about whether distinguishing between the four above mentioned different sub-skills is justified. The goal of this study is therefore to
determine whether estimating measures, understanding relationships within the metric system, calculating with scale and calculating length, area, and volume reflect one and the same skill, or if they are indeed separate skills. In this study we answer the following research questions: 1) Do estimating measures, understanding relationships within the metric system,
calculating with scale and calculating length, area, and volume reflect one and the same student skill, or do they reflect separate student skills? 2) To what extent do the distinguished measurement numeracy sub-skills correlate with each other?
3.2 Method
29
factor could not be identified in the pilot study (see the results section of the pilot study). We used items with a high item-total correlation to maximize reliability, and items varying in p-value for differentiation purposes. The purpose of the main study was to find out whether or not the four hypothesized factors could be identified, and the extent to which these factors correlate with each other.
3.2.1 Research groups
The research group for the pilot study consisted of all RUAS freshmen (N=264), of which 221 students participated in the pretest (181 women, 82 %). The mean age of the sample at pretest was 19.7 years (range 17-29, SD 2.2). Of these freshmen, 188 participated in the posttest (157 women, 84 %). Their mean age at posttest was identical. The research group for the main study (a year later) consisted of all RUAS freshmen (N=259), of which 210 freshmen participated in the pretest (169 women, 80 %). Their mean age at pretest was 19.7 years (range 16-32, SD 2.5). 165 freshmen participated in the posttest (137 women, 83 %). Their mean age at posttest was 19.5 years (range 17-31, SD 2.2). Since the tests were compulsory for students, most of them participated in the pretest. Not all students participated in the posttest, as some of them left school between the pretest and the posttest.
3.2.2 Instruments and procedures
To find out whether measurement numeracy should be viewed as one skill or a set of four sub-skills, test items have been developed for all four sub-skills (i.e. hypothesized factors). The items concerning understanding relationships within the metric system form the factor
understanding relationships within the metric system, the items concerning calculating with scale form the factor calculating with scale, et cetera.
For the pilot study, we created six subtests (A1, A2, B1, B2, C1, and C2) of 24 items (six items per sub-skill, a total of 144 unique items). Each subtest was taken by an average of 74 students in the pretest and by an average of 63 students in the posttest. Students in the pilot study took two subtests in the pretest, and two other subtests in the posttest.
30
five unique items in the main study pretest, five unique items in the posttest, and five items appeared in both the posttest and the pretest. Table 3.1 shows examples of test items per hypothesized sub-skill.
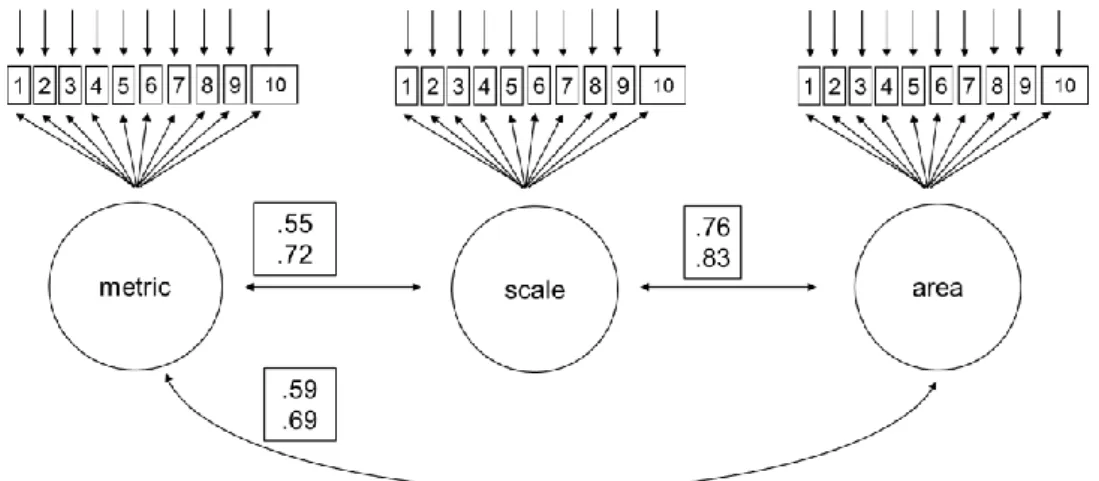
Figure 3.1. Structural model of measurement numeracy in the main study, with factor correlations (pretest correlations above, posttest correlations below)
31
Table 3.1. Item examples per hypothesized sub-skill.
Estimating measures (in the tests we included a picture per item): Estimate the size of the stairway step.
Estimate the volume of the standard household bucket.
Understanding relationships within the metric system: 0,034 km = ……… dm
450 are = ……… m².
Calculating with scale:
The distance from Rotterdam to Paris is 450 km. My map has a scale of 1: 3,000,000. How many cm is the distance from Rotterdam to Paris on my map? Explain.
On my map the area of the living room is 5 dm². In real life the area of the living room is 45 m². Explain how you find the scale that was used for my map.
Calculating length, area, and volume:
The area of a rhombus is 16 dm². One diagonal is twice as long as the other. Determine the size of the diagonals, and explain.
The volume of a pack of lemonade is 1.5 liter. The pack has a length of 0.75 dm and a width of 1 dm. Calculate the height of the pack, and explain.
32
3.2.3 Data analyses
Measurement numeracy construct validity was determined using confirmatory factor analyses (CFA) on the pretest and posttest of both studies. These CFAs showed us the extent to which the data supported the theoretic model that was the basis for the test construction. Using the CFAs, we could verify whether or not the items that were supposed to measure a certain sub-skill did indeed reflect only that sub-sub-skill, and not another measured sub-sub-skill (Thompson, 2004) as well, and whether four different sub-skills, or less than four, could be identified. We used the program Mplus (Muthén & Muthén, 2013) for the CFAs. The CFAs were performed using the WLSMV estimation method (Weighted Least Squares parameter estimates with robust standard errors and Mean and Variance) because the items were scored dichotomously (Brown, 2006). We tested the nested models using a .05 significance level. Since the CFAs were carried out using WLSMV, the nested models could not be compared by creating a χ2 -test by subtracting χ2-values and degrees of freedom. For that reason, model fits were
compared using the Difftest option in Mplus. These model fits were compared using three different fit indices. We used χ2 to verify if the models fit. Since the χ2 sensitivity to sample size is too strict for most social research (MacCallum, Browne, & Sugawara, 1996), the Root Mean Square Error of Approximation (RMSEA) and Comparative Fit Index (CFI) were also used. RMSEA is an absolute fit-index used to determine how well a model fits the data. CFI is also an absolute fit-index, but also an incremental fit-index used to determine the relative fit improvement over a nested model with uncorrelated variables.
We determined the model fits for factor models in the pilot study. To see if a 4-factor model fits better than a 1-4-factor model, i.e. to ascertain whether we can distinguish four different sub-skills or only one skill, we also determined model fits for 1-factor models for pretest and posttest data. As these two models are nested, we could also test if a model with more factors fits significantly better than a model with only one factor. If this is not the case, we should choose the most parsimonious model: the 1-factor model. If a factor was
33
3.3 Results
3.3.1 Results of the pilot study
The pilot study showed that the factor understanding relationships within the metric system, the factor calculating with scale and the factor calculating length, area, and volume could be identified, and that the factor estimating measures could not be identified. Over half (52 %) of the items that were supposed to measure the estimating measures sub-skill did not load
significantly on the factor, and the item loadings of the items that did load significantly on that factor were rather low (mean .54, SD .15) (See Appendix).
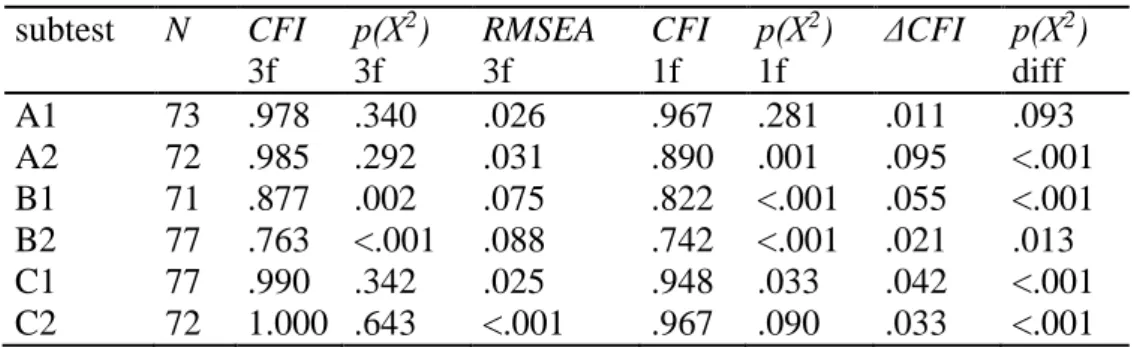
Since 4-factor models did not fit, we removed the estimating measures items and tested whether or not a 3-factor model fit the data better than a 1-factor model. Table 3.2 and Table 3.3 illustrate the model fit indices of 3-factor models and 1-factor models for the pilot study pretest and posttest (without the estimating measures items). We see that Χ2 was
significant for some of the subtests. Since the χ2 sensitivity to sample size is too strict for most
34
Table 3.2. Model fit of 3-factor models and 1-factor models for the pilot study pretest (without estimating measures items), and difftest to determine if a 3-factor model fits significantly better than a 1-factor model.
subtest N CFI
3f
p(Χ2)
3f
RMSEA
3f
CFI
1f
p(Χ2)
1f
ΔCFI p(Χ2)
diff A1 73 .978 .340 .026 .967 .281 .011 .093 A2 72 .985 .292 .031 .890 .001 .095 <.001 B1 71 .877 .002 .075 .822 <.001 .055 <.001 B2 77 .763 <.001 .088 .742 <.001 .021 .013 C1 77 .990 .342 .025 .948 .033 .042 <.001 C2 72 1.000 .643 <.001 .967 .090 .033 <.001
Table 3.3. Model fit of 3-factor models and 1-factor models for the pilot study posttest (without estimating measures items), and difftest to determine if a 3-factor model fits significantly better than a 1-factor model.
subtest N CFI
3f
p(Χ2)
3f
RMSEA
3f
CFI
1f
p(Χ2)
1f
ΔCFI p(Χ2)
diff A1 65 .821 .074 .053 .752 .027 .069 .004 A2 58 .868 .113 .053 .762 .020 .106 .002 B1 59 .801 .022 .067 .752 .007 .049 .040 B2 61 .957 .073 .057 .917 .005 .040 <.001 C1 64 .996 .467 .009 .934 .264 .062 .018 C2 69 .779 .023 .062 .511 <.001 .268 <.001
3.3.2 Results of the main study
Table 3.4 shows that that Χ2 for the 3-factor model is significant for the pretest and the posttest. We looked at RMSEA, CFI, and the difference between CFIs (ΔCFI) of the two models. Overall, a model fit is fair if CFI ≥ .90, and good if CFI ≥ .95 (Bentler, 1992; Hu & Bentler, 1999).
35
Table 3.4. Model fit of 3-factor models and 1-factor models for the pretest and posttest of the main study, and difftest to determine whether or not a 3-factor model fits significantly better than a 1-factor model.
test N CFI 3f
p(Χ2)
3f
RMSEA 3f
CFI 1f
p(Χ2)
1f
ΔCFI p(Χ2)
diff pre 210 .925 < .001 .064 .846 < .001 .079 < .001 post 165 .950 .004 .035 .910 < .001 .040 < .001
Factor correlations among the three identified factors were between .55 and .83. Correlations were slightly higher in the posttest than in the pretest (see Table 3.5). Factor loadings for all items were significant (see Table 3.6 and Table 3.7). In confirmatory factor analyses, any particular item’s factor loading is estimated for one factor only (i.e. the sub-skill the item is supposed to measure). The other factor loadings were constrained to be zero (see the empty entries in Table 3.6 and Table 3.7).
Table 3.5. Factor correlations of the main study 3-factor model.
model F2-F1 F3-F1 F3-F2
pre .55 .59 .76
36
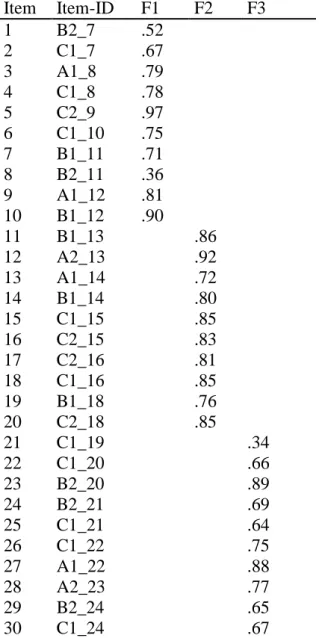
Table 3.6. Factor loadings main study pretest 3-factor model.
Item Item-ID F1 F2 F3
1 B2_7 .52
2 C1_7 .67
3 A1_8 .79
4 C1_8 .78
5 C2_9 .97
6 C1_10 .75
7 B1_11 .71
8 B2_11 .36
9 A1_12 .81
10 B1_12 .90
11 B1_13 .86
12 A2_13 .92
13 A1_14 .72
14 B1_14 .80
15 C1_15 .85
16 C2_15 .83
17 C2_16 .81
18 C1_16 .85
19 B1_18 .76
20 C2_18 .85
21 C1_19 .34
22 C1_20 .66
23 B2_20 .89
24 B2_21 .69
25 C1_21 .64
26 C1_22 .75
27 A1_22 .88
28 A2_23 .77
29 B2_24 .65
30 C1_24 .67
Note: all loadings were significant.
Note: the empty entries in this table are factor loadings that were constrained to be zero.
Note: the item-ID’s show the correspondence to the pilot items, i.e. item-ID B2_7 is the 7th item of subtest B2.
37
Table 3.7. Factor loadings main study posttest 3-factor model.
Item Item-ID F1 F2 F3 1 B2_7 .67
2 A1_8 .55 3 A2_8 .81 4 B2_9 .62 5 B2_10 .76 6 C1_10 .75 7 B2_11 .63 8 C1_11 .43 9 A2_12 .69 10 A1_12 .78
11 A2_13 .73
12 C1_13 .66
13 C2_14 .71
14 A1_14 .68
15 C2_15 .74
16 B1_15 .65
17 A2_16 .52
18 C2_16 .79
19 C2_17 .69
20 C2_18 .33
21 B2_20 .45
22 C2_20 .65
23 B1_21 .72
24 B2_21 .79
25 A1_22 .73
26 B1_22 .77
27 B2_23 .59
28 A2_23 .74
29 B2_24 .65
30 A1_24 .81
Note: all loadings were significant.
Note: the empty entries in this table are factor loadings that were constrained to be zero.
Note: the item-ID’s show the correspondence to the pilot items, i.e. item-ID B2_7 is the 7th item of subtest B2.
Note: pretest items 1, 3, 6, 8, 9, 12, 13, 16, 17, 20, 23, 24, 27, 28, and 29 were anchor-items, which corresponded with posttest items 1, 2, 6, 7, 10, 11, 14, 15, 18, 20, 21, 24, 25, 28, and 29.
38
Table 3.8. Reliability of the main study item sets (10 items for metric, scale and area sub-skill).
N Metric Scale Area pre 210 .854 .909 .831 post 165 .727 .743 .809 Note: Since the items are binary, we ran KR-20 (Kuder-Richardson 20) analyses.
3.4 Conclusion
Understanding relationships within the metric system, calculating with scale, and calculating length, area, and volume do not reflect one and the same student skill, they reflect
distinguishable student sub-skills. The hypothesized factor estimating measures could not be identified. This means that this study could not identify estimating measures as a
distinguishable student sub-skill. From Table 3.5 we can conclude that the overlap in
explained variance (squared factor correlations) was between 30% (F2-F1, pretest) and 69% (F2-F3, posttest), which could raise questions about whether or not the three sub-skills are really distinguishable student sub-skills. However, since a 3-factor model fit the data
significantly better than a 1-factor model in both the pretest and the posttest, we can conclude that these three factors in fact reflect separate student sub-skills. This means that it may be beneficial to differentiate between these sub-skills in testing and in mathematics classes.
3.5 Discussion
The correlation between the factor calculating with scale and the factor calculating length, area, and volume (.83 in the posttest, so about 69% overlap in explained variance) is rather high. The reason for this high correlation may be that students need to come up with a model from the context and perform calculations for items of both of these factors. By contrast, students did not have to calculate anything (apart from powers of ten) for the understanding relationships within the metric system items. Since the factor correlations of the factor
39
Many textbook items within the measurement domain test several sub-skills
simultaneously . For example: if we ask for the volume in liters of a pack of apple juice when we know that the pack is 7.5 cm long, 10 cm wide and 20 cm high, we test whether or not students are able to calculate the volume, and at the same time whether or not students are able to convert measures within the metric system. Although students must eventually be able to combine these skills when answering questions, this study shows that these two sub-skills are distinguishable sub-skills. This finding could be an argument for testing these sub-sub-skills separately. One could also choose to use cognitive diagnosis models, with which sub-skills can be separately measured in tests with items that test several sub-skills at a time (Henson & Douglas, 2005).
The results of this study show that understanding relationships within the metric system, calculating with scale and calculating length, area, and volume are separate student sub-skills. This is what we would expect, as these sub-skills are traditionally mentioned separately (Treffers, 2015), for example in the Dutch knowledge base for elementary school mathematics teachers (Treffers, de Moor, & Feijs, 1994; Van Zanten et al., 2009), and in Dutch teacher trainer college textbooks (Gravemeijer et al., 2007; Van den Heuvel-Panhuizen & Buijs, 2004). However, we were unable to verify that estimating measures is a separate student sub-skill. The reason why we were unable to identify this factor might be that we used rather small sample sizes in the pilot study (an average of 68 students per subtest), and that we used dichotomous scoring (we did not analyze how far off estimations were, if they were false). However, since half of the items did not load significantly on the factor, and most factor loadings were low (on average lower than .4, see Appendix), the possibility that
estimating measures is a factor after all, is small. Another reason might be that we tested the estimation sub-skill with different categories of items: weight, length, area and volume. Perhaps it would require the use of other strategies, knowledge and skills to estimate within these different aspects. Which skill is needed to estimate the length of a classroom, the volume of a trunk, or the weight of a bicycle? It might not be safe to assume that students answer these questions using one and the same strategy (i.e. think of a reference measure and compare it with the object that requires estimation). Morewedge and Kahneman (2010), showed that information that just happened to pop into the mind of a student (like a previous item), might have a larger effect on the answer than the information teachers believe to be relevant. If a previous item contains information about a car that weighs 1200 kg, students’ estimate of the weight of a bicycle will be higher than it would be if the previous item
40
judge considers a possible value of a quantity before judging that quantity: the final estimates are assimilated to the anchor. There is direct evidence that associative processes are involved, and that the anchor selectively retrieves compatible information" (Morewedge & Kahneman, 2010, p. 437). It might also be that estimating measures is not a student skill at all, and that a student’s answers to these items are determined by other aspects, such as personality
(inclination to exaggerate or underestimate). Furthermore, a student’s life experience might be a factor in the estimation process: the bicycle repair man’s daughter is likely to correctly estimate the height of a bicycle wheel because of her experience with bicycles, and the baker’s son is likely to correctly estimate the weight of a loaf of bread. If estimating measures
is a separate student sub-skill, we would have found shared variance in the analyses of student responses, but we did not. Therefore, it might be wise to consider changing how we teach students to estimate measures and how we test students on the way they estimate measures.
A limitation of this study is that we only measured the responses of students of the Rotterdam School of Education, and not those of other students or elementary school pupils. Nevertheless, this study is a first step towards creating theory around the dimensionality of measurement numeracy. This study could be an example for teachers who would like to know whether they are measuring separate skills with their tests. We conclude that further research is needed on what estimating measures is about and how it correlates with other sub-skills within the measurement aspect of numeracy. We recommend verification of whether
estimating measures is one skill, or a subset of sub-skills (for example measuring length,
measuring area, measuring volume, and measuring weight)under a large sample of
41
CHAPTER 4
Development of the lesson series on measurement
Classroom interaction in a deductive and in an inductive approach
4.1 Introduction
Since Slavin and Lake (2008) conclude that the didactics and curricula4 have less effect on
student performance in mathematics than classroom interaction between students and the teacher has (see Chapter 1), we hypothesize that improving classroom interaction in mathematics classes will have a positive effect on student performance.
Classroom interaction can be guided in many ways: classroom discussions, dialogues, discussing theorems, quizzing, allowing room for questions after instruction, instruction through classroom interaction, scaffolding, asking students to develop test questions and discussing them, et cetera (Roefs, 2010). Traditional mathematics education suggests a deductive approach to this interaction, where students are taught how and why rules and procedures work: a rule is explained and a procedure is modeled, before students apply this procedure in different contexts and discuss how they used the rule or the procedure (Van de Craats, 2007). Interaction in this deductive approach is mostly vertical (between students and the teacher). The Realistic Mathematics Education movement (RME), however, suggests an inductive approach to this interaction, where students are guided in their joint reinventions of mathematical insights: a realistic context is chosen as a playground for discovering
mathematical procedures and rules (Treffers, 1993). Although the teacher introduces the context and guides the reinvention process, in this inductive approach, interaction about the mathematical context is mostly horizontal (between students).
The purpose of this study is to describe the development of lesson series on
measurement for prospective elementary school teachers using both approaches: one with a